Introduction
Team sports players are required to perform repeated maximal or near-maximal efforts to develop power, acceleration, speed and speed endurance (Attene et al., 2014; Austin et al., 2011). Previous research has revealed that aerobic fitness is positively linked with the ability to recover from high-intensity efforts, with clear implications for successful physical performance during the game (Tomlin and Wenger, 2001; Vazquez-Guerrero et al., 2018). Some researchers have attempted to study the importance of repeated-sprint performance in different team-sports, highlighting the information related to the locomotor profile (Buchheit et al., 2010; Spencer et al., 2005). Previous reports have shown that during competitive basketball games, players perform an average of 105 high-intensity bouts (2 to 6 s), occurring every 21 s (McInnes et al., 1995), with the sprint intensity varying between 15 m∙min-1 (Scanlan et al., 2011) and 19 m∙min-1 (Ben Abdelkrim et al., 2010). Therefore, the ability to perform repeated sprints throughout the game seems a key factor for high-level performance (Padulo et al., 2016).
Overall, previous reports have shown that the amount of high-intensity actions decreases in the last minutes of the game. The reduced number of high-intensity actions at the end of the first and the second half seems to be a result of fatigue caused by several physiological mechanisms during the game (Lyons et al., 2006). In this sense, the decrease of high-intensity running throughout the game reflects that the ability, to recover from high-intensity bursts may constraint not only physical demands within team sports but also the collective behavior (Esteves et al., 2015).
A considerable number of studies have been developed to understand better the biomechanical and physiological benefits of repeated-sprint training stimuli (Padulo et al., 2016; Paulauskas et al., 2018). Repeated-sprint performance seems to be influenced by the duration, intensity, quantity and distribution of work bouts (Gaitanos et al., 1993) and emerging evidence support that repeated-sprint training provides potential biomechanical and physiological stimuli that are crucial to high-level performance in team sports, especially at specific moments within game situations (Spencer et al., 2005). High-intensity actions performed at maximal or near-maximal efforts are discriminant abilities of successful teams, thus several investigations have addressed the effects of manipulating repeated-sprint variables such as the distance (between 5 and 80 m) (Dawson et al., 1998; Lockie et al., 2014), the number of sprints (between 3 and 15 repetitions) (Lockie et al., 2014; Nebil et al., 2014), duration (3–7 s) (Mohr et al., 2007; Nebil et al., 2014) or the mode of recovery (1:2 to 1:10) (Iaia et al., 2017). Physiological stimuli provided by this type of training lead to high responses of neuromuscular and metabolic systems, with increased participation of aerobic function, depending on the number of sprints (Glaister, 2008) and a consequent improvement of maximal oxygen uptake (VO2max). Accordingly, during repeated sprint exercise, several complex metabolic processes are recruited in coordination with neural factors (Bishop et al., 2011). Repeated-sprint ability appears to benefit from a concurrent implementation approach, including different forms of training content. Thus, combining two or more divergent exercise modes such as endurance and resistance training may provide beneficial adaptations in skeletal muscles (Coffey et al., 2009).
Due to the importance of sprint ability for sports performance, several protocols have been developed manipulating the distance and the number of repetitions (Caprino et al., 2012; Castagna et al., 2007; Stojanovic et al., 2012). However, repeated-sprint protocols should be sport-specific, reflecting the common sprint distance and recovery periods of competition. In this sense, a sprint-stride profile analysis during a basketball game showed that 15 m shuttle runs are the upper-range distance covered at a high intensity (Spencer et al., 2005). Based on this information, a basketball-specific protocol was developed consisting of 10 shuttle run sprints of 15 m (15+15) interspersed with 30 seconds of passive recovery, which reflects recovery time recorded during the game (Castagna et al., 2007). This type of test requires high muscular demands due to mechanical requirements imposed by changes in directions. Both aerobic and anaerobic pathways are important to enhance the repeated sprint ability of team sport players, however, anaerobic glycolysis is activated within 2 – 3 –s of explosive actions, reflecting most common specific actions in basketball (Spencer et al., 2005). However, the official basketball court is 28 m long and 15 m wide, and the suggested average sprint length and duration were 7.38 ± 0.86 m (range, 5– 32 m) and 1.41 ± 0.16 s (1–8 s), respectively (mean bout speed, 19.12 ± 0.72 km/h) (Castagna et al., 2007). In this sense, the aforementioned distances used in different studies may be too long (Nikolaidis et al., 2016). It is reasonable to assume that basketball players are often engaged in sprint distances lesser than 15 m, thus, designing protocols using shorter distances may better deem the dynamics of the competitive environment. Based on this theoretical background, it seems necessary to examine the effects of using shorter sprint distances and more sprint repetitions, maintaining the total covered distance. Therefore, the present study aimed to examine the physical and physiological effects of a novel repeated sprint ability protocol (20×15 m RSA) and compared it with a traditional repeated sprint ability protocol (10×30 m RSA).
Methods
Participants
Twelve male elite Lithuanian basketball players (age 21.0 ± 2.0 y, body height 1.90 ± 0.07 cm, body mass 86.2 ± 5.8 kg, BMI 24.0 ± 1.73, standing reach 2.48 ± 0.10 m and training experience 12.0 ± 1.9 y with ~10 h of training per week) competing in the Lithuanian National Basketball Championship participated in this study. All the participants were healthy, without muscular, neurological and tendinous injuries and did not attend any other physical activity during the training program. All study participants were informed about the research procedures, requirements, benefits and risks and, their written consent was obtained before the study began. Additionally, players were informed that they were free to withdraw at any time of the study. The investigation was approved by the local Institutional Research Ethics Committee and conformed to the recommendations of the Declaration of Helsinki.
Design and Procedures
The familiarization procedures for testing were performed one week before each testing session (10×30 m RSA and 20×15 m RSA). Participants completed three bouts of 10 maximal sprints interspersed with 5 min of passive recovery between each bout. All participants performed two randomized separate testing sessions: 10×30 m RSA and 20×15 m RSA. Both sessions were performed under similar environment conditions (relative humidity ∼ 60%) and circumstances (from 11.00 to 12.30 h).
Both testing sessions started with a 20 min standard warm-up consisting of low-intensity running, dynamic stretching and running drills (e.g. sprints with and without changes of direction). In both tests, players started in a crouched position. During the first testing session, participants performed 3 bouts of 10x30 m sprints with a 5-min recovery interval between sets to assess maximal sprint performance. The second testing session comprised 3 bouts of 20x15 m sprints with a 5-min recovery interval between sets to assess maximal sprint performance. Each shuttle sprint was timed using a photocell system (Brower Timing System, Salt Lake City, UT, USA; the accuracy of 0.01 s) placed 0.5 m above the ground at the starting and the finish line with players starting 0.50 m behind the photocell beam.
Despite the different stimuli, both sessions comprised a total amount of work of 900 m distributed by three bouts of maximal sprints interspersed with 5 min of rest and the same exercise-to-rest ratio of 1:5 (Ruscello et al., 2013).
Repeated Sprint Ability Protocol: 10×30 m
The 10×30 m RSA comprised ten shuttle sprints of 30 (15+15) m with 180º change of direction with 30 s of passive recovery between sprints (Castagna et al., 2007). Participants were instructed to assume the ready position and after the starting signal sprinted in-line for 15 m, changed the direction at 180° and sprinted back to the finish line.
Repeated Sprint Ability Protocol 20×15 m
The 20×15 m RSA consisted of twenty 15-m shuttle sprints interspersed by 15 s of passive recovery (walking back to the starting line and waiting for the next sprint). Participants were instructed to assume the ready position and after the starting signal sprinted in-line for 15 m and back to the starting line. To avoid imbalances between limbs, participants were asked to alternate legs between sprints.
Variables
For each protocol, the following variables were calculated: maximum velocity (m/s), worst sprint (m/s), average speed (m/s), total sprint duration (time, s), fatigue index (%) and fatigue index (s). The fatigue Index was calculated to evaluate the rate of fatigue as a percent using the following formula: (100 × (TT/(BT × 10))−100), where TT corresponds to the total time and BT to the best time (Fitzsimons et al., 1993). Blood lactate samples (La) (mmol∙L−1) were taken from the participants’ earlobe three minutes after each exercise protocol (Arkray Lactate Pro LT-1710, Kyoto, Japan) (Hirvonen et al., 1987). The heart rate was measured using a Polar heart monitor (Polar Accurex Plus, Polar Electro, Woodbury, NY) during and after completion of each repeated sprint ability protocol.
Statistical Analysis
A descriptive analysis was performed using means and standard deviations. The effects of both RSA protocols were analysed using a specific spreadsheet for a post-only crossover (Hopkins, 2017). The effects were estimated in percent units through log-transformation and uncertainty in the estimate was expressed as 90% confidence limits. Smallest worthwhile differences were estimated from the standardized units multiplied by 0.2 and the probabilities were reported using the following scale: 25-75% possibly; 75-95% likely; 95-99% very likely; >99% most likely (Hopkins et al., 2009). Standardized (Cohen) mean differences, and respective 90% confidence limits (CL) were also computed as the magnitude of observed effects, and thresholds were 0.2, trivial; 0.6, small; 1.2, moderate; 2.0, large; and >2.0, very large (Hopkins et al., 2009).
Results
Table 1 and Figure 1 present, respectively, the practical inferences and standardized Cohen’s differences based on the comparison between the 10×30 m and 20×15 m RSA protocols. The 20×15 m RSA protocol presented higher values in the fatigue index (difference in means: %; ± 90% CL 67.6%; ±28.1%, most likely) and worst sprint results (8.1%; ±1.5%, most likely). Also, the best sprint and average speed presented a similar trend, but with a higher magnitude effect (13.0%; ±0.9%, most likely and 10.4%; ±0.9%, most likely, respectively). On the other hand, the 10×30 m protocol presented results with greater magnitude in total sprint (-9.4%; ±0.7%, most likely) and La (39.2%; ±12.8%, most likely) variables.
Figure 1
Standardized (Cohen) differences between both repeated sprint ability protocols. Error bars indicate uncertainty in the true mean changes with 90% confidence intervals. Abbreviations: La = Blood lactate concentration.
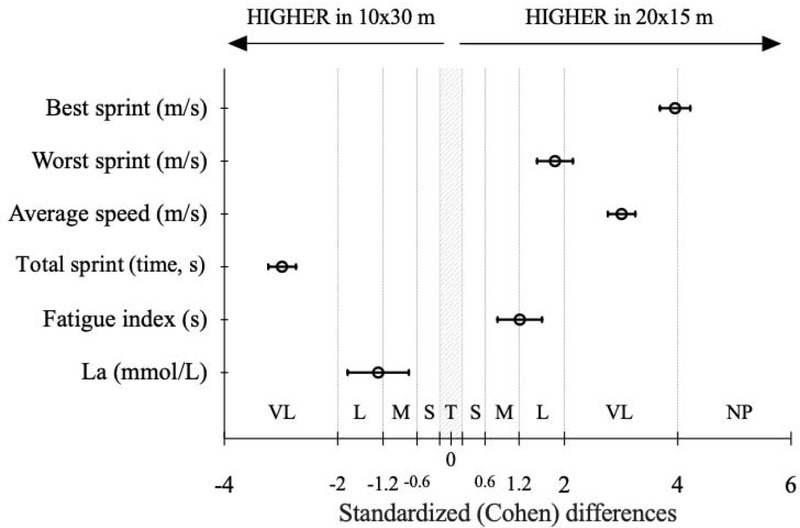
Table 1
Inferences for the 10×30 m vs 20×15 m performance measures’ comparisons.
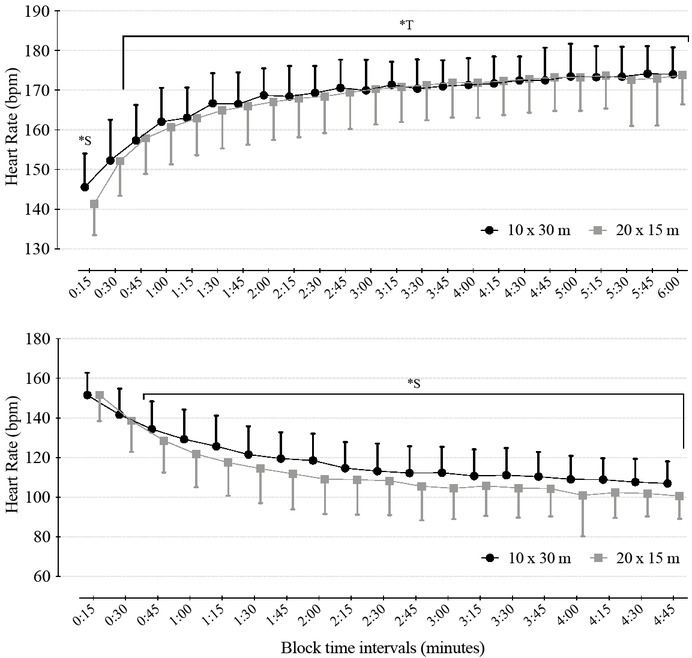
Figure 2 presents heart rate differences between both repeated sprint ability protocols during exercise and recovery. The heart rate results during the exercise showed trivial differences between the two protocols. Although with small differences, the 20×15 protocol showed lower results during recovery.
Discussion
The study aimed to examine the physical and physiological demands of a novel repeated sprint ability protocol (20×15 m) and compare it with the traditional repeated sprint ability protocol (10×30 m). The results indicate that the 20×15 m protocol seems more suitable for the specificity of basketball physical and physiological demands.
Despite the unpredictability of behavioral patterns in team-sports, the improvements in technology allowed researchers to report the mean distance and duration of sprints during matches and establish RSA as a key requirement for high-level performance (Girard et al., 2011; Sampaio et al., 2015; Spencer et al., 2005). The present study showed a large increase in the fatigue index in the 20×15 m RSA protocol and a very large decrease in La when compared to the 10×30 m protocol. The repeated-sprint activity patterns of different team-sports as well as the different potential biomechanical and physiological stimuli seem to be affected by the exercise mode, duration of sprints, intensity, quantity, and distribution of work bouts (Gaitanos et al., 1993). Considering the players’ displacement patterns in basketball, reflected by changes of direction, accelerations, decelerations, and high-intensity short duration bouts between 2 and 6 s, the 20×15 m RSA protocol seems to reflect the physiological demands of the game. Thus, the greater increase in the fatigue index showed by the 20×15 m RSA protocol seems to reflect the influence of the recovery periods during the game, emphasizing the similarities with competition.
Time-motion analysis describes basketball as a team sport based on intermittent high-intensity activity interspersed with periods of low intensity and/or recovery (Attene et al., 2014; Sampaio et al., 2014). Previous reports have shown that during competitive basketball games, players reach a blood lactate concentration between 3.2 and 6.6 mmol∙L−1 (Scanlan et al., 2016). In the present study, the 10×30 m RSA protocol showed much higher values of La with a response of 13.02 mmol∙L−1 when compared with the 20×15 m RSA protocol (8.53 mmol∙L−1). RSA tests should be designed according to sports-specific movement patterns, representing a competitive performance environment (Keir et al., 2013). However, the La concentration reached in the 10×30 m RSA protocol is too high when compared to basketball game data, and in this sense, may not be adequate to reflect game demands. In addition, the specific conditions of RSA protocols with several bouts of repeated sprints only occur occasionally during a game (Schimpchen et al., 2016). Also, shorter and consecutive accelerations/decelerations are more frequent in-game specific situations (Schimpchen et al., 2016). Accordingly, previous works that used RSA protocols ranged the distance per sprint between 15 to 35 m, however, the longest distances exceed the basketball court dimensions, which questions the suitability of such protocols (Balciunas et al., 2006; Nikolaidis et al., 2016). As previously mentioned, the reported La results are usually higher in RSA tests than the mean levels in competition (Castagna et al., 2008). In this sense, the present results suggest that an RSA protocol with a higher number of sprints and shorter distances may be more physiologically representative, due to the peak lactate observed during the games.
Albeit higher concentrations of La were registered in the 10×30 m RSA protocol, the 20×15 m protocol presented higher values in the fatigue index. In this sense, the 20×15 m RSA protocol may be more representative of basketball-specific requirements and induce functional adaptation, particularly RSA capacity due to the similar specific distances as well as the similar La responses. On the other hand, the 10×30 m RSA protocol can be implemented to develop the ability to perform repeated sprints as well as muscle power and aerobic capacity, showing some weaknesses as an evaluation protocol due the different characteristics of existing RSA protocols that do not represent the specificity of a basketball game. The 20×15 m RSA protocol showed most likely improved results in the fatigue index. This evidence highlights the connection between the recovery duration and sprint performance (Calleja-Gonzalez et al., 2018). Previous reports have shown that high-level performance is linked to the ability to recover from previous sprints as well as the time spent recovering (Attene et al., 2014; Billaut and Basset, 2007). Therefore, this protocol seems to offer some transferability of players’ behaviours from training to competition, due to the unpredictability of competition.
Heart rate responses during exercise have been widely examined in several studies (Atli et al., 2013; Delextrat and Kraiem, 2013). The heart rate responses during exercise between both protocols were very similar, only showing small differences during the first 30 s, which may indicate a similar stimulus between protocols. Previous reports have shown that HR variation is sensible to the mode and intensity of exercise (Schneider et al., 2018). After repeated-sprint exercises, the elevation of adrenergic factors as well as local metabolites during recovery may affect responses (Buchheit et al., 2007). The heart rate responses during recovery presented small differences between protocols with the lower HR values reached in the 20×15 m RSA protocol. In this sense, and comparing both protocols, the higher results observed in the 10×30 m RSA protocol may be linked with a greater anaerobic contribution (Del Rosso et al., 2017). Thus, beyond the absence of transferability of the 10×30 m RSA protocol, and the higher La responses, the slower HR recovery when compared to the 20×15 m RSA protocol may show greater sensibility of the latter to evaluate and measure RSA responses.
Conclusions
The present study shows that despite both protocols may be used to improve RSA and aerobic capacity, the 20×15 m RSA protocol seems to be more representative and specific to a basketball game due to the similar distances as well as La responses. In this sense, coaches should be aware that RSA training during the in-season may be an adequate stimulus to improve high-intensity runs and muscle power in elite basketball players.