Introduction
In any endurance-based task, athletes are encouraged to give persistent effort for an extended period of time. This is commonly thought of in the context of a runner, cyclist or rower completing a long-distance event. However, during a high-repetition resistance training set, which is focused on muscular endurance, an athlete must repeat a large number of contractions against a load over an extended period of time. During this task, the athlete must provide prolonged effort and tolerate both metabolic, neuromuscular, and peripheral fatigue to successfully complete the set (Parraga-Montilla et al., 2018; Zajac et al., 2015). A decrease in focus or effort could result in failure to complete the set and missed performance goals. To better describe this aspect of performance, Duckworth et al. (2007) suggested grit as a personality trait capable of reflecting both perseverance of effort and consistency of interest in achieving a specified goal. In other words, it is postulated that a “gritty” individual may perform above normal expectations or, in the context of resistance training, perform more repetitions in a resistance training set. Importantly, repetitions performed at a given intensity are highly individual (Hoeger Werner et al., 1990; Shimano et al., 2006), but it is largely unknown why.
Grit, which is measured via a quantitative scale, has been related to a variety of outcome variables in academic and military domains (Duckworth et al., 2007, 2011; Eskreis-Winkler et al., 2014; Kelly et al., 2014, Robertson-Kraft and Duckworth, 2014; Salles et al., 2014, 2017). In exercise and sport-related research, the grit construct has been related to outcomes such as readiness to change, program adherence, and sport engagement (Larkin et al., 2016, Martin et al., 2015; Reed, 2014; Reed et al., 2012). Furthermore, grit has been suggested as a personality trait that may facilitate elite sport performance and hold value in talent identification (MacNamara and Collins, 2015), and data have suggested a relationship between personality and muscular strength (Tolea et al., 2012, Tucker, 1983). Despite the evidence presented in these publications, however, a recent meta-analysis of the grit literature takes issue with the grit construct as a whole and questions the current tools of measurement (Credé et al., 2016). Importantly, because grit is a trait, rather than a state, scores should remain stable over time. Thus, an examination of the relationship between grit and acute performance requiring some degree of perseverance, such as muscular endurance, is warranted. To our knowledge, no study has yet examined this relationship and how grit may impact acute muscular endurance performance.
Therefore, the purpose of this study was to examine whether grit was related to back squat muscular endurance performance. If grit does relate to repetitions performed, then it could be used to aid in prescribing the number of repetitions at a specific percentage of onerepetition maximum (1RM) since the number of repetitions performed at a specific percentage of 1RM is highly individual (Cooke et al., 2019).
Methods
Participants
Fifty-eight resistance-trained males (N = 43; age = 23 ± 3 yrs; body height = 175.07 ± 7.27 cm; body mass = 86.67 ± 13.93 kg; training age = 6 ± 3 yrs; 1RM = 163.5 ± 39.5 kg) and females (N = 15; age = 21 ± 2 yrs; body height = 165.25 ± 8.28 cm; body mass = 63.34 ± 9.6 kg; training age = 4 ± 2 yrs; 1RM = 81.5 ± 12.5 kg) volunteered for participation. Further details of the participants can be found elsewhere (Haischer et al., 2019). For inclusion, participants must have been back squatting ≥1 x/wk, on average, for the previous year. Additionally, individuals needed to meet the strength requirements for the free-weight barbell back squat (males: 1RM ≥ 1.5 x body mass; females 1RM ≥ body mass). Individuals who had any contraindications to exercise (e.g. cardiovascular disease, serious musculoskeletal disorders, etc.) were excluded from participation. The University’s Institutional Review Board approved this investigation and all participants provided written informed consent prior to participation.
Measures
Short Grit Scale (GRIT-S). The grit of each participant was assessed via the GRIT-S (Duckworth and Quinn, 2009), rather than the 12-item Grit Scale (GRIT-O) (Duckworth et al., 2007), as it has been found to demonstrate a superior factor structure than the GRIT-O in an athletic population (Meyer et al., 2017). The GRIT-S evaluates an individual’s perseverance and passion for long-term goals through eight different items. Likert scale responses to each question range from ‘not like me at all’ to ‘very much like me’, and correspond to scores from one to five. Scores from each question are then added and divided by eight to determine the final score, which also ranges from one to five. A higher final score is purported to be indicative of a ‘grittier’ individual.
Set to Failure at 70% of 1RM. Participants performed a back squat set with a load equal to 70% of 1RM until volitional failure or when they failed on a repetition. The number of repetitions that the participant completed successfully was used as the dependent variable for analysis.
Design and Procedures
The aim of this research was to examine the relationship between the Short Grit Scale (GRIT-S) and repetition performance in welltrained lifters. Participants reported to the lab on one day for data collection. Testing was conducted between 8 A.M. and 8 P.M. at a time that was convenient to the participants and in agreement with their usual training habits. Participants were required to refrain from exercise for at least 48 hours prior to testing. To begin, anthropometrics were measured prior to completion of a physical activity and health history questionnaire. Participants then completed the GRIT-S and were led through back squat 1RM testing. The 1RM testing was conducted in accordance with previously validated procedures and full details can be seen elsewhere (Zourdos et al., 2016). After 1RM testing, a mandatory 10-min rest interval was implemented prior to completion of two singlerepetition back squat sets at 30, 40, 50, 60, 70, 80, and 90% of 1RM, performed as part of a larger study, with five minutes of rest enforced between each repetition. Finally, participants rested for 10 additional minutes prior to squatting to volitional failure with 70% of 1RM. Squat repetitions were performed in accordance with the regulations of United States of America Powerlifting, including a minimum depth of the hip crease passing below the top of the knee (USA Powerlifting, 2019). Results from the GRIT-S were used as the independent variable, with the total number of repetitions performed during the 70%1RM set used as the dependent variable.
Statistical Analyses
Data are presented as means and standard deviations. Further, prior to evaluating performance relationships, a Cronbach’s alpha coefficient of reliability was established on the GRIT-S as previously described (Cortina, 1993). Additionally, results of a Shapiro-Wilk test revealed that the number of repetitions performed was not normally distributed for the combined sample and for females only. Thus, Spearman rho correlations were used to determine relationships between the Grit-S scores and repetitions performed at 70% of 1RM for the combined sample and females, while Pearson’s product moment correlations were used for the independent sample of male participants. To increase robustness of the analyses, bootstrapping with 1000 replicate samples was implemented (Field, 2017). Partial correlation analysis was also performed to investigate the association between Grit-S scores and repetitions performed, controlling for sex as a covariate. All statistical analyses were performed using SPSS version 25.0 (IBM Corp.; Armonk, NY, USA) and the level of significance was set at p ≤ 0.05.
Results
The GRIT-S was judged to be acceptably reliable in this population of trained individuals (Cronbach’s α = 0.76) based on the number of items in the scale (Cortina, 1993). However, correlation analysis revealed no relationship between GRIT-S scores (3.78 ± 0.52) and repetitions performed (14 ± 4) in a combined cohort of all 58 individuals, males only (GRIT-S = 3.75 ± 0.54; repetitions = 14 ± 4), females only (GRIT-S = 3.87 ± 0.47; repetitions = 15 ± 5), or when accounting for sex as a covariate. Specific correlation values and confidence intervals are displayed in Table 1.
Table 1
Bootstrapped Bivariate Correlations Between Grit-S Scores and Back Squat Repetitions Performed at 70% of 1RM.
Discussion
To our knowledge this is the first study to examine the relationship between grit and a muscular endurance performance task. Importantly, the GRIT-S failed to correlate to the number of repetitions performed at 70% of 1RM in the back squat. Since one component of grit is perseverance of effort, it is somewhat surprising that individuals that scored higher on the GRIT-S did not perform more repetitions on average, than participants that received lower scores. One possible explanation of this finding is that scores on the GRIT-S are, in fact, related to the perception of effort during muscular endurance tasks, rather than performance itself. Although it was not explored in this study, perhaps individuals who perceive themselves as more “gritty”, also perceive themselves to be putting forth more effort during the task as a reflection of their passion and perseverance. Interestingly, the lack of association was not limited to one sex, as both males and females independently failed to show a relationship. Even though the female cohort alone exhibited the strongest association between GRIT-S scores and repetitions performed it is difficult to suggest that the GRIT-S may predict reps performed since this relationship was not statistically significant and due to the wide confidence intervals (Table 1). In fact, further scrutiny of the data unraveled that the five “best” performers (i.e. the five individuals who performed the most repetitions) tended to have lower GRIT-S scores than the five “worst” performers (“Best” = 3.878 ± 0.578 vs. “Worst” = 4.152 ± 0.742) (Table 2). Notably, one of the “worst” performers received the maximum GRITS score of 5. Taken together, these data seem to validate previous concerns regarding the merit of the construct of grit. A recent meta-analysis by Credé and colleagues (2016) concluded that current measures of grit are not especially predictive of performance success, and that the construct is not reliably distinguishable from conscientiousness. Meyer et al. (2017) also questioned the measurement model, by highlighting the potential for social desirability bias to affect grit score outcomes. In other words, since grit is viewed as a desirable trait, individuals tend to answer the items in a manner that results in a higher grit score, regardless of what their “true” response should be. Indeed, the range of grit scores reported in this sample is even smaller than what was reported by Meyer’s group (Current study = 2.75-5.00 vs. Meyer et al. = 2.13-5.00) (Meyer et al., 2017). Further illustration of the score distribution in the current study is provided as a boxplot in Figure 1.
Figure 1
Boxplot of GRIT-S Scores
The observed distribution of GRIT-S scores is mostly contained in the upper half of the possible range of scores (minimum score = 2.75), signifying that all of the participants in this study perceived themselves to have at least a moderate level of grit.
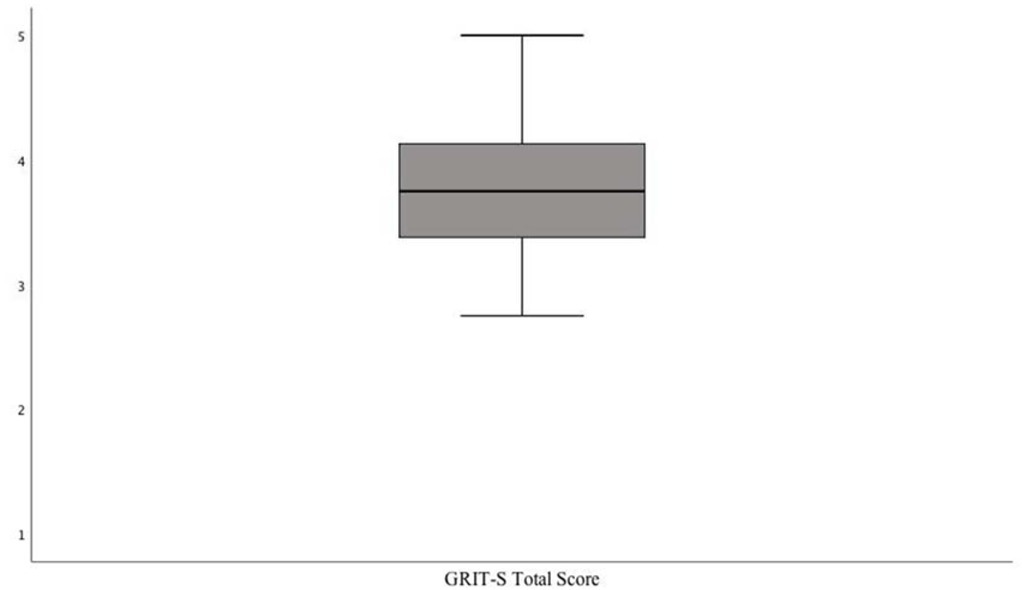
Table 2
Five Highest and Lowest Repetitions Performed at 70% of 1RM and Associated GRIT-S Scores
Importantly, various limitations do exist. First, the acute design of the study prevented strict control of nutritional and hydration status of the participants. Nevertheless, participants were encouraged to arrive well-fed and were allowed to eat and drink throughout testing. A second possible limitation of this study is that data were only collected on one day, and thus repetitions performed could not be compared from one day to the next. Grit has been explained as a trait that facilitates achievement of long-term goals (Duckworth et al., 2007), so it may not be indicative of acute performance. However, data have linked grit with both deliberate practice (Duckworth et al., 2011) and sport engagement (Martin et al., 2015), and both deliberate practice and sport engagement have been associated with acute sport performance (Larkin et al., 2016). Furthermore, since grit is proposed as a character trait, scores on GRIT-S do not necessarily warrant monitoring over time as they should remain relatively stable. Thus, one day was deemed appropriate to determine if the trait of grit was indeed related to squat repetition performance. There are also other factors that were not examined (i.e. anthropometrics, bar position, stance width, etc.) that may impact squat repetition performance. Based upon the present results, those variables are likely more prominent factors affecting repetition performance than grit. Lastly, it is possible that a subject may have previously trained with primarily high or low repetitions, which could have influenced the number of repetitions performed.
Previous literature has described grit as a personality trait that may have elite performance implications (Duckworth et al., 2007; MacNamara and Collins, 2015). While this may be true over the long-term, the present data failed to show a relationship between grit, as measured by the GRIT-S, and an acute muscular endurance task. The data presented in this study are beneficial as previous authors have questioned grit as a construct (Credé et al., 2016; Meyer et al., 2017). Furthermore, we have demonstrated for the first time the absence of benefit of grit in a muscular endurance task. Importantly, our results indicate a lack of usefulness for grit in well-trained males and females. Consequently, though a larger study would be more conclusive, it seems that the present results can likely be extrapolated to athletes of both sexes who participate in resistance training. While the scale does not seem to be useful in predicting strength endurance performance, it remains to be seen whether acute performance on other endurance-based tasks (i.e. cycling, running) relates to grit, or whether the GRIT-S can predict performance improvements over time. Even so, the very limited range of GRIT-S scores in this investigation continues to highlight the potential for social desirability bias that has been noted previously (Meyer et al., 2017). This, combined with the absence of a relationship to repetitions performed at a standardized relative intensity in the back squat, strongly suggests that the GRIT-S has limited value in the context of muscular endurance performance.