Introduction
An important time in human physical maturation is the age of the fastest growth in height, termed Peak Height Velocity (PHV). Although PHV varies among individuals, it is estimated to occur around the age of 12.1 years for girls and 13.7 years for boys (Granados et al., 2015). Body mass increases significantly around PHV (Malina, 2004, Malina and Bouchard, 1991), which results in rapid increases in muscle force and consequently a greater mechanical load on tendons (Lindgren, 1978, Lefevre et al., 1990). Further, there is significant evidence that our ability to control movements improves from childhood to early adulthood (Deutsch and Newell, 2001, Fox et al., 2014). Sport participation during adolescence also can induce tendon adaptations (O'Brien et al., 2010, Waugh et al., 2012, Magnusson et al., 2016), but the interaction of physical maturation and sports participation on motor control the tendon properties remains poorly understood. It is critical to understand this interaction to minimize the risk of injuries and maximize athletic development in talented adolescents. Here, we characterized the longitudinal changes in motor control and the properties of the Achilles tendon in adolescent athletes and non-athletes during a time period around PHV.
During adolescence, the time around PHV is critical for the development of the neuromuscular system. The immature neuromuscular system in adolescent children has been shown to be responsible for reductions in strength and power (Dotan et al., 2012). Children, also exhibit a reduced ability to control the motor output (Deutsch and Newell, 2001, Deutsch and Newell, 2002, Deutsch and Newell, 2006, Takahashi et al., 2003, Yan et al., 2000, Fox et al., 2014). For example, Deutsch and Newell (2001) have shown that children exhibit greater variability in force from 5-35% MVC. Recent evidence from our lab expands these findings to showing that endpoint control is also impaired in children. However, the literature is limited in what happens to motor control around the age of PHV, when children go through the biggest mechanical transformation in life.
The mechanical properties of Achilles tendon change dramatically at the age of PHV. It is well known that body mass and muscle strength increase rapidly during the adolescent growth spurt, inducing a greater mechanical load on the Achilles tendon (Lindgren, 1978, Lefevre et al., 1990). Consequently, collagen fibril diameter, density and intra-fibrillary cross-linking can be affected and change material properties of the tendon (Radnor et al., 2018). These changes have been associated with increased stiffness (k) and Young’s modulus (E) (Neugebauer and Hawkins, 2012, O'Brien et al., 2010, Waugh et al., 2012), whereas peak strain (εpeak) remains unchanged (Mogi et al., 2018). There is evidence, however, that k or E do not change significantly over a 6-month period around the PHV (Neugebauer and Hawkins, 2012). Given that physical changes occur for about 6-7 years around PHV (Malina, 2004), the current knowledge about the effects of maturation on the mechanical properties of the Achilles tendon remains limited to very short-time studies.
Sports participation and training also can influence the mechanical properties of the Achilles tendon in adolescence (Magnusson et al., 2016, Waugh et al., 2012, O'Brien et al., 2010). Although sports participation in children is more intense than in adults (PAC, 2020), its effect on the mechanical properties of the Achilles tendon during PHV remains unknown. Support to the idea that sports participation could interact with maturation and influence the mechanical and morphological (resting length, cross-sectional area) properties comes from studies on sports training. For example, in pre-pubertal children (Waugh et al., 2014) and adolescents (Mersmann et al., 2017b), the Achilles tendon stiffness increased significantly following 10 weeks of resistance training suggesting changes in underlying microstructure and collagen arrangement (Waugh et al., 2014). There is also evidence for Achilles and patellar tendon hypertrophy with participation in certain sports (Cassel et al., 2016). Recent findings, however, suggest that Achilles tendon stiffness was not different for preadolescent athletes and non-athletes following plyometric exercises (Pentidis et al., 2019). Thus, the effect of sports participation on the mechanical properties of the Achilles tendon and motor control at PHV remains unresolved.
The current literature on the interactive effect of maturation and sports participation, therefore, remains limited primarily to cross-sectional studies. Here, we address this important research question with a longitudinal study around the age of PHV for adolescent athletes and non-athletes. Our purpose was to characterize the effects of maturation and sports participation on motor control and the mechanical and morphological properties of the Achilles tendon around the age of PHV. We tested the hypothesis that sport participation in adolescence will induce different adaptive patterns on the mechanical and morphological properties of the Achilles tendon with maturity and consequently motor control.
Methods
Ethical approval
All students and parents provided informed consent. The Aristotle University of Thessaloniki Local Ethics Research Committee approved the study protocol and the research was conducted in accordance with the guidelines of the Declaration of Helsinki.
Participants
Fifty-seven pre pubertal children volunteered for the study (30 boys: 11.9±1.3 years, 46.1±8.2 kg, and 155.1±8.5 cm; 27 girls: 11.1±1.3 years, 39.3±7.9 kg, and 148.8±8.3 cm). All participants were recruited from public schools in Greece and were healthy, without any disability or leg injury. Twenty-two athletes (13.1 ± 1.1 years) and 19 non-athletes (12.8 ± 1.1 years) participated in the study. The athlete sample was derived from track and field participation (runners, sprinters, long jumpers), while the non-athlete sample derived from children that reported less than 3 hours of sport activity per week in school and no further sports training.
Experimental design
To estimate the age of PHV, we performed the same measurements under similar conditions for each participant every 6 months. The recommended time interval is <1 year (Mirwald et al., 2002), thus our measurements are within the suggested resolution. From the 57 adolescent participants, 41 of them (20 boys and 21 girls) were close to the age of PHV and were included in this study. Twenty-two of them were characterized as “adolescent athletes” (13.1 ± 1.1 years) and 19 as “adolescent non-athletes” (12.8 ± 1.1 years). Thus, within our sample, we have adolescents anywhere from 18 months before PHV to 12 months after PHV. Specifically, we classified the maturation progress into the following 6 stages: 18 months pre-PHV (N=24), 12 months pre-PHV (N=33), 6 months pre-PHV (N=41), PHV (N=41), 6 months post-PHV (N=17), and 12 months post-PHV (N=8). The number in parenthesis reflects the number of participants within each maturation stage.
Measurements
Anthropometric data
For each visit every six months, we recorded the participant’s age, height, and weight. These measurements were necessary to estimate the PHV as recommended by (Mirwald et al., 2002). The age closer to the predicted age of PHV was defined as the age of peak height velocity (APHV) in each participant. In order to determine the reliability of this definition, the intraclass correlation coefficient (ICC) between the two ages (predicted and APHV) was calculated. The ICC rate for boys was 0.97, (p <.001) and for girls 0.77, (p <.001). The acceptable limit of the coefficient >0.7 (Coffman et al., 2008), indicated that the predicted age of PHV was similar with APHV defined in the present study.
Plantarflexion contractions
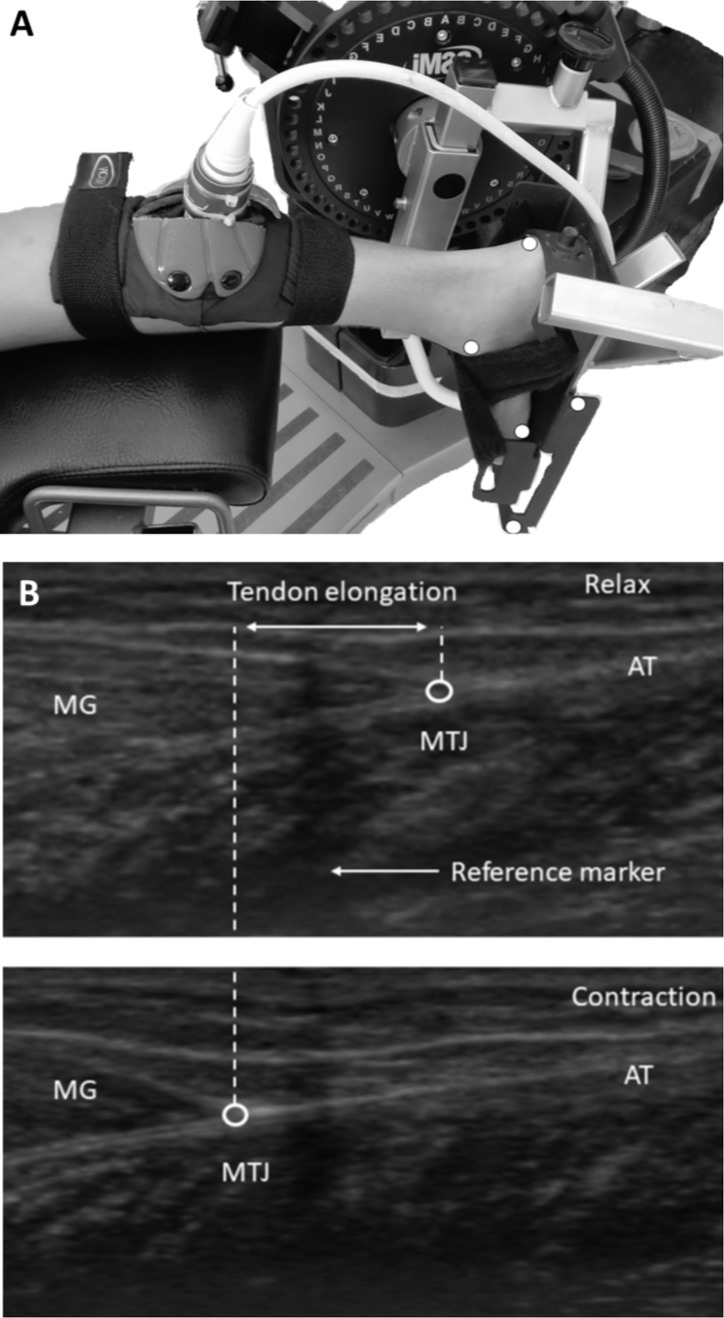
To assess the strength of each participant at every 6-month visit, we asked the participants to perform ramp isometric plantarflexion contractions (IPF) in the prone position on a dynamometer bench (Cybex Humac Norm, CSMI, MA, USA; Figure 1A). The right foot was positioned perpendicular to the tibia (knee fully extended) and placed in the dynamometer’s footplate with the right ankle in the neutral position (Muramatsu et al., 2001, Maganaris, 2002, Muraoka et al., 2004, Kubo et al., 2014). The foot was tightly secured with straps to the footplate and the hips were tightly strapped to the seat. The rotation axis of the ankle joint was carefully aligned to be parallel to the axis of the lever arm of the dynamometer and passing through the midpoint of the line connecting both malleoli (De Monte et al., 2006). Prior to testing, each participant performed a warming-up exercise (Maganaris and Paul, 1999, Rigby et al., 1959, Viidik et al., 1982, Schatzmann et al., 1998). Upon the instructor's request, participants performed two 10-s isometric plantar flexions increasing from 0% to 100% of the maximum torque at 20% of maximum torque every 2 s and holding maximally for 5 s (30-s inter-trial rest). Torque values were obtained from the best effort in which the isometric plantar flexion ramp was properly achieved and torque-time curves were linear in the ramp period without energy loss in the test.
Motor control
Using the torque values from the isometric trial of plantar flexion ramp (see above) we quantified the force fluctuations around the force trajectory. We achieved this by removing the slow increase in force (tracking the ramp) by using a high-pass filter of the whole signal (>0.1 Hz). We then quantified the coefficient of variation (CV) of force (standard deviation of force/mean force x 100). The CV of force is a more appropriate comparison between athletes and non-athletes and across maturity because different absolute force levels were exerted on tracking the ramp because of their strength.
Achilles tendon mechanical properties
To quantify the displacement of the distal myotendinous junction (MTJ) of the medial gastrocnemius (MG) during ramped IPF, we used a B-mode ultrasonography (SSD-3500, Aloka, Tokyo, Japan) with a 60-mm electronic linear-array probe (7.5Hz wave frequency; Figure 1B). The probe was placed longitudinally at the position specified by a marker attached on the skin surface (Figure 1A). An echo-absorptive marker was attached to monitor possible motion of the probe on the skin during the measurement. Ultrasound images were digitally recorded at a sampling frequency of 25Hz. A Max TRAQ software (Max Traq Lite version 2.09, Innovision Systems, Inc. Columbiaville, Michigan. U.S.A) was used to digitize the spatial location of the MTJ in order to generate MTJ position-time data from the ultrasound video. AcqKnowledge Acquisition & Analysis Software (BIOPAC Systems, Inc. , USA) was used to synchronize the torque signal and ultrasound imaging data. Gastrocnemius myotendinous junction (MTJ) displacement was assumed to represent the change in the length of the AT (Maganaris and Paul, 1999, Muramatsu et al., 2001, Dick et al., 2016).
The effect of unavoidable joint angular rotation on the displacement of MTJ during the ramp contractions was taken into consideration by capturing (high-speed digital video, JVC 9800, frame rate = 120 Hz) with a high-speed shutter to record plantar flexion motion (Magnusson et al., 2001b, Arampatzis et al., 2008). Five reflectors (2.5-mm radius) were placed on the 5th metatarsal, lateral malleolus and lower extremity of the heel and two markers were placed on the foot plate (Figure 1A). Despite foot stabilization, displacement of the ankle joint was recorded during contraction, resulting in loss of alignment with the dynamometer rotation axis. To accurately calculate the angle of rotation in two dimensions, the position points of the reflectors were recorded during the ramp isometric plantar flexion and coordinate data from high-speed camera were down-sampled to match the ultrasound sampling frequency. The additional MTJ displacement was subtracted from recorded elongation (ΔL) to compensate for the influence of ankle joint rotation (Arampatzis et al., 2008, Magnusson et al., 2001a). The perpendicular distance from the center of rotation to the line of AT action was defined as AT moment arm (MA), which was calculated with the excursion method (Fath et al., 2010, Ito et al., 2000). Without changing the participant’s position or the position of the ultrasound probe, passive AT behavior assessment was performed with the dynamometer rotating passively between 20o dorsiflexion and 20o plantarflexion at a speed of 5o/s. The first derivative of the polynomial for angle 0o was calculated to find the slope of the curve which represents the moment arm (Fath et al., 2010). Previous studies reported similar AT moment arm estimations of tendon excursion method between rest and MVC over any given foot rotation step (Maganaris, 2000, Maganaris et al., 2000). The tendon’s force was calculated by the equation: F = M / d where M is the plantarflexion moment and d the AT MA length.
In this study, the force for isometric plantar flexion was calculated at angle 0ο. The force resulting from this calculation represents the total force of all the ankle muscles transferred through the AT. Stiffness (N / mm) is defined as the slope of the linear portion of force (F)–elongation (ΔL) curve ranged from 60% to 90% of the maximum force were selected to be close to the linear portion of the force-elongation curve (Waugh et al., 2012). A 1st order polynomial was applied where the slope (R2=0.9) of the linear region of the curve F-ΔL was equal to the k. Measurement of AT resting length (RL) was performed by sagittal imaging where the tendon boundaries were defined from AT insertion on the calcaneal tuberosity to the MTJ of gastrocnemius medialis (GM). To measure CSAAT, a transverse section was visualized using ultrasound (Maganaris, 2002). A special gel patch (gel pad Aquaflex, 2x9 cm Parker Laboratories, Inc., Fairfield, NJ USA) was used to enhance acoustic conductivity and obtain clearer images where CSAAT is thinner and receives the greatest pressure (Voigt et al., 1995). The minimum CSAAT was the one accepted for the measurement. This ultrasonography technique is widely used a measurement of cross-sectional area of the AT (Waugh et al., 2012, Kubo et al., 2014, Mogi et al., 2018, Mogi, 2020). The reliability of measurements of CSAAT was investigated in a pilot study, 10 participants aged 9.5–14.5 performed the same test on 2 different days by two experienced observers. There were no significant differences between the test and retest value of CSAAT. The CV was 2.5 ± 1.3% and the RMSE was, 2.2 mm2, a CV of <5% is deemed acceptable (Campbell et al., 2007).
Stress (σ), determined as the force per unit area, was calculated using the minimum recorded CSAAT from each participant according to the equation: σ = F / A where F was the AT force (N) and A was the minimum CSAAT (mm2). Tendon strain (ε) was defined as tendon’s elongation normalized to its resting length according to the following equation: ε = (ΔL / L0) ·100% where Lo and ΔL represent the resting length and elongation of the Achilles tendon, respectively. The E was calculated as the slope of the linear portion of stress (σ) – strain (ε) curve between 60% and 90% MVC and this was extrapolated to zero stress to yield the tendon resting length according to equation: E = dσ / dε.
Analog signals from the dynamometer were amplified and synchronized with data from the ultrasound system using a DA 100 B amplifier (Biopac Systems. Inc., Goleta, CA, common mode rejection ratio > 90 db, bandwidth = 0.05 – 500 Hz). Torque data were recorded by the dynamometer at a sampling frequency of 100 Hz.
Statistical analyses
The statistical analysis was performed in SPSS (IBM Corp., Version 25.0, Armonk, New York, USA). Normal distribution of the data was tested using the Kolmogorov–Smirnov test. The independent variables for this study were the maturation (6 stages) and sport participation (athletes vs. non-athletes), whereas the dependent variables included: body mass, CV of torque, AT cross sectional area (CSAAT), AT resting length (RL), peak force (Fpeak), peak force normalized to body mass (Frel), stiffness (k), stiffness normalized to Frel (kFM), Young’s modulus (E), Young’s modulus normalized to Frel (EFM), peak strain (εpeak) and peak stress (σpeak).
We performed a repeated measure analysis of variance (RM ANOVA) to determine if sport participation interacted with maturity in the last 6 months (6 months pre-PHV and PHV) to affect the dependent variables. We used a linear mixed models (LMM) analysis to examine if athletes and non-athletes changed the dependent variables differently across the 6 stages of maturity. Additionally, LMM was used to compare CV of torque, k, E and σpeak as function of Fpeak, body mass and maturation as independent variables. The estimation method of -2 Restricted Log Likelihood (-2RLL) was used as the main criterion for comparison with other models and according to the best fit of the model. Additionally, -2RLL was more accurate than Full Maximum Likelihood as the number of participants (N=41) is small (Twisk, 2006, Singer, 2003). Pairwise comparisons between levels of selected main effects were conducted using Bonferroni confidence interval adjustment to determine the mean differences between athletes and non-athletes. Data are reported as mean ± SD. Statistical significance was considered at a p value < 0.05.
Results
Changes close to PHV
We compared the body mass, CV of torque, and mechanical and morphological properties of the Achilles tendon for athletes and non-athletes at two maturity stages (6 months before PHV and PHV). We chose this comparison because we had data from all participants at these two stages (N=41; Table 1) and the only available longitudinal study compared adolescents 6 months apart around the age of PHV (Neugebauer and Hawkins, 2012).
Table 1
Mean (±SD) values 6 months before PHV and PHV (combined data). BM: body mass (kg), Fpeak: peak force (N), Frel: peak force normalized to body mass (N/kg), RL: resting length, CSA ΑΤ: minimum cross-sectional area (mm2), k: stiffness (N/mm), kFM: stiffness normalized to Frel (kg/mm), E: Young’s modulus (MPa), EFM: Young’s modulus normalized to Frel (kg/mm2), εpeak: peak strain (%), σpeak: peak stress (MPa) of Achilles tendon. (combined data; N=41)
The CV of torque was not significantly different for the two maturity stages or sport participation groups (p>0.2). Similarly, the group x sport participation interaction was not significant (p>0.2). There was a significant main effect for maturation stage (6 months pre vs. PHV) showing that body mass, CSAAT, RL, Fpeak, Frel, E, and σpeak increased at the 6 months before PHV (all p<0.01; Table 1). The main effect for sport participation (athletes vs. non-athletes) and the maturation stage x sport participation interaction were not significant for any of the dependent variables (p>0.2). Thus, there is a change in body mass and various mechanical and morphological properties in the 6 months prior to PHV, but these changes are not significantly different for athletes and non-athletes.
Longitudinal changes before and after PHV
Given that we had a different number of observations for each maturation stage, we used linear mixed models (LMM) to examine the interactive effect of maturation and sport participation. We examined a maturation period of a 30-month span around PHV (pre 18 months, pre 12 months, pre 6 months, PHV, post 6 months, post 12 months).
CV of torque
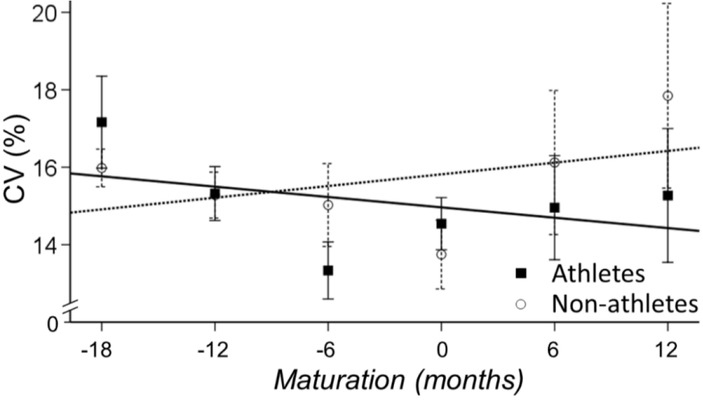
The main effect for maturation (time) was significant (p<0.01) indicating that the CV of torque decreased with maturation (b=-1, 24% CI - 2.36 to -0.13, p=0.029; Figure 2). The CV of torque was not significantly different for athletes and non-athletes (b=0.48 [-1.23-2.20], p=0.577) and the interaction between maturation and sports participation was not significant, (b=0.508 [-1.102.12], p=0.535).
Figure 2
CV of torque for athletes (solid line) and non-athletes (dashed line). Maturation changed the CV of torque similarly for the two groups.
Body mass
The main effect for sport participation (athletes vs. non-athletes) and maturation (time) were significant (p<0.01) indicating that athletes had more body mass than non-athletes (b=5 [1.618.37], p=0.004) and that body mass increased with maturation (Table 2). Most importantly, the interaction between maturation and sports participation was significant, indicating that body mass increased more in athletes than non-athletes (b=2.06 [0.04-4.07], p=0.046; Figure 3A). Comparing the maturation slope for athletes and non-athletes for body mass in Figure 3A, it appears that the differences initiated 6 months before PHV. These differences continued to occur until 12 months post PHV because body mass kept increasing in athletes, whereas there was a plateau in non-athletes.
Figure 3
Changes in body mass and peak force with maturity for athletes and non-athletes. A. Body mass increased with maturity for both athletes (solid line) and non-athletes (dashed line). The increase in body mass with maturity was greater for athletes. B. Peak force was greater for athletes than non-athletes and increased with maturity for both groups. C. Peak force associated with body mass for both groups. The slope was slightly greater for athletes suggesting a greater increase in peak force with increased body mass than non-athletes. D. Peak stress associated with peak force for both groups. The slope was lower for athletes suggesting that the increase in peak force with maturation had a lesser influence on peak stress.
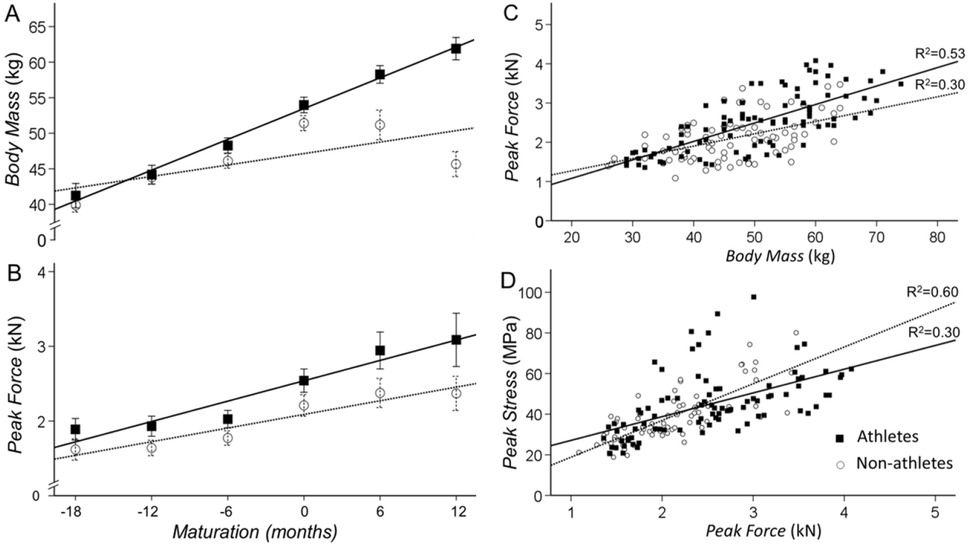
Table 2
Mean (±SD) values per stage of maturity around PHV for non-athletes (NA; N=19) and athletes (A; N=22). BM: body mass (kg), Fpeak: peak force (N), Frel: peak force normalized to body mass (N/kg), CSA ΑΤ: minimum cross-sectional area (mm2), k: stiffness (N/mm), kFM: stiffness normalized to Frel (kg/mm), E: Young’s modulus (MPa), EFM: Young’s modulus normalized to Frel (kg/mm2), εpeak: peak strain (%), σpeak: peak stress (MPa) of Achilles tendon.
Peak force
The main effect for sport participation (athletes vs. non-athletes) and maturation (time) were significant (p<0.01) indicating that athletes were stronger than non-athletes (b=405.1 [166.7643.5], p=0.001) and that plantarflexion strength increased with maturation (Table 2; Figure 3B). The interaction between maturation and sports participation was not significant (b=76.02 [-58.82210.60], p=0.264). When we normalized peak force to body mass (Frel) we find a significant increase with maturation (p=0.046) but no difference between athletes and non-athletes (b=2.70 [-1.436.83], p=0.197).
Peak stress
The main effect for sport participation and maturation were significant (p<0.01) indicating that athletes exhibited increased peak stress compared with non-athletes (b=5.02 [0.78-9.24], p=0.021) and that peak stress increased with maturation (b=3.16 [1.73 to 4.59], p<0.001; Table 2). The interaction between maturation and sports participation was not significant (b=0.29 [-2.593.18], p=0.840).
Associations
To determine the relation of body mass to peak force and peak force to peak stress in athletes and non-athletes we performed the following linear regressions: 1) Body mass and peak force - body mass associated significantly with peak force in both athletes (R2=0.53; p<0.01) and non-athletes (R2=0.30; p<0.01; Figure 3C). The slope was greater for athletes (47.1 vs. 31.5 N/kg) suggesting that the maturation-dependent increases in muscle mass result in greater increases in peak force. 2) Peak force and peak stress - peak force associated significantly with peak stress in both athletes (R2=0.30; p<0.01) and non-athletes (R2=0.60; p<0.01; Figure 3D). However, the slope between the two variables was smaller (0.01 vs. 0.02 MPa/kN) for athletes suggesting that the maturation-dependent increases in strength (muscle mass) result in lesser peak stress in the Achilles tendon. Thus, it appears that sport participation increases body mass at a greater rate in adolescent athletes than non-athletes, which leads to greater plantarflexion strength. However, the strength-induced increases in Achilles tendon peak stress is lesser in athletes than non-athletes, likely due to parallel changes in the internal structure of the tendon.
Morphological changes of the Achilles tendon
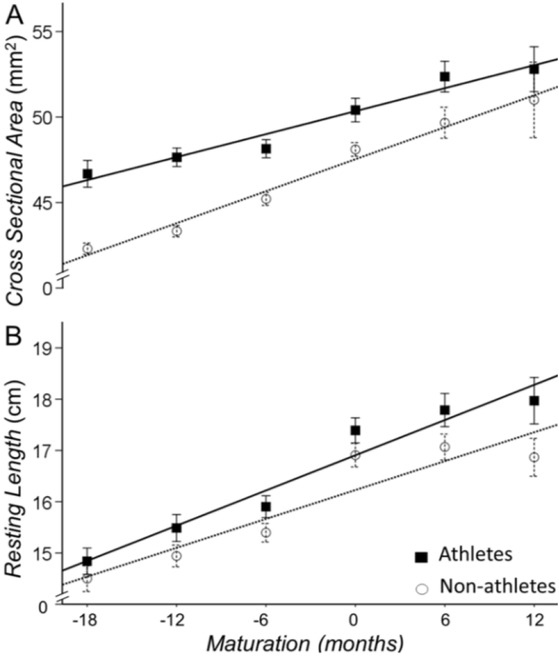
We quantified the Achilles tendon morphological changes with the resting cross-sectional area (CSAAT) and length. The main effect for sport participation (athletes vs. non-athletes) and maturation (time) were significant (p<0.01) indicating the following: Athletes had a greater CSAAT (b=0.027 [0.016-0.038], p<0.001) and resting length (b=0.62 [0.19-1.04], p=0.005) than non-athletes (Figure 4; Table 2). Maturation increased the CSAAT (b=0.013 [0.01-0.02], p<0.001; Figure 4A) and resting length (b=0.73 [0.57-0.89], p<0.001; Figure 4B) of the Achilles tendon for both athletes and non-athletes. The interaction between sport participation x maturation on CSAAT or resting length did not reach significance (b=0.1 [-0.2-1.1], p=0.06 and b=0.09 [-0.15-0.33], p=0.464, respectively). Therefore, although athletes have a thicker and longer Achilles tendon, the rate of increase in these morphological changes appears to be similar for the two groups.
Figure 4
Cross sectional area and resting length of the Achilles tendon for athletes (solid line) and non-athletes (dashed line). Athletes had a greater cross-sectional area (A) and resting length (B) of the Achilles tendon than non-athletes. Maturation increased these morphological changes similarly for the two groups.
Structural changes of the Achilles tendon
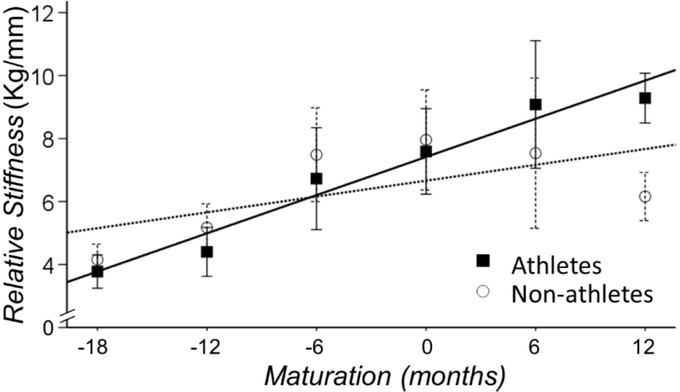
We quantified the Achilles tendon structural changes independent of body weight and peak force with the normalized stiffness (kFM) and Young’s modulus (EFM). Both of these measures were normalized to Frel (peak force normalized to body mass). There was a main effect for maturation for both measures of the Achilles tendon structure (p<0.01). We found that both measures increased with maturation for athletes and non-athletes (kFM: b=1.20 [0.92-1.50], p<0.001; EFM: b=4.25 [3.09-5.42], p=0.001). Furthermore, the interaction between sport participation and maturation was significant for the measures of structural change (kFM: b=0.45 [0.03-0.87], p=.038; EFM: b=1.80 [0.07-3.52], p=.045). Specifically, the rate of increase in kFM and EFM was greater for athletes, suggesting that the rate of increase in normalized stiffness with maturation is greater for athletes than non-athletes (Figure 5).
Discussion
Here, we examined if sport participation interacts with maturation during adolescence to change motor control and the mechanical and morphological properties of the Achilles tendon. To address this, we performed a longitudinal study around the age of peak height velocity (PHV) in adolescent athletes and non-athletes. We found that motor control improves with maturation but not with sport participation in adolescent children. Further, we found that sport participation clearly interacts with maturation and induces unique morphological and mechanical adaptations of the Achilles tendon. Specifically, athletes exhibited a greater increase in body mass and plantarflexion peak force with maturation, which related to increased Achilles tendon peak stress. Morphologically, the CSAAT was greater and AT length was longer in athletes, but the rate of increase with maturation was similar. Nonetheless, the rate of increase in the Achilles tendon stiffness was greater for athletes, as evidenced with normalized stiffness and Young Modulus. These findings provide original longitudinal evidence that sport participation alters the mechanical properties of the Achilles tendon but not necessarily the motor control of adolescent children.
Mechanical properties of the Achilles tendon
Our main interest was to determine if sport participation interacts with maturation to change motor control and the mechanical properties of the Achilles tendon. We found that motor control was influenced by maturation but not sport participation. We found that tendon stiffness and Young’s modulus normalized to Frel (the ratio of peak force to body mass) increased at a greater rate with maturity for athletes than non-athletes. Thus, an important question related to this important finding is the following: “How does sport participation increase Achilles tendon stiffness at a greater rate with maturation?”
It is well accepted that body mass and force are loading factors on the Achilles tendon tissue, which can contribute to increased tendon stiffness (O'Brien et al., 2010). For example, Waugh et al. (2012) reported that peak strength and body mass have separate and additive effects on stiffness through development in children. Although, the effect depends on the timing and rate of maturation process (Malina et al., 2004, Malina and Bouchard, 1991, Waugh et al., 2012, Mogi et al., 2018), there is evidence that increased tendon stiffness in children occurs close to the PHV period (Radnor et al., 2018). Indeed, we found that the rate of increase with maturation in the normalized stiffness (kFM) and Young modulus (EFM) was greater for athletes, and this increased stiffness for athletes associated with greater peak stress but not with peak strain. Therefore, structural changes (EFM) appear to be greater in athletes than non-athletes and these changes appear to be related to peak stress and force. This finding is in line with previous reports where trained pre-pubertal children had greater stiffness of AT than controls after 10 weeks of resistant training (Waugh et al., 2014) and late adolescent athletes had greater stiffness of patellar tendon than adolescents after 2 years training (Mersmann et al., 2017a). Maturity-dependent responses may be indicative of the coactive relationship between loading-specific adaptations and simultaneous growth and maturity-related changes (Lloyd et al., 2016).
The unique change of the Achilles tendon for athletes was not evident when we compared the mechanical properties 6 months before PHV with PHV. This finding suggests that a time period longer than 6 months before PHV is necessary to show the interaction between sport participation and maturation. This challenges previous studies that attempted to address this question by comparing mechanical properties in the 6-month period prior to PHV. Specifically, findings from our 6-month analysis are consistent with the observations of (Neugebauer and Hawkins, 2012), which showed that k or E do not change significantly over a 6-month period around the PHV. Regardless, our findings, which are based on longitudinal measurements, clearly suggest that sport participation interacts with maturation to increase not only the morphological properties of the Achilles tendon but also increases the structural strength of the Achilles tendon.
Morphological changes of the Achilles tendon
With maturation, common morphological tendon adjustments include an increase in cross-sectional area and resting length. Our results show that the interaction between sport participation and maturation on the morphology of the Achilles tendon approached significance (p=0.06). Specifically, athletes had a greater AT cross-sectional area and resting length than non-athletes anywhere from 18 months before to 6 months after PHV (Figure 2B; Table 2). As Mogi (2019) has recently reported, the increase in cross sectional area just before the period of PHV is a protective mechanism to avoid possible injuries.
The effects of maturation on the morphological properties of tendons are conflicting. One study, found that the patellar tendon CSA increased 27% from mid to late adolescence (16-18 years) (Mersmann et al., 2017a), whereas others report reductions in tendon cross sectional areas in early adolescence (Neugebauer and Hawkins, 2012). These controversial reports about the tendon’s hypertrophy in childhood to adulthood could be attributed to the age cohort and the inclusion of adolescents who participated in sports or not (Mersmann et al., 2017b, Cassel et al., 2017), and gender (Intziegianni et al., 2017). Our findings from this longitudinal study show that athletes had greater cross-sectional area and longer resting length of the Achilles tendon than non-athletes. Nonetheless, both athletes and non-athletes increase the cross-sectional area and resting length of the Achilles tendon with maturation at a similar rate. Thus, we show that both maturation and sport participation can increase the morphological properties of the Achilles tendon in adolescence.
The increase in tendon thickness and length with sport participation, at an earlier time from PHV may be an adaptive response to specific training-induced increase in muscle mass and strength (Falk and Eliakim, 2003, Waugh et al., 2014, Granacher et al., 2011). Our findings are consistent with Cassel et al. (2017) who reported greater tendon cross sectional area in athletes than non-athletes in specific sport activities. Nevertheless, our findings are in odds with other studies, which show that sports participation had no significant relationship with cross sectional area (Waugh et al., 2014, Neugebauer and Hawkins, 2012). One possible explanation is the type of sport training that adolescents participated in and thus a unique response to the variable mechanical loading (Radnor et al., 2018). Irrespective of the exact mechanism that induces Achilles tendon hypertrophy in athletes, this finding suggests that sport participation could be beneficial to adolescents.
What are the benefits of increased morphological and structural changes of the Achilles tendon with sport participation?
Our results clearly show that athletes have a greater CSAAT and stiffer Achilles tendon than non-athletes anywhere from 18 months before PHV to 6 months after PHV. Although the Achilles tendon stress was greater in athletes, the morphological adaptation of the tendon (i.e. greater cross-sectional area) reduces the tendon stress at a given tendon force. Therefore, these morphological and structural changes of the Achilles tendon with sport participation likely result in a reduced risk of injury. Such changes will also be protective against injuries that can occur during mid-adolescence when the changes in muscle strength and tendon loading capacity are not complimentary to each other (Mersmann et al., 2017a). Thus the mechanical loading that occurs with sport participation during adolescence can induce positive adaptations, which likely can reduce the risk for injuries while maximize athletic performance (Docking and Cook, 2019).
Limitations
In this study, we did not address the interaction of sex with sport participation and maturation. Female hormones in adolescence could result in differential changes in the cross-sectional area and stiffness (Cassel et al., 2016) with maturity and sport participation. More research is needed to clarify the interaction between hormonal and mechanobiological processes (Mersmann et al., 2017a). In addition, the conclusions are drawn in the absence of examining neuromuscular changes with sport participation and maturity. Thus, future studies will benefit from the use of EMG to quantify the neuromuscular changes associated with sport participation and maturity. Finally, our findings are limited to adolescents and not adults. Future studies should determine if sport participation also influences adults.
Conclusion
Our longitudinal study shows that sport participation interacts with maturation during adolescence and induces unique morphological and mechanical adaptations of the Achilles tendon. Specifically, the Achilles tendon was thicker and longer in athletes, but most importantly the stiffness of the tendon increased at a greater rate in athletes than non-athletes. These findings provide original longitudinal evidence that sport participation alters the mechanical and morphological properties of the Achilles tendon in adolescence. These adaptive changes likely result in protection against possible injuries and improve tendon efficiency.
The authors have no conflicts of interest to disclose. The results of the study are presented clearly, honestly, and without fabrication, falsification, or inappropriate data manipulation.