Introduction
The rate of force development (RFD) expresses the ability of a muscle or a muscle group to rapidly develop external force (Andersen and Aagaard, 2006). The RFD is frequently used to evaluate explosive strength in athletes (Suchomel et al., 2016), clinical populations (Xue et al., 2010), and the elderly (Wu et al., 2017). Several studies have suggested that the RFD is an important performance determinant in sports requiring high-speed and ballistic actions (e.g., sprinting, jumping, throwing, and direction changes in team sports) (Thomas et al., 2015) because rapid movements require short contraction times (80-200 ms) that may not allow maximal muscle force development (Aagaard et al., 2002a, 2007; Rodríguez-Rosell et al., 2017).
Due to its importance for rapid force production, the RFD is commonly monitored in sports as part of a performance or training progression analysis and evaluation (Stone et al., 2003), mainly using isometric muscle actions. Isometric RFD assessment provides valuable and reliable information regarding the ability to generate force rapidly for individuals of varying fitness levels and is easily performed by executing single- or multi-joint movements using isometric muscle actions (Andersen and Aagaard, 2006; Bogdanis et al., 2018; Folland et al., 2014; Tillin et al., 2010). The isometric RFD is usually measured in the first 300 to 400 ms of the rising force – time or torque – time curve. Each section (e.g., 0-50 ms, 50-100 ms) may provide different information regarding neuromuscular performance. The “early phase” RFD (<100 ms) is mainly associated with neural drive and the intrinsic contractile properties of the muscles involved. The “later phase” RFD (>100 ms) depends more on the contractile properties of the muscle, muscle architecture, and maximum muscle strength (Aagaard et al., 2002b; Andersen et al., 2010; Andersen and Aagaard, 2006; Folland et al., 2014).
However, measurement of the RFD during dynamic, as opposed to isometric actions of the lower limbs, may be more relevant to sports performance due to the biomechanical similarities between jumping and the push-off phase in sports movements (McGuigan et al., 2010). Vertical jumps are basic motor skills for most sports and are typically used to assess lower limb explosive performance. The most common types of vertical jumps are the squat jump (SJ) and the countermovement jump (CMJ). The SJ evaluates the concentric movement, or push-off, whereas the CMJ includes the eccentric and concentric muscle actions of the stretch-shortening cycle (SSC) (Komi, 2008).
The similarity between isometric and dynamic RFD characteristics is still a topic of debate, with previous studies reporting conflicting results (McGuigan et al., 2010; Nuzzo et al., 2008). The isometric leg press is one of the most popular methods for assessing neuromuscular function in sports (Abernethy et al., 1995). However, only one previous study examined the relationship between force-time characteristics in the isometric leg press and vertical jumping performance (Marcora and Miller, 2000). Furthermore, few previous studies examined male and female subjects, however, either sex differences were not analyzed separately (Dos’ Santos et al., 2017) or significant differences were reported in the associations of isometric strength and dynamic performance between males and females (Brady et al., 2020). Thus, examining the association between isometric and dynamic muscle actions in male and female athletes may provide information on the strength characteristics associated with dynamic performance. Furthermore, a possible association between the dynamic and isometric
RFD may imply that these evaluations could be used interchangeably to assess explosive lower limb performance between individuals with different levels of muscle strength. Therefore, the present study aimed to examine and compare the RFD at different time epochs between isometric and dynamic actions, performed in commonly used lower limb multi-joint movements in the following exercises: isometric leg press, squat jump (concentric action), and countermovement jump (eccentric followed by concentric action).
Methods
Experimental design
A repeated-measures design was used to compare the RFD and peak force measured during the isometric leg press (ILP), the countermovement jump (CMJ), and the squat jump (SJ). Participants completed two familiarization sessions one week before the main testing. In the main testing sessions, participants performed three types of maximum effort muscle actions: (a) isometric action (ILP), (b) concentric muscle action (SJ), and (c) eccentric-followed by concentric movement (CMJ). Forces applied on the feet were measured using a force plate, and the dependent variables were compared between the three types of muscle action.
Participants
Twenty-three basketball and volleyball players (14 males and 9 females) participated in this investigation (males: 21.4 ± 1.9 years, 75.8 ± 7.4 kg, 1.77 ± 0.6 m, females: 21.6 ± 2.5 years, 65.9 ± 7.2 kg, 1.69 ± 0.07 m). Inclusion criteria were as follows: no lower limb injury within the past six months and at least four years of regular sport-specific and resistance training experience.
After a thorough explanation of the testing protocol, the possible risks involved, and the right to terminate participation at will, written informed consent was obtained from each participant. All procedures were performed following the principles outlined in the Declaration of Helsinki and were approved by the Institutional Ethics Committee (ref. number: 1145/19).
Procedures
Participants were familiarized with the isometric leg press (ILP) and vertical jumps (SJ and CMJ) on the force plate on the first two visits. In addition, during those visits intra-class correlation coefficients were calculated. One week after the familiarization visits, two main testing sessions were conducted 3-4 days apart, in random and counterbalanced order. During one session, participants executed three SJs and three CMJs interspersed with one-minute rest intervals in randomized and alternated order (i.e., one SJ followed by one CMJ, repeated three times). During the second session, participants performed three single repetitions of the ILP, with two-minute rest intervals in between. Participants were asked to avoid any strenuous exercise for 48 hours before each testing session, and all testing was performed at the same time of the day. Before each familiarization and testing session, participants completed a standardized warm-up consisting of 5 min of light cycling against a standard load (60 W) and 5 min of dynamic stretching of the lower limb muscles.
Vertical jump tests – CMJ, SJ
All vertical jumps were executed on a force plate (Applied Measurements Ltd Co., Reading, United Kingdom; WP800), and data were recorded at a sampling frequency of 1000 Hz. All jumps were performed with the hands on the hips (akimbo) throughout the entire jump. The CMJ was executed from a squat depth (knee angle ≈90o), and the SJ started from a semi-squat position maintained for 2 s (knee angle = 90o). SJs during which there was a countermovement at the start of the jump were discarded. The procedure was done using the computer monitor displaying baseline force on a sensitive scale in real-time. The intraclass correlation (ICC) for Fpeak, RFDpeak and the RFD for the consecutive 50-ms time intervals RFDs (overall) for the SJ were: Fpeak 0.99 (95%CI: 0.98-1.00), RFDpeak 0.89 (95%CI: 0.75-0.95) and RFDs 0.83 (95%CI: 0.640.93), and for the CMJ: Fpeak 0.98 (95%CI: 0.950.99), RFDpeak 0.89 (95%CI: 0.75-0.95) and RFDs 0.81 (95%CI: 0.60-0.91).
Isometric leg press (ILP)
Participants wore Olympic weightlifting shoes and were seated on a custom-made steel leg press chair with the seatback set at a 106o angle and placed both feet on the same force plate (Applied Measurements Ltd, Reading, UK) positioned perpendicular to the ground on a concrete laboratory wall. The knee angle was set at 115 ± 4ο, and the hip angle was set at 100 ± 2ο (180° = full extension). The choice of the particular angles was made because maximum force and RFD values have been attained at these angles (Marcora and Miller, 2000; Murphy and Wilson, 1996). Participants were instructed to keep a low steady baseline force at the start (Maffiuletti et al., 2016; Tillin et al., 2013) and to apply their force as fast and as hard as possible and continue their maximum effort until peak force (3-5s) during each repetition. Any trial lacking a steady baseline or uncontrolled pretension or countermovement before the onset of contraction was rejected (Maffiuletti et al., 2016; Tillin et al., 2013). Feedback to the participants was provided by a computer monitor placed in front of the participants, showing the force-time curve in real-time at an appropriate scale. The intraclass correlation (ICC) for Fpeak, RFDpeak and RFD for the consecutive 50-ms time intervals RFDs (overall) for the ILP was: Fpeak 0.96 (95%CI: 0.910.98), RFDpeak 0.93 (95%CI: 0.84-0.97) and RFDs 0.83 (95%CI: 0.64-0.93).
Data acquisition and analysis procedures
Data from the force plate were recorded at 1000 Hz (Kyowa sensor interface PCD-320A, Chofy, Japan). The signal was filtered using a low-pass, 4th order, zero-lag Butterworth digital filter with a cut-off frequency of 20 Hz. The following dependent variables from the force-time data were calculated: a) Peak force (Fpeak) as the highest force value within a 20 ms time interval, b) Peak rate of force development (RFDpeak) as the highest instantaneous RFD value within a 20 ms time interval and, c) Rate of force development as the mean tangential slope (RFD = ΔForce/ΔTime) at consecutive 50 ms time intervals until peak force was attained. The RFD sections for the CMJ and the SJ were 0-50, 50-100, 100-150 ms. For the ILP, the RFD was calculated for an additional time section (150-200 ms) due to the delayed attainment of Fpeak compared with the SJ and the CMJ.
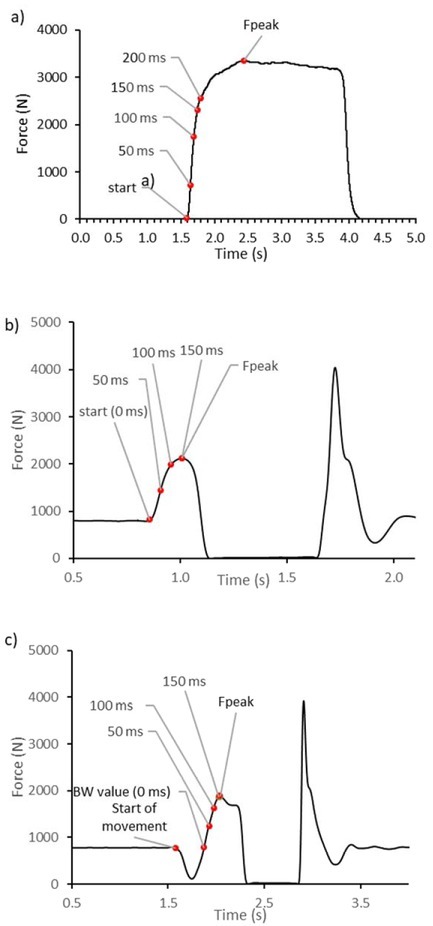
The starting point for RFD calculations was set at 3 x SD of the baseline’s force (Brady et al., 2018; De Ruiter et al., 2006; Dos’Santos et al., 2017). Figures 1a and 1b show an example of RFD calculations for the ILP and the SJ. The starting point for RFD calculations for the CMJ was set to the point where force reached body weight (BW) again on the ascending force-time curve (Ebben et al., 2007; Laffaye et al., 2014; McLellan et al., 2011) (Figure 1c). The choice of the BW point on the ascending force curve for RFD calculations was based on previous studies and represented the time point at which the force generated by the legs was equal to bodyweight to decelerate the downward movement of the body (Linthorne, 2001; Mcmahon et al., 2018). The trial with the highest values of the RFD and peak force was chosen for further analysis.
Figure 1
Typical force-time histories for the (a) isometric leg press, (b) squat jump, and (c) countermovement jump. Red marks indicate selected times for the rate of force development calculations during each trial. Fpeak: peak force, BW: body weight
Accounting for body mass, the obtained RFD and peak force (Fpeak) values were allometrically scaled according to body mass raised to the power of 2/3 (Fpeak/BM2/3, RFD/ BM2/3) (Folland et al., 2008; Jaric et al., 2005; Markovic and Jaric, 2004; Nedeljkovic et al., 2009). RFDs were also normalized with the respective Fpeak (RFD/Fpeak) (Maffiuletti et al., 2016). The displacement of the center of the mass (COM) was calculated using numerical integration of the force-time data.
Statistical analysis
Statistical analyses were carried out using SPSS (IBM SPSS Statistics Version 25). Normality of the data distribution was checked using the Shapiro Wilk’s test. Descriptive statistics (means ± standard deviations) were calculated for all the examined variables. Repeated one-way analyses of variance (ANOVA) were used to compare Fpeak and RFDpeak between the different types of muscle actions. A two-way analysis of variance (RFD time intervals x type of muscle action) examined differences in RFDs time intervals between the ILP, SJ, and CMJ, and a three-way analysis of variance (RFD time intervals x gender x type of muscle action) examined RFD time intervals in males and females, during the different types of muscle actions. When ANOVAs were statistically significant, Bonferroni posthoc tests were performed. The intraclass correlation coefficient (ICC) was calculated using a two-way mixed model to determine test-retest reliability for the dependent variables. Effect sizes were estimated by calculating the partial eta squared (η2) values (small: 0.01 to 0.059, moderate: 0.06 to 0.137, large > 0.138) (Cohen, 2013; Lakens, 2013). For pairwise comparisons, the effect size was determined by Cohen’s d (trivial: < 0.2, small: ≥ 0.2, medium: ≥ 0.5, large: ≥ 0.8) (Cohen, 2013; Lakens, 2013). Statistical significance was accepted at p < 0.05.
Results
The results are presented as absolute values, as well as scaled to BM2/3. CMJ height was 0.34 ± 0.06 m for males and 0.25 ± 0.04 m for females, and SJ height was 0.30 ± 0.06 m and 0.22 ± 0.03 m, for males and females, respectively. Peak force (p < 0.0001, η2 = 0.69, BM2/3: p < 0.0001, η2 = 0.67) and peak RFD (p = 0.0001, η2 = 0.42, BM2/3: p < 0.0001, η2 = 0.42) were approximately two-fold higher during the ILP compared with the SJ and the CMJ (Table 1). There was no difference in peak force or peak RFD between the CMJ and the SJ (Fpeak: p = 0.26, d = 0.14, BM2/3: p = 0.30, d = 0.19, RFDpeak: p = 0.77, d = 0.06, BM2/3: p = 0.82, d = 0.05) (Table 1).
Table 1
Peak force (Fpeak) and Peak rate of force development (RFDpeak) in the countermovement jump (CMJ), the squat jump (SJ) and the isometric leg press (ILP).
RFD 0-50 ms was similar between the ILP, CMJ and SJ (p = 0.99 to 0.57, BM2/3: p = 0.99 to 0.61). However, RFD50-100 ms (p < 0.0001, η2 = 0.54, BM2/3: p < 0.0001, η2=0.55) and RFD100-150 ms (p < 0.0001, η2 = 0.64, BM2/3: p < 0.0001, η2 = 0.65) were higher in the ILP, than the SJ and CMJ (Table 2, Figure 2). Fpeak (p = 0.26, d = 0.14) and force values at 50 ms (p = 0.86, d = 0.04), 100 ms (p = 0.83, d = 0.04), 150 ms (p = 0.41, d = 0.23) were similar for the SJ and CMJ (Figure 3 and Table 1). Consequently, the SJ and CMJ had similar RFDs at all time intervals, namely, 0-50 ms (p = 0.99, BM2/3: p = 0.99), 50-100 ms (p = 0.99, BM2/3: p = 0.99) and 100-150 ms (p = 0.18, BM2/3: p = 0.17) (Table 2, Figure 2). Moreover, Fpeak was attained at the same time point in the CMJ and SJ, i.e. 190 ± 50 ms after the BW starting point for the CMJ and 205 ± 69 ms from the start of movement for the SJ (p = 0.36).
Figure 2
Rate of force development (RFD) at consecutive 50 ms time intervals normalized to BM2/3 for the squat jump (SJ), the countermovement jump (CMJ) and the isometric leg press (ILP). Circles indicate similar values (p > 0.38)
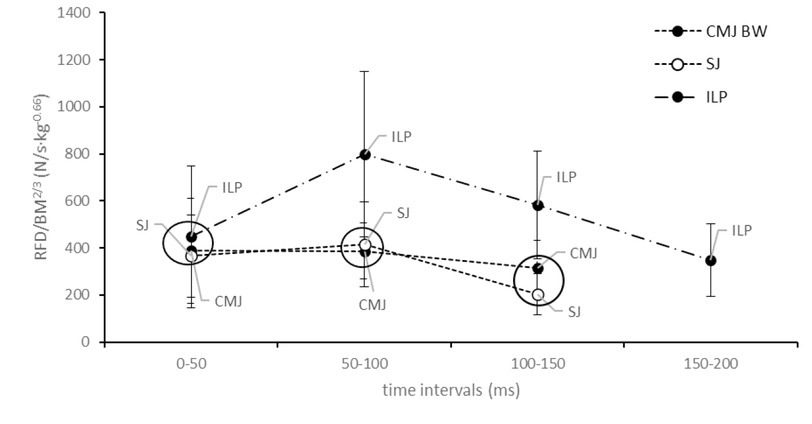
Figure 3
Force values at 50,100 and 150 ms for the squat jump (SJ), the countermovement jump (CMJ) and the isometric leg press (ILP). Values are means ± SD
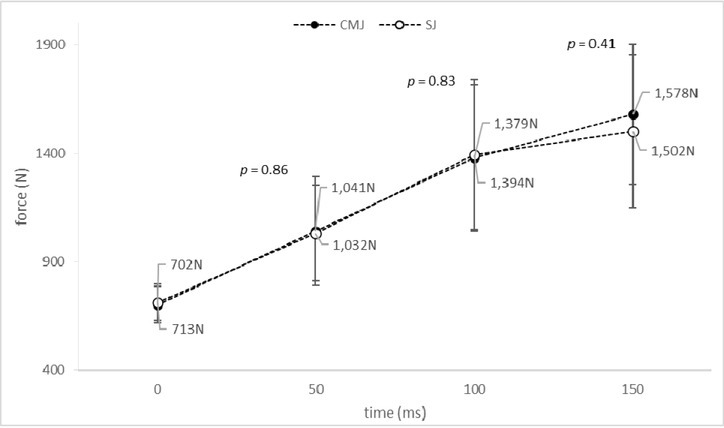
Table 2
Rate of force development (RFD) at consecutive 50 ms intervals for the squat jump (SJ), the countermovement jump (CMJ) and the isometric leg press (ILP)
| RFD 0-50 ms | RFD 50-100 ms | RFD 100-150 ms | RFD 150-200 ms | |
|---|---|---|---|---|
| (N/s) | (N/s) | (N/s) | (N/s) | |
| CMJ | 6769±4200 | 6766±2354* | 5503±2375* | |
| SJ | 6385±3267 | 7235±3300* | 3485 ± 1451* | |
| ILP | 7907±5570 | 14032±6682 | 10154±4281 | 6052±2821 |
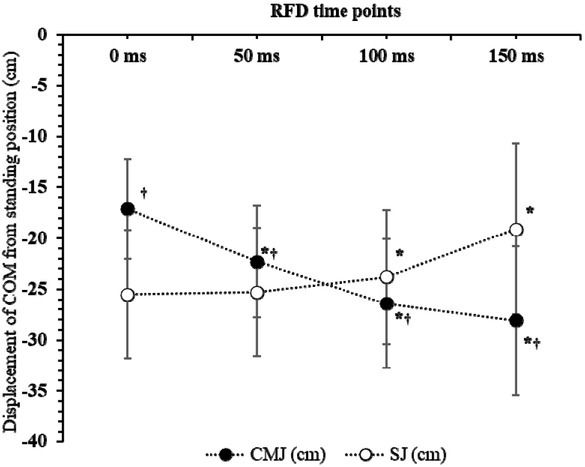
The displacement of the center of mass (COM) from the standing position during the SJ and the CMJ is shown in Figure 4. Notably, at the time range of 0-50 ms during the SJ, there was no COM displacement (Figure 4).
Figure 4
Displacement of the centre of the mass (COM) from the standing position for the time points of 0 ms (start of RFD calculation), 50 ms, 100 ms and 150 ms, for the countermovement jump (CMJ) and the squat jump (SJ). The minus sign indicates downwards movement of the COM for the CMJ. † p < 0.01 from the corresponding SJ time point; * p < 0.01 from the time point of 0 ms.
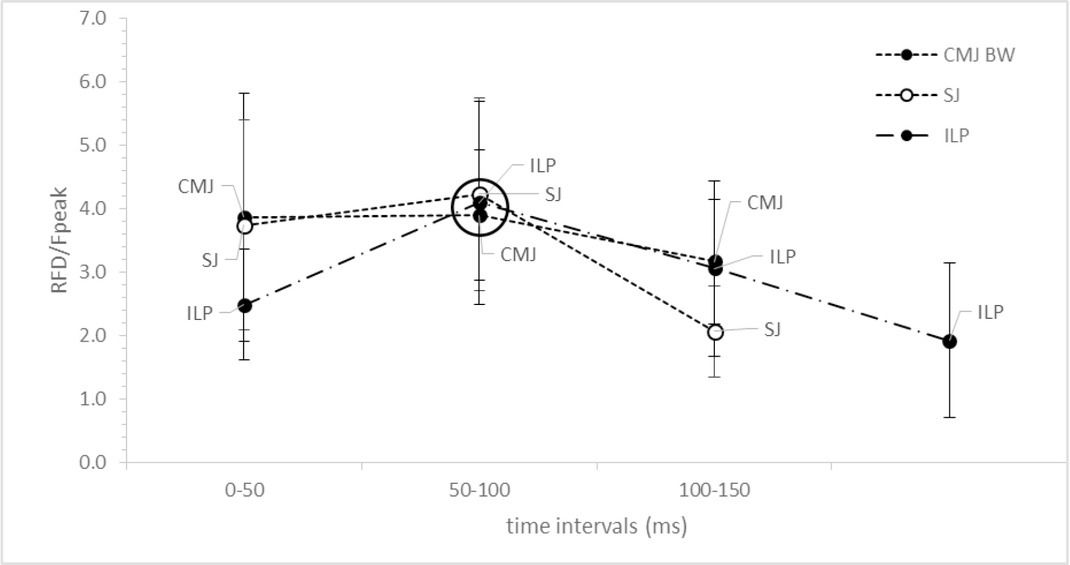
RFD normalized to Fpeak
RFD in consecutive intervals was normalized to the respective Fpeak. The ILP showed the highest RFD/Fpeak at 50-100 ms (p < 0.001, η2 = 0.41), the SJ at 0-50 and 50-100 ms (p < 0.001, η2 = 0.46), while the CMJ demonstrated similar RFD/Fpeak at 0-50, 50-100 and 100-150 ms (p = 0.30, η2 = 0.06). All types of movements showed the same RFD relative to Fpeak at 50-100 ms (p = 0.60, η2 = 0.02) (Figure 5).
Comparison between males and females
Males presented higher Fpeak than females for all exercises examined (CMJ: 1864 ± 293N vs.
1482± 216N, p = 0.003, SJ: 1781 ± 234 vs. 1469 ± 277, p = 0.01, ILP: 4295 ± 1088 vs. 2422 ± 1097, p = 0.001). Comparisons of RFD values normalized to Fpeak revealed that males and females had similar RFD values relative to Fpeak for the CMJ (0-50 ms: p = 0.87, 50-100 ms: p = 0.47, 100-150 ms: p = 0.20) and the SJ (0-50 ms: p = 0.57, 50-100 ms: p = 0.36, 100150 ms: p = 0.56) at all time intervals. The highest RFD values were attained at 50-100 ms (Table 3).
Table 3
Rate of force development (RFD) relative to peak force (Fpeak) for males and females for the squat jump (SJ), the countermovement jump (CMJ) and the isometric leg press (ILP)
For the ILP, males had higher RFD values relative to Fpeak than females only in the initial phase (0-50 ms: p = 0.05, d = 0.90), while there was no difference between males and females at 50100 ms (p = 0.64, d = 0.21), where the highest RFD was observed (Table 3). Also, females had higher relative RFD than males at the later phase (100150 ms: p = 0.04, d = 0.95, 150-200 ms: p = 0.0001, d = 2.06).
Discussion
This study compared the RFD at different time epochs between the ILP, CMJ and SJ in team sport athletes. One main finding was that RFDpeak and Fpeak, force and the RFD at 50, 100, and 150 ms, were similar between the CMJ and the SJ. In addition, RFD0-50 ms was similar between all types of muscle actions, while higher values were observed in the ILP than the CMJ and the SJ in RFD50-100 ms and RFD100-150 ms, and these associations were maintained even when scaled to body mass. Another important finding of this study was that the RFD normalized to Fpeak was higher at the 50-100 ms time interval and similar for the ILP, CMJ, and SJ in both males and females.
The results of this study indicated that the ability to apply maximal force (Fpeak) and RFD was similar between the SJ and the CMJ. This was due to the fact that force at 50, 100, and 150 ms was similar between the two types of jumps irrespective of the height of the jump. The SJ starts from a stationary position, where external force equals bodyweight and involves a concentric muscle action. In contrast, peak force and RFD in the CMJ are calculated during the eccentric phase of the movement (Linthorne, 2001; Van Hooren and Zolotarjova, 2017). It is believed that the CMJ reflects the ability to produce force quickly during stretch-shortening cycle activities. At the same time, the SJ provides an assessment of the capacity to rapidly develop force during a purely concentric movement (McGuigan et al., 2006).
Notably, although some studies have shown that muscle fascicles lengthen during the downward phase of a CMJ (Finni et al., 2001a, 2001b), other studies demonstrated an isometric action of the contractile elements (Kopper et al., 2013, 2014), especially when the CMJ was performed with a small amplitude of movement (Van Hooren and Zolotarjova, 2017). Thus, fascicles may act isometrically during a fast and small amplitude CMJ (Kopper et al., 2014; Roberts and Konow, 2013). In the present study, the amplitude of movement, as implied from the COM displacement, was relatively small and similar between the CMJ and the SJ at the time points of 50 and 100 ms after the start of RFD calculations (i.e., ≈22-26 cm, see Figure 4). Taken together with the findings of the above studies, it is plausible that the range of motion and the position of the leg joints at the 50 and 100 ms time points were very close in the SJ and the CMJ, and this may offer an explanation for the similar RFD at these time intervals. In agreement with the present study, peak force and peak RFD were similar in elite volleyball players (Riggs and Sheppard, 2009) and collegiate weightlifters during the CMJ and the SJ (Kawamori et al., 2006).
Moreover, it was found that RFD0-50 ms was similar between the CMJ, SJ, and the ILP. In the ILP, RFD0-50 ms is evaluated from the start of a forceful isometric action with the knee angle at 120o. In the present study, the position of the COM at 50 ms for the CMJ was very close to that of the SJ (-22.3 ± 5.5 cm vs. -25.3 ± 6.3 cm below the standing height), and thus the leg joints were possibly at a similar position. Moreover, no centre of mass displacement was found in the SJ at the time section of 0-50 ms, suggesting that muscles may act isometrically. Although not measured in the present study, joint positions in the ILP may be similar to those in the CMJ and the SJ at this time interval. In addition, apart from similarities in the range of motion and in the type of muscle contraction during these time sections, it is argued that the determinants of the voluntary RFD are different throughout the rising phase of the contraction (Maffiuletti et al., 2016). Folland et al. (2014) reported that agonist EMG activity was an important contributor to the explained variance in force throughout the 150 ms of rising muscle force, particularly in the initial phase (25–75 ms). In contrast, intrinsic muscle contractile properties were more important for the steeper phase (50-100 ms) of the RFD (Folland et al., 2014). Thus, neural factors (e.g., increase in muscle activation) may be more important at the onset (< 75 ms) of a rapid contraction than the type of muscle action (Aagaard et al., 2002b). This is confirmed by some studies which reported similar electromyographic activity of the plantar flexors between the SJ and the CMJ (Gollhofer et al., 1992), implying comparable muscle activation.
As expected, peak force, RFDpeak, RFD50100 ms and RFD100-150 ms were approximately two-fold higher in the ILP than the SJ and the CMJ. Kawamori et al. (2006) reported that isometric peak force in the mid-thigh pull was significantly higher than in the dynamic mid-thigh clean pull, even when heavy external loads (90% of one-repetition maximum) were used. In that study, the isometric peak force was higher than peak force during the CMJ and the SJ, while the RFD peak was two-fold higher in the isometric trials than in the CMJ and the SJ (Kawamori et al., 2006).
The higher RFD normalized to Fpeak was attained at 50-100 ms, with no differences between isometric and dynamic actions and between males and females. The RFD normalized to Fpeak, is a reliable measure of movement initiation and the ‘quickness’ of force production in sports (Bellumori et al., 2011).
The resulting units of this measure (s-1) make it mathematically independent of strength and the size of the muscle group of interest (Wierzbicka et al., 1991), thus facilitating comparisons between individuals of different strength and body mass on the neuromuscular determinants of quickness. Determinants of ‘quickness’ include neural stimulation of muscle (Brown and Cooke, 1981) and motor unit firing rates (Van Cutsem and Duchateau, 2005). Thus, the absence of differences in RFDpeak/Fpeak between the three types of movements in the 50100 ms time section, despite the RFD peak and Fpeak, in the ILP showing twofold higher values than in the CMJ and the SJ, may be due to the nature of this measure. Mirkov et al. (2004) also found no relationship between Fpeak and RFDpeak/Fpeak during elbow extension and flexion. They argued that RFDpeak/Fpeak was a muscle-force independent form of evaluating explosive force production (Mirkov et al., 2004). In that study, RFDpeak/Fpeak was not associated with movement velocity during elbow extension, thus partly explaining the similar RFDpeak/Fpeak at 50-100 ms found in this study irrespective of the type of movement. In addition, no gender differences were found at this time section (50-100 ms) in RFDpeak normalized to Fpeak. This result is interesting because the absolute strength of females, particularly of the lower limb muscles (Mayhew and Salm, 1990), is approximately 54.0 to 66.0% of the values of males. It is reported that in maximal vertical jumping, females are capable of achieving 54-73% of their male counterparts (Zatsiorsky and Kraemer, 2006). A previous study which evaluated the RFD using maximum voluntary isometric actions reported a twofold higher RFD in males than females (Bell and Jacobs, 1986). The authors assumed that this was due to gender differences in muscle elastic
properties (Komi, 1984). However, the RFDpeak/Fpeak allows for comparisons of quickness between individuals of different strength, muscle size, and body mass. This study found that females demonstrated similar' quickness of force production during the time section of 50-100 ms, irrespective of the type of muscle contraction. Another possible explanation of this result may be that males and females who participated in this study were well-trained athletes, while previous studies examined changes in the RFD in untrained or recreationally active participants (Bell and Jacobs, 1986). Thus, it is possible that athletes with similar training experience may demonstrate a reduction in gender differences. Along this line, Ebben et al. (2007) did not detect differences between male and female athletes in the time course of the takeoff and RFD during the CMJ despite males jumping higher than females, and no correlation was found between the RFD and jumping height in both genders (Ebben et al., 2007).
One limitation of the present study is that joint angles during the CMJ and the SJ were not examined throughout the movement. However, the displacement of the COM may provide a fair estimate of the joint position during the SJ and the CMJ performed by the same individual.
Conclusions
In conclusion, this study found that the ability to exert rapid force was similar between the CMJ and the SJ, irrespective of the direction of movement. Similarities at the onset of a rapid contraction (RFD0-50 ms) between isometric, concentric, and eccentric muscle actions may be attributed to neural factors (e.g., increase in muscle activation) and to the leg joints position between movements. The RFD peak scaled to Fpeak at the time interval of 50-100 ms was similar between males and females and types of muscle action, showing that this measure of ‘quickness’ may depend on neural factors and not strength in trained athletes.
Similarities between the CMJ and the SJ in RFDpeak, Fpeak, and force epochs may imply that these types of jumps could be used interchangeably to assess explosive lower limb performance. Furthermore, similarities between the dynamic and isometric RFD at the onset of a rapid contraction may provide useful information to coaches and practitioners regarding dynamic performance. The RFD normalized to Fpeak offers information on the ‘quickness’ of force production facilitating comparisons between different strength and body mass.