Introduction
Training load (TL) monitoring has been extensively investigated in recent years to help coaches create better and more effective training programs for soccer players (Bourdon et al., 2017; Foster et al., 2001; Impellizzeri et al., 2004; Nakamura et al., 2015). Theoretically, excessive accumulation of TLs during a specific training phase may induce non-functional overreaching and maladaptation in elite athletes (Bourdon et al., 2017; Coutts et al., 2007; Nakamura et al., 2015). On the other hand, well-planned training programs may provide players with adequate balance between stress and recovery, allowing them to achieve (and maintain) higher levels of performance throughout the entire soccer season (Bourdon et al., 2017; Coutts et al., 2007; Impellizzeri et al., 2004). As a consequence, multiple methods of internal and external TL quantification as well as the assessment of recovery status have commonly been employed by researchers, with the possibility of using either inexpensive measurement tools (i.e., scales of perceived exertion and recovery status) or high-technology equipment (i.e., global positioning system devices, GPS) (Cummins et al., 2013; Foster et al., 2001; Mclaren et al., 2018).
In this context, the session-rating of perceived exertion (e.g., s-RPE: perceived exertion multiplied by training duration in minutes) has been shown to be a valid and reliable tool for monitoring internal TLs in various sport disciplines (Bourdon et al., 2017; Foster et al., 2001; Impellizzeri et al., 2004; Milanez et al., 2011; Murphy et al., 2016). The s-RPE experienced by athletes relies on their physical capabilities and on their perception of effort during a given training session (Foster et al., 2001; Impellizzeri et al., 2004; Milanez et al., 2011; Nakamura et al., 2015). For example, it has been shown that futsal players with higher aerobic capacity present lower s-RPE scores (e.g., lower perceived exertion for a given training duration) throughout a short-preseason period (Milanez et al., 2011). Another study on this subject revealed that athletes with superior sprint performance experienced higher s-RPE loads over the initial weeks of a futsal preseason (Nakamura et al., 2015). Lastly, Figueiredo et al. (2021) observed that excessive accumulation of s-RPE loads during the preseason precluded the proper development of aerobic fitness in young soccer players. From these findings, it can be concluded that s-RPE loads are closely related to changes in physical performance which regularly occur during specific training phases, thus supporting its utilization as an effective tool for monitoring internal TLs in professional athletes. In addition, to deeper examine these effects, the implementation of recovery quality assessments becomes also necessary (Kentta & Hassmen, 1998; Nosaka et al., 2006).
Accordingly, the quantification of external TLs through the use of GPS devices allows sport scientists to collect and analyze a substantial amount of training and game data (Casamichana et al., 2012; Cummins et al., 2013; Cunniffe et al., 2009). Different variables extracted from these systems (e.g., total distance covered by athletes during competition, percentage of time spent at different intensity zones, etc.) are typically used by coaches and their technical staff to monitor players’ performance (Cummins et al., 2013; Higham et al., 2016; Mclaren et al., 2018). Nonetheless, more recently, some variables derived from the tri-axial accelerometer function of the GPS systems (e.g., body load [BL]) or from the metabolic cost of acceleration activities performed during soccer-specific activities (e.g., high-metabolic power distance [HMPD]) have been considered, with the intention of better describing the physical and physiological demands imposed on soccer athletes (Buchheit et al., 2015; Cummins et al., 2013; Cunniffe et al., 2009). The rationale behind this recommendation relies on the fact that team-sports are usually characterized by intermittent loads and short-time high-intensity activities (i.e., successive accelerations and decelerations) (Buchheit et al., 2015; Osgnach et al., 2010). Therefore, the “traditional” distance-related variables might underestimate the actual demands of team-sport players (Buchheit et al., 2015; Osgnach et al., 2010). Although these GPS variables have been used to quantify physical activities in team-sports (Cummins et al., 2013; Higham et al., 2016; Mclaren et al., 2018), their sensitivity to detect variations across a variety of training stimuli over specific training periods remains to be established. It is still unknown whether sessions with distinct demands in terms of external loads promote different responses in acceleration- and distance-based variables. In this context, it is essential to examine the relationships between these alternative and more traditional distance-related metrics in soccer players. This information may help practitioners identify variables which more consistently express the physical demands of soccer players during training and match-play.
Another useful alternative for monitoring training responses in team-sport athletes is the frequent utilization of vertical jump (VJ) tests (Loturco et al., 2017), which have been shown to be closely related to sprint performance (Loturco et al., 2019b). This is particularly important in soccer, due to the current and progressive increase in game speed in first division leagues (Barnes et al., 2014; Bush et al., 2015; Loturco et al., 2019a). Furthermore, the high volume of aerobic demands during specific-soccer training practices (e.g., technical-tactical workouts) may affect the proper development of speed-related performance, due to the well-established concurrent training effects (Loturco et al., 2015; Wilson et al., 2012; Wong et al., 2010). Bearing in mind the above-mentioned findings, this could be highly problematic for professional soccer players. Thus, in these athletes, it is important not only to promote appropriate balance between stress and recovery through a constant analysis of TLs across the season, but also to monitor the meaningful variations in VJ performance, in an attempt to reduce the (possible) negative effects of the interference training phenomenon on sprint capacity.
Hence, the aims of this study were to: 1) describe the internal and external TLs experienced by professional players over a 4-week soccer preseason and examine their possible effects on neuromuscular performance and subjective recovery status; 2) investigate the interrelationships between different GPS-derived variables; and 3) analyze the influences of TLs on VJ performance.
Methods
Participants
Eighteen Brazilian elite soccer players (24.3 ± 4.8 years; 180.0 ± 5.7 cm; 74.7 ± 8.3 kg) from the same professional soccer team participated in this study. The sample comprised three central defenders, three fullbacks, seven midfielders, and five forwards. The internal and external TLs of soccer players were quantified from the first day of the preseason until the last training session before the first official match in the “Serie A São Paulo State Championship”, comprising 23 days divided over four weeks. After being informed of the experimental risks, soccer players provided written consent to participate in this study. The research was approved by the local Ethics Committee.
Design
This longitudinal study comprised internal and external TL monitoring across a preseason period of 23 days with 17 training sessions and one friendly match (FM). All soccer players participated in at least 15 (≈80%) training sessions. The schematic presentation of the training schedule is depicted in Table 1. In all training sessions, the internal TL was obtained using the s-RPE method, while the external loads were acquired by means of total distance (TD), high-intensity distance (HID: >5 m.s-1), BL, and HMPD using a GPS system. In addition, the delayed onset muscle soreness (DOMS) and perceived total quality recovery (TQR) information were obtained before starting each training session. VJ performance was frequently assessed using countermovement jumps (CMJ) immediately before specific training sessions selected by the technical staff. At the end of the preseason, the CMJ was assessed in 12 training sessions. Nutritional and hydration practices across the monitored period followed the orientations of the team’s nutritionist.
Table 1
Detailed description of the training sessions across the 4-week preseason period in professional soccer players.
Measures
Session rating of perceived exertion
The internal TL was computed using the s-RPE method (Foster et al., 2001; Impellizzeri et al., 2004). Approximately 15 min after the completion of every training session, players were required to report the intensity of the entire session by means of a 10-point rating of perceived exertion scale (Foster et al., 2001). This value was multiplied by the total duration of every training session. Daily and weekly s-RPE values were retained for further analysis.
GPS analysis
External loads of training sessions were quantified using GPS units, sampling at 5-Hz (SPI Elite, GPS-sports Systems, Australia). The equipment was fitted to the upper back of each player using an adjustable neoprene harness. The GPS contained a tri-axial accelerometer system (sampling at 100-Hz) which was used to quantify body accelerations. The units were turned on ≈10-min before the start of the training session, to allow satellite detection, and placed in the harness immediately prior to the warm-up. The TD and HID were obtained from the GPS, while the BL and HMPD were collected from the accelerometer as described elsewhere (Buchheit et al., 2015; Cunniffe et al., 2009). Furthermore, the same unit was used by each player in all sessions to reduce inter-unit measurement error (Cummins et al., 2013). The validity and reliability of the GPS units used in this study have been previously demonstrated (Cummins et al., 2013).
Total quality recovery scale
The general perceived recovery information was obtained in the morning before each training session using the TQR scale (Kentta and Hassmen, 1998). Soccer players were asked to report how they felt about their general recovery in relation to the last 24-h (including night sleep). The TQR scores vary between 6 and 20 with the lowest values representing poorer recovery and the highest scores representing a good recovery state.
Delayed onset muscle soreness
Muscle soreness was subjectively assessed using a visual analogue scale, which consisted of a 100-mm line with no pain at one extremity and extreme pain at the other end (Nosaka et al., 2006). The DOMS score was obtained in the morning before each training session at the same time as the TQR assessment.
Vertical jump tests
VJ height was determined using the CMJ. To perform the test, soccer players were instructed to execute a downward movement followed by a complete extension of the legs and were free to determine the countermovement amplitude to avoid changes in jumping coordination. All attempts were executed with the hands fixed on the hips. VJs were executed on a contact platform (Elite Jump®, S2 Sports, São Paulo, Brazil), with a total of 5 attempts being allowed with 15 s rest intervals between jumps. The best CMJ attempt was retained for analysis.
Statistical analyses
The normality of data was confirmed using the Shapiro-Wilk test. Data are presented as means ± standard deviations (SD). The smallest worthwhile changes (SWC) in variables tested were calculated as 0.3 x within-athlete test-to-test coefficient of variation (Hopkins et al., 2009). Terms such as possibly and unclear were used if 90% confidence limits (CL) of a given variable crossed one or both SWC boundaries (Hopkins et al., 2009), respectively. Otherwise, if the 90% CL did not cross SWC boundaries, the effect was inferred as probably. In addition, soccer players were divided, using a median split analysis, into two groups according to their initial CMJ performance (i.e., “lower” and “higher” CMJ). To compare the differences in the weekly s-RPE load and TD as well as changes in CMJ performance pre- and post- the preseason period between lower and higher CMJ groups, the magnitude-based inferences were used (Batterham & Hopkins, 2006). The quantitative chances of the lower or higher CMJ groups having higher, similar or lower values were assessed qualitatively as follows: <1%, almost certainly not; 1 to 5%, very unlikely; 5 to 25%, unlikely; 25 to 75%, possible; 75 to 95%, likely; 95 to 99%, very likely; >99%, almost certain. If chances of having better and poorer results were both >5%, the true difference was assessed as unclear. A likely difference (>75%) was considered as the minimum threshold to detect meaningful differences.
Finally, Pearson product-moment coefficient of correlation was used to analyze the relationships between s-RPE and external load variables (i.e., TD, HID, BL, and HMPD), and the correlations among the four variables of the external load. Relationships were further analyzed between initial CMJ performances with the total s-RPE load accumulated across the four weeks of the preseason. The threshold used to qualitatively assess the correlations was based on the following criteria: <0.1, trivial; 0.1-0.3, small; 0.3-0.5, moderate; 0.5-0.7, large; 0.7-0.9, very large; >0.9 nearly perfect (Hopkins et al., 2009). The level of significance for the correlations was set at p < 0.05.
Results
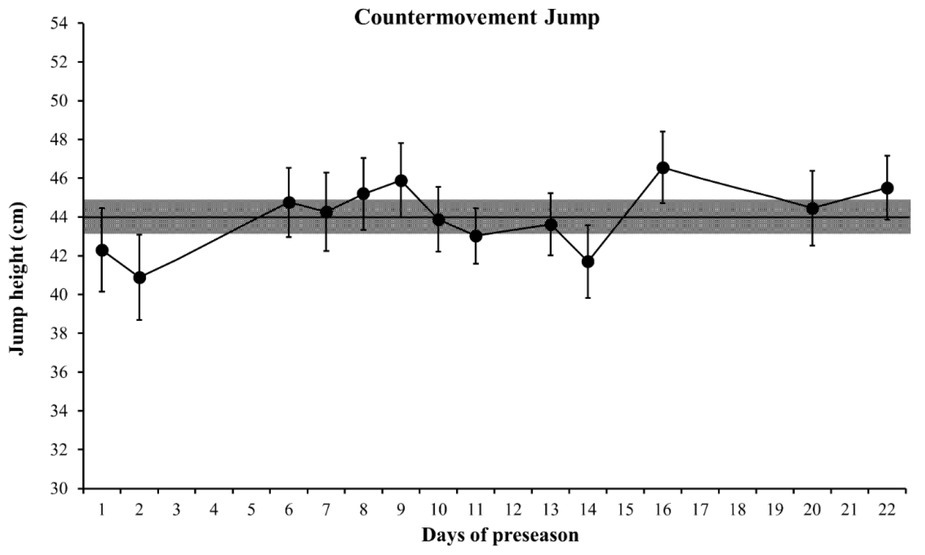
The internal TL experienced in each training session and the TQR and DOMS scores are presented in Figure 1. The external TL variables are presented in Figure 2. In general, the four tested variables of the external load demonstrated a similar variation across the preseason period, with the highest values for all variables being observed in the FM. The variations in VJ performance across the 4-week preseason are depicted in Figure 3. VJ performance revealed meaningful changes over the investigated period. A meaningful increase in VJ height was observed in the last assessment in relation to the first measure.
Figure 1
Variations in the internal training load, total quality recovery, and muscle soreness scores over the 4-week training period. Middle lines are the mean values of the eighteen training sessions. The grey area represents the smallest worthwhile change and error bars are the 90% confidence limits. Black bars represent the friendly match. s-RPE: session-rating of perceived exertion.
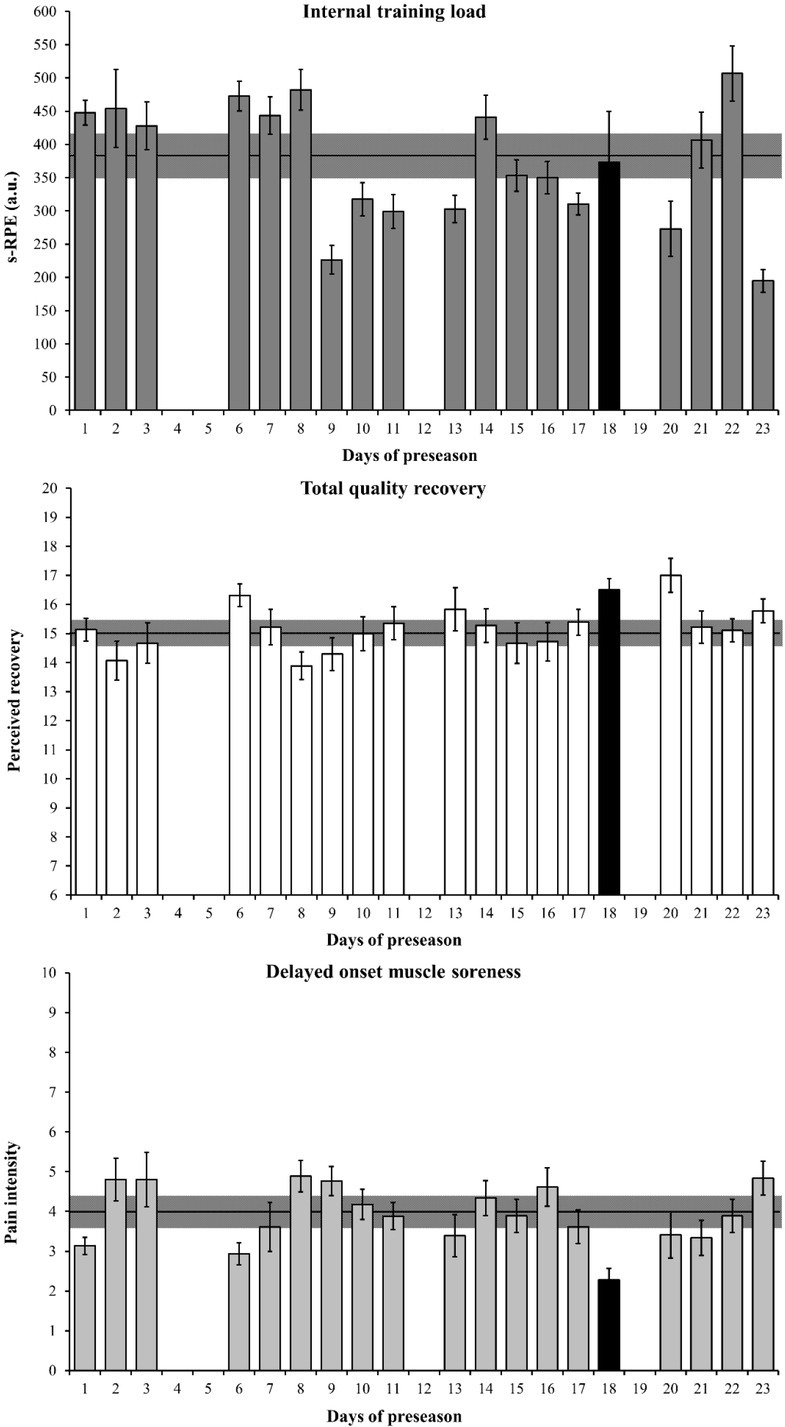
Figure 2
Variations in the external training load variables over the 4-week preseason period. Middle lines are the mean values of the eighteen training sessions. The grey area represents the smallest worthwhile change and error bars are the 90% confidence limits. Black symbols represent the friendly match. Values were relative to duration of the sessions in minutes.
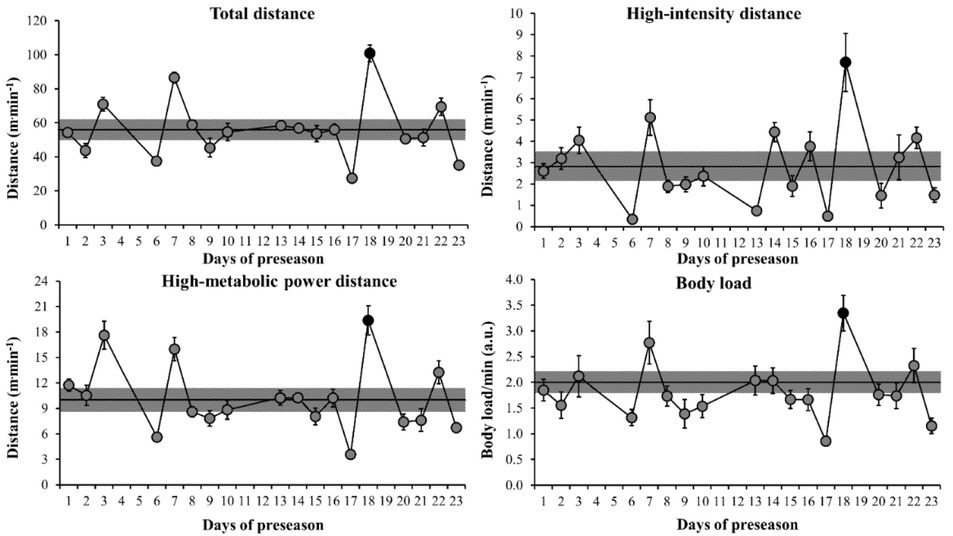
Figure 3
Variations in the countermovement jump over the 4-week preseason period. Middle lines are the mean values of all assessments performed. The grey area represents the smallest worthwhile change and error bars are the 90% confidence limits.
Individual and group correlation coefficients between s-RPE and external load markers are presented in Table 2. The s-RPE was largely correlated with TD distance and HMPD, while it was moderately correlated with HID and BL when analyzing the mean group scores. Table 3 demonstrates the individual and group relationships among the four external load variables. The TD was very largely correlated with the other three tested variables (i.e., HID, HMPD, and BL).
Table 2
Individual and group correlation coefficients between session-rating of perceived exertion and external load variables in professional soccer players.
Table 3
Individual and group correlation coefficients among the four external load variables in professional soccer players.
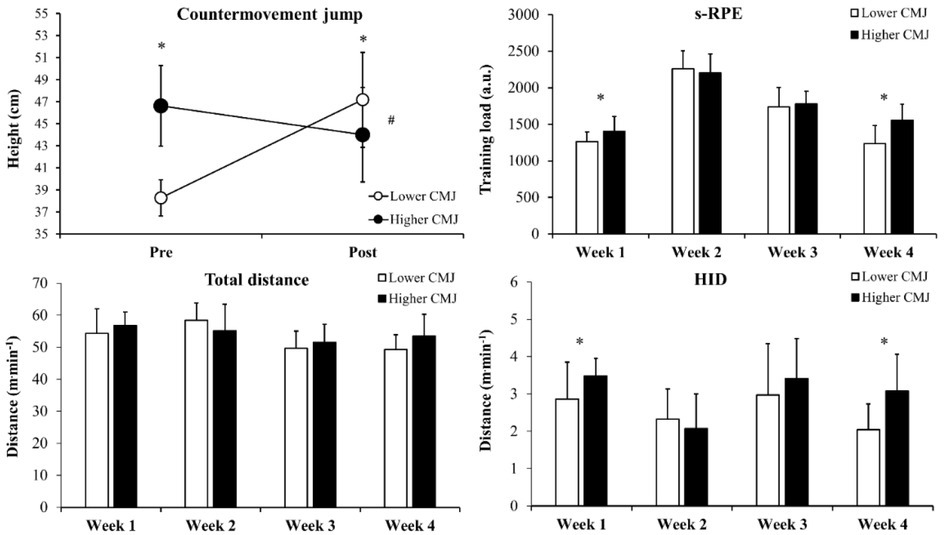
Figure 4 depicts the comparisons of CMJ changes pre- and post-training and the comparisons of the s-RPE, TD, and HID across the 4-week preseason period between the lower and higher CMJ groups. The lower CMJ group presented an almost certainly increase in CMJ performance, while it was likely reduced in the higher CMJ group. In addition, higher CMJ group demonstrated likely and very likely higher s-RPE loads and HID in weeks 1 and 4 than the lower CMJ group, respectively. When analyzing the total internal TL accumulated and the mean HID covered over the 4-week period, the higher CMJ group presented likely higher values than the lower CMJ group in both variables (7077.2 ± 610.9 a.u. vs. 6440.5 ± 668.1 a.u. of s-RPE; and 2.49 ± 0.86 m.min-1 vs. 2.99 ± 0.66 m.min-1 of HID, for lower and higher CMJ groups, respectively). Additionally, no meaningful differences were observed in the mean TD when comparing lower and higher CMJ groups (52.2 ± 4.0 m.min-1 vs. 54.0 ± 5.8 m.min-1, respectively). Finally, the initial CMJ performance was largely correlated with the total s-RPE load accumulated over the preseason period (r = 0.65; p < 0.05).
Figure 4
Comparisons of the countermovement jump (CMJ) height, session-rating of perceived exertion (s-RPE), total distance, and high-intensity distance (HID) over the 4-week preseason period between higher and lower CMJ groups. Data are presented as mean and standard deviation. *Meaningful differences between groups (at least “likely”); #Meaningful difference in the changes between groups.
Discussion
After analyzing internal and external TLs and neuromuscular changes in professional soccer players after a 4-week preseason, we observed that: 1) in periods where higher s-RPE values were detected, reduced TQR and increased DOMS scores were recorded, possibly indicating lower levels of recovery; 2) the four variables of the external TL examined displayed a similar pattern of variation across training sessions, with the highest values being observed during the FM; 3) TD was very largely correlated with the other three external TL variables; 4) CMJ height presented positive and negative changes throughout the four weeks, exhibiting one of its highest values at the end of the preseason; and 5) the group with superior CMJ performance at pre-demonstrated decreased jump performance at post-test; and perceived higher TLs, and covered higher HID across the four weeks (when compared to the group with inferior CMJ performance). These findings provide valuable information for coaches and sport scientists working in the field, in terms of training monitoring and physical performance variations during short and congested professional soccer preseasons.
In general, s-RPE loads were moderately to very largely correlated with the external TL variables (Table 2). These results agree with those described in a meta-analysis, indicating strong positive associations between s-RPE and external TL measures (i.e., TD and HID) (Mclaren et al., 2018). Still in this context, we can observe that, in response to periods of higher values of s-RPE, in general, lower TQR and higher DOMS scores were reported (Figure 1). In this regard, a compelling body of evidence has consistently shown that, during periods of high demands and extensive TLs, athletes from different sports usually report higher values of perceived stress and fatigue, and lower scores of subjective recovery and the mood state (Coutts et al., 2007; Kentta & Hassmen, 1998). On the other hand, other studies have already revealed that, when TLs are progressively reduced, the subjective markers of fatigue tend to decrease, and recovery, increase (Coutts et al., 2007; Kentta and Hassmen, 1998). Together, these facts highlight the usability and sensitivity of these “subjective assessment tools” (i.e., s-RPE, TQR, and DOMS) to indicate athletes’ readiness for training and competition.
The four variables of external TLs analyzed in this study (TD, HID, BL, and HMPD) displayed similar variations throughout the preseason period (Figure 1). Players completed nine small-sided game (SSG) sessions within the four weeks (Table 1); nonetheless, notably, the highest values for all GPS metrics were observed during the FM. In fact, it has been demonstrated that physical demands can be very different between SSGs and “regular” matches, which appears to be commonplace in numerous sports (Casamichana et al., 2012; Higham et al., 2016; Murphy et al., 2016). For example, gamed-based training sessions resulted in lower external TLs (i.e., TD, accelerations, and shot rate, relative to fixed periods of time) than matches in tennis and rugby sevens players (Higham et al., 2016; Murphy et al., 2016). Similarly, Casamichana et al. (2012) observed higher demands in the high-intensity domain (i.e., running velocities > 21 km.h-1; relative to 1 hour of play) during FMs when compared to SSGs in semiprofessional soccer players (Casamichana et al., 2012). Thus, although SSGs have been extensively used by practitioners (Halouani et al., 2014; Hill-Haas et al., 2011) to simultaneously improve soccer-specific fitness and respective technical-tactical skills, at least in the current study performed with elite soccer players, this training strategy was not capable of reflecting the actual physical demands of an official match. Therefore, coaches and sport scientists should be aware of these differences and particularities when programming SSGs for professional soccer players, especially during congested preseasons.
The variations in neuromuscular status across the four weeks were assessed through the utilization of the CMJ test. This simple and convenient monitoring tool has been shown to be very effective in detecting changes in power performance of team-sport athletes exposed to different magnitudes and types of TLs (Loturco et al., 2017). Overall, soccer players experienced positive and negative changes in the CMJ ability over the entire preseason, with an “unexpected” improvement by the end of the preseason (Figure 3). Nevertheless, when athletes were divided into two groups by median split according to their initial CMJ height (i.e., “lower” and “higher” CMJ), opposite (and critical) behavior was observed (Figure 4). Whereas the lower CMJ group displayed an “almost certainly increase”, the higher CMJ group presented a “likely” decrease in jump performance. Of note, the higher CMJ group covered greater HID and also reported higher s-RPE scores than the lower CMJ group throughout the intervention. Moreover, the large and very large associations between HMPD with s-RPE and HID, respectively, indicated the elevated metabolic cost of soccer-specific activities, which seems to be higher in players with superior neuromuscular performance. Thus, it is likely that the “more powerful players” experienced increased training stress, associated with insufficient recovery levels and overreaching symptoms (Coutts et al., 2007; Nakamura et al., 2015). Furthermore, it is possible that the greater volume of high-intensity activities (i.e., HID) performed by the higher CMJ group across the four weeks maximized the concurrent training effects in this powerful group (Loturco et al., 2015; Wilson et al., 2012; Wong et al., 2010), who potentially have more difficulties to cope with (and adapt to) aerobic-based loads (Castagna et al., 2013; Loturco et al., 2015; Nakamura et al., 2015). These results are similar to those found in a previous study performed with futsal players, in which subjects with superior neuromuscular capacity (i.e., “faster athletes”) reported higher s-RPE and presented higher decreases in the maximum sprint velocity after the preseason (Nakamura et al., 2015). Therefore, practitioners are recommended to frequently adjust TLs even during “short” soccer preseasons, always based on different monitoring tools, and according to the individual characteristics of their athletes. This may, for example, reduce the possible decreases in speed and power capacities in faster and more powerful players, which can be a problematic issue in professional soccer (Barnes et al., 2014; Bush et al., 2015; Loturco et al., 2019a; Loturco et al., 2015).
This research is limited by its descriptive nature; hence, it would be relevant to analyze how different training programs may impact TLs and chronic training responses of elite soccer players. In addition, the limited period of time (e.g., 4-week preseason) precludes the application of our results to more extensive training periods. Nonetheless, it is important to emphasize that the current investigation was carried out in the course of a professional soccer preseason, which supports the applicability of our findings in real soccer scenarios. Further investigations reporting the variations in internal and external TLs in more extensive training periods (e.g., the whole competitive season; including official matches) are clearly warranted. Lastly, additional studies should be conducted to test whether different training schemes are able to avoid (or even reduce) the concurrent training effects in faster and more powerful soccer players.
Practical Implications
The four external TLs analyzed in this study were closely interrelated and presented similar variations throughout the 4-week preseason. This information is useful for performance analysts during their daily practices. At least for professional soccer players, the resembling variation patterns observed herein reinforce that different distance- and acceleration-derived variables may be used to monitor TLs. Additionally, coaches should keep in mind that external TLs experienced during SSGs are lower than during FMs. As an alternative, more FMs could be scheduled during preparatory periods (e.g., preseason) to expose players to higher physical demands in terms of external loads. Moreover, coaches and sport scientists are strongly encouraged to frequently assess VJ performance of professional players throughout short and congested soccer preseasons, adjusting TLs and strategies according to their individual responses and physical characteristics. This simple and practical approach might attenuate the negative effects provoked by the interference training phenomenon, especially in more powerful athletes. This could be achieved, for example, by increasing the interval between two consecutive workouts, reducing the volume of specific-soccer training (e.g., SSGs), and/or increasing the frequency or duration of resistance training sessions for these respective players. With this information, the coaching staff can individually adjust players’ TLs, reducing impairment in the neuromuscular capacity commonly observed throughout the high-volume preseasons.
Conclusions
Perceived scores of recovery and muscle soreness were compromised in periods where higher s-RPE loads were reported, reinforcing the importance of constantly monitoring the balance between stress and recovery in soccer players. SSGs did not mimic the physical and physiological demands of the FM. The s-RPE score reported during the FM remained within the trivial zone, suggesting that athletes coped well with match demands. More powerful soccer players experienced higher TLs and presented meaningful impairment in CMJ performance. This indicates that soccer players with superior VJ performance are potentially more susceptible to concurrent training effects.