Introduction
Enhancement of vertical jump performance is a common goal for researchers, coaches and athletes since the capacity to jump higher than an opponent may be advantageous in team competitions and in many individual sports. Several studies have examined the efficacy of various training methods on jumping ability (Perez-Gomez and Calbet, 2013). Effective training methods include plyometric training (Markovic, 2007; Matavulj et al., 2001; Stojanović et al., 2017), weight training (Pareja-Blanco et al., 2016; Wilson et al., 1993), combined plyometric and weight training (Golas et al., 2016; Lloyd et al., 2015; Pagaduan and Pojskic, 2020; Rodriguez-Rosell et al., 2015), whole body vibration training (Fagnani et al., 2006; Torvinen et al., 2002), and electro-myo stimulation training (Paillard et al., 2008). Most of these studies evaluated the effects of training methods on vertical jump performance by measuring the changes in jump height (Lyttle et al., 1996; Pareja-Blanco et al., 2016). While the main objective in most training studies has been to examine how training can improve jump performance, many questions remain unresolved in relation to the biomechanical mechanisms that explain the gains in jump performance following training (Perez-Gomez and Calbet, 2013).
Many studies have examined the force application, power, velocity and displacement of the center of mass variables related to increases in jump height (González-Badillo and Marques, 2010; Kirby et al., 2011; McBride et al., 2010). Likewise, previous investigations showed that a similar jump height could be reached through different combinations of these biomechanical variables in the vertical jump (Kirby et al., 2011; Morin and Samozino, 2016; Salles et al., 2011). Knowledge of the imbalances in biomechanical variables that explain vertical jump performance could be important to training individualization (Samozino, 2013). It is also necessary to understand the effects of different training methods on the vertical jump mechanics. Nevertheless, few studies have analyzed the training effects of differing methods on biomechanical variables during jumping tasks (Arabatzi, et al., 2010; Cormie et al., 2010a, 2010b, 2010c; Markovic, et al., 2013).
From a biomechanical perspective, the most frequently studied training method has been weight training based on lifting loads (Cormie et al., 2010a, 2010b, 2010c). However, the biomechanical changes resulting from other types of training such as plyometrics and combined training have received much less attention in the literature (Arabatzi et al., 2010) despite the improvement in jump performance they appear to produce (Lloyd et al., 2015; Rodriguez-Rosell et al., 2015). In addition, no studies were conducted in female athletes, thus it is unknown how jump performance changes after different training methods in this population. Consequently, new investigations explaining the mechanism of vertical jump improvements in female athletes are required to guide strength and conditioning professionals in selecting optimal training methods for female athletes. Therefore, the purpose of this study was to assess and compare the effects of plyometric training and combined training programs on vertical jump kinematics and kinetics of female basketball players.
Methods
Participants
Sample size was determined a priori (α = 0.05, β = 0.20, desired effect size = 0.3) for one-way analysis of variance (ANOVA) with repeated measures using a power analysis program, G*Power 3 (Faul et al., 2007). The results of the power analysis indicated that a minimum sample of thirty participants in total were needed. Thirty-six competitive female basketball players were recruited, exceeding the minimum estimated sample size (Table 1). All participants had a minimum basketball training experience of 5 years and had prior experience in jumping tasks. No participants had suffered from any musculoskeletal injury or nervous system dysfunction within 6 months before participation in this study. The study was conducted in accordance with the Declaration of Helsinki and was approved by the Local Ethics Committee.
Design and Procedures
This study was designed to assess and compare jump performance as well as kinetic and kinematic adaptations following three different training programs. Participants were matched, based on countermovement jump height, and randomly assigned to one of the three groups (Research Randomizer version 4.0, Urbaniak and Plous, 2013): combined training (n = 13), plyometric training (n = 11) and control (n = 12). All participants continued basketball training, consisting of three sessions and one match per week. The duration of each session was 90 min and coaches decided on the type and intensity of the exercise performed. In addition, the combined and the plyometric groups completed 2 extra sessions per week of combined or plyometric training, respectively. The study was completed during the mid-season period.
Participants performed familiarization sessions, executing the countermovement jump and assigned training exercises. Due to the prior experience of participants, two practice sessions were sufficient to guarantee correct execution of jumps and back squats. The countermovement jump tests were carried out 72 hours before and after the 6-week training intervention. Testing and training sessions were performed in the same laboratory and at the same time of day for each participant. The environmental conditions were similar during the testing and training sessions.
Vertical jump test. Immediately before testing, all participants performed a 10 min general warm up which included 2 min of low-intensity aerobic exercise, dynamic stretching exercises and one set of 6 sub-maximal jumps (Vetter, 2007). After the warm up, participants performed 5 maximal countermovement jumps. A one minute rest interval was given between each countermovement jump attempt. Participants kept the arms akimbo from the start until the completion of the landing phase of the jumps. The countermovement jump test was executed on a force plate (Quattro Jump, Kistler Instrument AG, Winterthur, Switzerland) sampling at 500 Hz.
Isoinertial progressive resistance test. Before testing, participants performed joint-mobilization, 5 repetitions of unresisted full squats and 2 sets of 5 repetitions with 10 kg resistance. The assessment consisted of an isoinertial test with increasing resistance using the full squat exercise performed on a Smith machine (Multipower Fitness Line, Peroga, Murcia, Spain). Gonzalez-Badillo et al. (2015) provide a complete description of the testing procedure used in this study. A dynamic measurement system (T-Force System, Ergotech, Murcia, Spain) provided the mean bar propulsive velocity of each repetition. Participants performed the upward movement phase of the full squat at maximal velocity and the downward movement phase at a controlled velocity (0.4-0.5 m·s-1). The initial resistance load (mass) was 17 kg and this was progressively increased; the test ended when participants reached a 1 m·s-1 (0.96-1.04 m·s-1) mean propulsive velocity in the upward movement phase (González-Badillo et al., 2015). Participants executed three repetitions for each resistance and were allowed three minute rest intervals between each set.
Training programs. The warm up consisted of 7 min of standard activities (i.e. jogging and joint-mobilization exercises) and 2 sets of full squats for combined and 2 sets of jumps for the plyometric group. Table 2 provides a complete description and the load progression of each training program. The combined and plyometric groups performed 12 sessions on non-consecutive days during the 6-week training intervention. Each session lasted approximately 35 min and was conducted before basketball training. The combined group performed full squats on the Smith machine with relative resistance and repeated jumps using body weight as the overload with an emphasis on short contact time and maximum jump height. The relative resistance of the full squat lifted by each participant was assigned according to the movement velocity of the bar during the initial isoinertial progressive squat resistance test. The resistance of the full squat was recalculated for subsequent sessions. Between the full squat sets, players were allowed three minute rest intervals and a one minute rest interval was provided between the rebound jump sets. The plyometric group executed drop jump (from 20, 30 and 40cm) and rebound jump sets. All training sessions were supervised by the researchers.
Table 2
Training program for the combined and plyometric groups.
Force-time measures of the countermovement jumps from the force plate were analyzed by the impulse method (Linthorne, 2001). Net impulse was obtained by integrating the net vertical force with respect to time, from 2 s prior to the first movement of the participant (Street et al., 2001). The start of the movement was detected by searching forward from the first intersection of vertical ground reaction force within a predefined threshold of 1.75 times the peak residual force during the 2-s body weight averaging period. A backwards search was then performed until ground reaction force passed through body weight (Street et al., 2001). The moment of the take-off was defined as the first intersection of vertical ground reaction force within an offset threshold and this threshold was determined by adding the average flight time (i.e., 0.4 s) and the peak residual of the offset (Street et al., 2001). Subsequently, the center of mass vertical velocity was calculated by dividing the net impulse by the participant´s body mass. The vertical center of mass displacement was derived by integrating the vertical center of mass velocity. All variables quantifying force were normalized to body weight to exclude the influence of weight on the results. Several performance variables were determined during the countermovement jump. Force variables analyzed were: the minimum force during the countermovement, force at the beginning of the upward movement phase, the peak force and the average force of the upward movement phase. The net mechanical power was calculated as the product of vertical ground reaction force and velocity. Power variables analyzed were the peak power of the downward and upward movement phase. The maximal downward and upward movement velocities of the center of mass and the crouch position (maximum lowering of the center of mass during the downward movement phase) were measured. The duration of the downward and the upward movement phase were analyzed.
Statistical analysis
Means and standard deviations were computed for all the measures. Relative changes in performance were expressed with 90% of confidence limits (CL) and all data were first log-transformed to reduce bias arising from non-uniformity error. The effect size (ES) for within or between-groups comparisons was determined and threshold values were >0.2 (small), >0.6 (moderate) and >1.2 (large) (Hopkins et al., 2009). Changes in the variables analyzed were expressed as the smallest worthwhile change, which was based on a Cohen effect-size principle: 0.2 × between-athlete standard deviation (Hopkins et al., 2009). Quantitative changes of positive or negative effect were assessed qualitatively as: 25 − 75%, possible; 75 − 95%, likely; 95 − 99%, very likely; >99%, almost certain. If the probabilities of the effect being substantially positive or negative were both >5%, the effect was reported as unclear (Buchheit and Mendez-Villanueva, 2014). A substantial effect was set at >75% (Suarez-Arrones et al., 2013, 2015).
Results
Mean values and standard deviations of the three groups pre-test and post-test are presented in Table 3. Changes in jump height were found to be almost certain following both interventions, as chances that the true modifications were positive/unclear/negative were 100/0/0% for combined (Δ 12.2%, moderate ES) and plyometric (Δ 7.2%, small ES) groups.
Table 3
Training program for the combined and plyometric groups
[i] ES, effect-size, Hmax, jump height; Fmin, minimum force; Fav, average force; Fcrouch, crouch postion force; Fmax, peak force; Vmaxneg, maximum negative velocity during the downward phase; Vmax, maximum velocity during the upward movement phase, TECC, eccentric time; TCON, concentric time; PPowerECC, eccentric peak power; PPowerCON, concentric peak power. Change *likely substantial, ** very likely substantial, ***almost certainly substantial.
Within-Group Changes. The combined group showed unclear differences in all force application variables except the minimum force where a likely, substantial small ES was observed. In addition, moderate ES increases in maximum downward and upward movement phase velocity of the center of mass of 13.9% (0/2/98%) and 6.4% (100/0/0%) were found, respectively. Changes in the countermovement center of mass displacement of 10.8% deeper showed a moderate ES likely substantial (2/10/88%) after combined training. Finally, substantial increases were observed between the pre-test and post-test in the combined group for eccentric peak power (small ES, 0/6/94%) and concentric peak power (moderate ES, 100/0/0%). The plyometric group showed small ES decreases in average force (0/6/94%) and force at the beginning of the upward movement phase (1/10/89%) and a moderate ES decrease in peak force (0/1/99%) after the intervention. Furthermore, a small ES increase in the maximum negative velocity during the downward movement phase (0/9/91%) and maximum upward movement phase velocity (100/0/0%) was observed. Changes in the crouch position were 17.7% deeper with a moderate ES (0/0/100%) in the plyometric group following training. Finally, the plyometric group showed substantial increases in the eccentric peak power (small ES, 0/19/81%) and in the duration of the downward movement phase (moderate ES, 83/15/2%). The control group showed unclear differences in the variables analyzed except in force at the beginning of the upward movement phase and maximum force where a small ES decrease was observed.
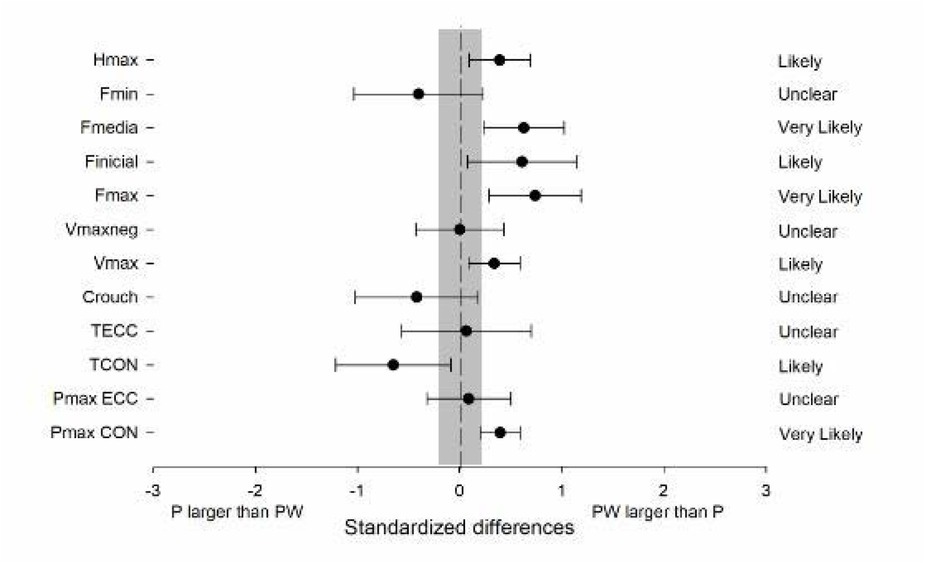
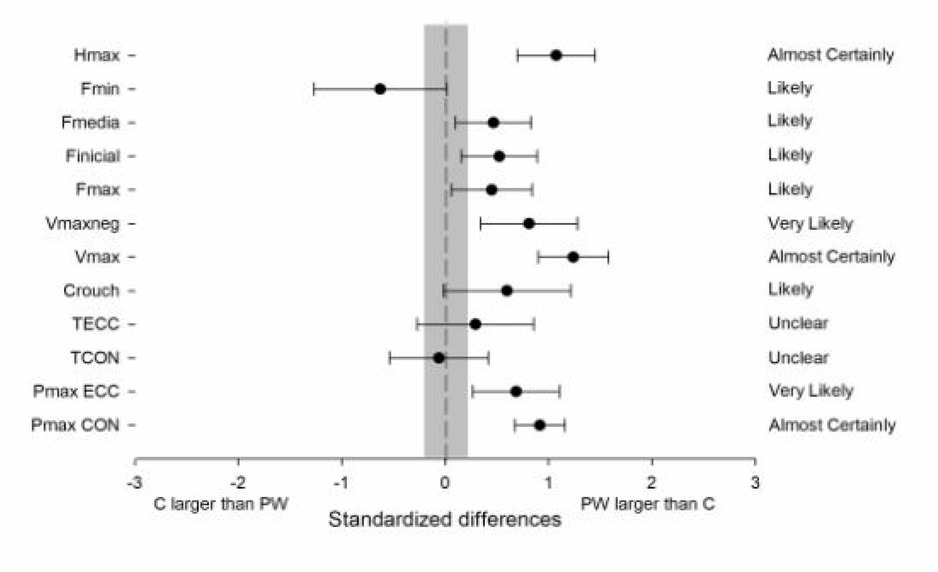
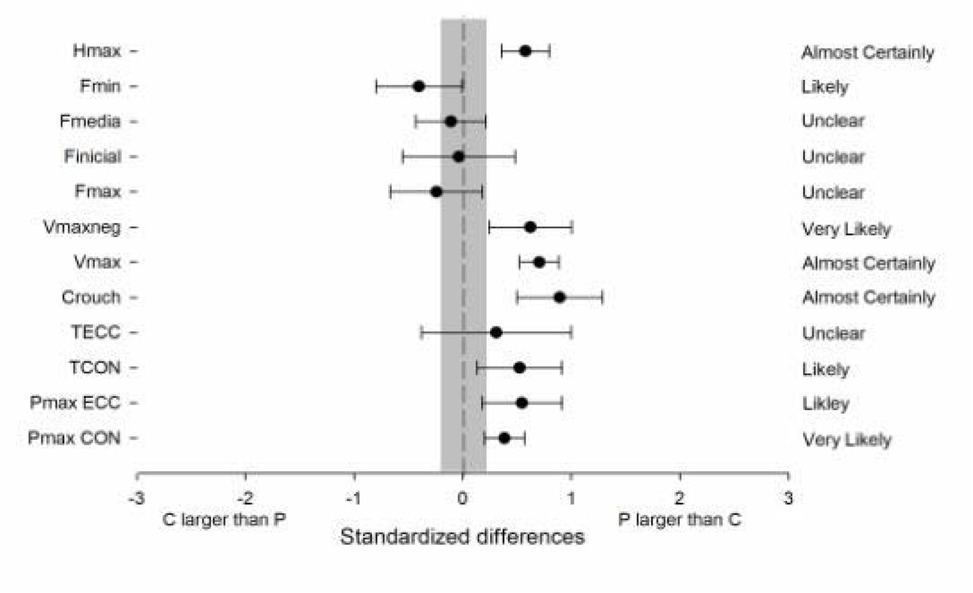
Between-Group Changes. Results from the between-group comparison are illustrated in Figures 1, 2, and 3. Following combined training, moderate ES changes in jump height and force applied variables (except minimum force) were substantially greater than when following plyometric training. In addition, a substantial small ES was also noted in the peak concentric power. The combined group showed a moderate ES decrease in the duration of the upward movement phase in comparison with the plyometric group after the training intervention. When the combined group was compared with the control group, a moderate ES substantial increase was noted in all variables except the duration of the downward and upward movement phases. The difference between the plyometric and the control group showed moderate ES substantial increases in jump height, power, velocities and displacement of the center of mass variables for the plyometric group. In addition, a substantial moderate ES decrease was observed in the minimum force and in the duration of the upward movement phase, however, peak, average, and force at the crouch position changes between these groups remained unchanged.
Discussion
Countermovement jump performance improved after combined and plyometric training in comparison with the control group in trained female basketball players after a short-term (i.e., 12 sessions) training intervention. However, the time histories of biomechanical variables were different depending on the training method used.
The results showed that in-season combined training improved jump performance in competitive female basketball players. Previous studies have shown that this type of training enhances vertical jump performance, although there is a lack of information about the biomechanical mechanism that produces this improvement (Perez-Gomez and Calbet, 2013). Earlier investigations have found increases in variables related to force application after a training intervention involving a back squat or a loaded jump (Cormie et al., 2010a, 2010b, 2010c). In contrast, this study reported no change in force variables at the end of training. This discrepancy in results could be related to the increase in the depth of countermovement observed in our study after training. It is known that deeper countermovement jumps result in lower forces than shallower countermovement jumps (Kirby et al., 2011; Salles et al., 2011). For this reason, maintaining similar values in force variables with a deeper crouch position could enhance the impulse by increasing the time over which the force is applied and may increase the jump height. In accordance with other studies, the vertical velocities of the center of mass and the power outcomes during the downward and upward phase increased after the training period (Cormie et al., 2010a, 2010b, 2010c). Due to the positive relationship between downward velocity and jump height (González-Badillo and Marques, 2010), the downward velocity of the center of mass could be considered an important variable in order to explain the jump height improvements. In contrast to this study, Arabatzi et al. (2010) did not observe an increase in peak power variables after combined training. These contradictory findings could be due to differences in the exercise types and intensities used between the two studies (Arabatzi et al., 2010). Further studies are needed to clarify the effects of different types of exercise and intensities on biomechanical variables during a countermovement jump.
Similarly to combined training, the in-season plyometric training program was able to improve jump height achieved by competitive female basketball players after 6 weeks of intervention. Increases in jump performance after plyometric training were accompanied by moderate decreases in the applied force values. These outcomes contrast with previous studies which reported increments in jump height along with increases in force applied (Cormie et al., 2010a, 2010b, 2010c). Decreases in force variables were accompanied by increases in the displacement and velocity of the center of mass. A previous study observed decreases in force applied values and increases in the center of mass displacement when unresisted training was performed (Markovic et al., 2013). This suggests that training without resistance produces improvements in vertical velocity and displacement of the center of mass variables instead of force application variables in jump performance. However, further investigation is needed to clarify the effect of plyometric training on the biomechanics of vertical jump performance. Measures of power during the jump in this investigation remained unchanged after training due to the decreases of force applied and increases in the center of mass velocity. These results showed a trend similar to previous investigations which observed no changes in peak power with different jump heights (Salles et al., 2011). Due to the relationship between downward and upward movement velocity of the center of mass established in previous studies (González-Badillo and Marques, 2010) and the results of the current investigation, it appears that variables related to the velocity of the center of mass could be more important than power variables in explaining changes in jump performance.
Both plyometric and combined training groups increased their jump performance, although combined training led to substantially higher values than plyometric training. These results are consistent with the hypothesis that combined training further improves jump performance compared to plyometric training (Perez-Gomez and Calbet, 2013). The results of the present investigation suggest that combined training enhances the skill of maintaining higher forces when the displacement and velocity of the center of mass are increased. The plyometric group modified the vertical velocity and displacement of the center of mass, but a substantial decrease in force variables occurred. The outcomes of this investigation showed that different training methods produce different effects on the biomechanical variables of the vertical jump. This information would allow coaches as well as strength and conditioning professionals to optimize their training methods to each athlete. In that sense, combined training could provide a more complete training effect than plyometric training because each biomechanical variable showed increases after the training intervention in the countermovement jump. In addition, in team sports the ability to jump higher in less time is a significant advantage and the plyometric group requires a higher amount of time to acquire a lower jump height (Domire and Challis, 2015).
Conclusion
Combined and plyometric training improved jump height, but the increments in jump performance were higher when combined training was used. Both training methods modify biomechanical variables related to vertical velocity and displacement of the center of mass, although combined training maintains higher force values while plyometric training decreases them. These results suggest that combined training could provide more effective outcomes to improve jumping ability.