Introduction
Wearable sensors are routinely used to track the movements of athletes during training and competition (Cummins et al., 2013; Mallo et al., 2015). Team sports use micro-technology, containing both micro-electromechanical systems (MEMSs) and global positioning systems (GPSs), worn in a vest between the player’s scapulae to track athletes’ gross movements (Barrett et al., 2016). Using GPSs, time motion analysis data, such as total distance covered, distance in selected velocity zones, accelerations and decelerations are often reported to describe the external load of training or competition (Cummins et al., 2013). While most micro-technology devices used in team sports contain MEMSs, output from these sensors provides segregated performance variables and does not contribute to the calculation of velocity-based metrics (Malone et al., 2017).
The validity and reliability of a number of commercially available systems in measuring velocity-based metrics have been described (Akenhead et al., 2014; Buchheit et al., 2014; Coutts and Duffield, 2010; Varley et al., 2012), thus providing an understanding of the application and limitations of GPSs in a team sports context. A common limitation among these studies has been the validity and reliability of GPS devices to measure high- and variable-velocity movements in smaller areas. Notably, the accuracy of rapid accelerations (> 3 m/s2) is consistently compromised when using GPS devices of varying specifications (Akenhead et al., 2014; Buchheit et al., 2014). Low sampling rates (Varley et al., 2012), the positioning of the device (Barrett et al., 2014, 2016), quality of the satellite signal (Karaim and Aboelmagd, 2018) and inconsistencies within the data processing (Buchheit et al., 2014; Varley et al., 2017), have been suggested to contribute to the error of GPS devices.
GPS devices typically underestimate criterion measures of mean velocity or distance (Duffield et al., 2010; Vickery et al., 2014), but possess generally acceptable internal consistency, such that typical changes in performance can be identified. However, coefficients of variation (CV) ranging between 20-78% have been reported for the inter-unit reliability (i.e. agreement between two devices) of the same manufacturer and model (Coutts and Duffield, 2010; Thornton et al., 2019). As a result, individual assignment of devices among a squad of players has been recommended, as well as limiting between-player comparisons.
Alternative measurement methods are capable of tracking identical velocity-based metrics in a team sports context, yet adopt a different technological approach. Inertial measurement units (IMUs) provide one example and can be fitted about the person to monitor performance (van der Kruk and Reijne, 2018). Wearable IMUs comprise accelerometers, gyroscopes and can include a magnetometer. Measurements of raw acceleration and angular velocity are recorded during movement to detect temporal gait events on a stride-by-stride basis (Yang et al., 2011). Integration of these data can determine velocity and orientation of various body parts, respectively, depending on the selected anatomical placement of the IMU, without the requirement of the GPS. IMUs are commonly fitted to the lower-limbs (shank or foot) for the purposes of gait analysis, with early attempts to validate linear horizontal velocity reporting errors between ~ 2 and ~ 5% (Hausswirth et al., 2009; Yang et al., 2011). However, most IMUs have not been specifically designed to quantify movements observed among team sports players during training or competition. Given the acceptable criterion validity of existing IMUs (Roell et al., 2018), this limitation could be overcome by a foot-mounted unit, assuming the underlying algorithms are suitably designed to accommodate the complexity of team sports movements and potential drift errors (Takeda et al., 2014).
It is somewhat surprising that integrated IMUs are not more frequently used for measuring velocity-based metrics in team sports, since they can be used in- or outdoors and have fewer potential sources of measurement error (van der Kruk and Reijne, 2018). However, the positioning of GPS-micro-technology devices between the scapulae limits the scope of IMU output, whereas foot-mounted IMUs are capable of recording the inertial motion and 3D orientation of individual limbs or limb segments with high accuracy (O'Reilly et al., 2018). For example, Zaferiou et al. (2017) identified individual gait characteristics, such as horizontal ground reaction, foot trajectories and footfall duration, alongside horizontal velocity, of high- and low-level performers during running agility tasks using IMUs fixed to the dorsal aspects of both feet. While such detailed analyses would be useful in a team sports context, the capacity of foot-worn IMUs to reliably measure the velocity of players during team sports movements is unknown. Furthermore, to date, there has been no direct comparison of foot-mounted, sports-specific IMUs to the most commonly adopted form of velocity measurement (GPS-micro-technology), while performing movement patterns that simulate the demands of a particular team sport. Thus, the primary aim of this study was to compare two methods of velocity measurement; a foot-mounted IMU that has been specifically developed for soccer performance (PlayerMaker™) to three commercially available GPS devices for the measurement of horizontal velocity during team sport movements. The second aim was to evaluate the inter-unit reliability of the PlayerMaker™ system.
Methods
Design
Participants visited the testing facility twice. After initial familiarisation (visit 1) to the protocol and the instrumentation, participants came to the research facility on a separate day to perform 5-min and 20-s of a soccer-specific, multi-directional intermittent movement protocol (SAFT90; Barrett et al., 2013). Participants were fitted with a foot-worn IMU (PlayerMaker™) and three separate GPS devices, which are most commonly used in elite team sports, but were anonymised for the current article. GPS#1 sampled at 18 Hz, GPS#2 and GPS#3 sampled at 10 Hz. Fitting of the IMU (PlayerMaker™) and the three GPS devices facilitated a method comparison of velocity-based performance metrics.
Participants
Twelve elite League 1 academy-level soccer players (age 15 ± 3, range 11-18 years; body mass 54.5 ± 14.9 kg) provided written informed consent and, where necessary, parental assent to participate in this study. Institutional ethical approval was provided for this study (SMEC_2018-19_015). Participants were informed of the benefits and risks of the investigation prior to signing the institutionally approved informed consent document to participate in the study
Procedures
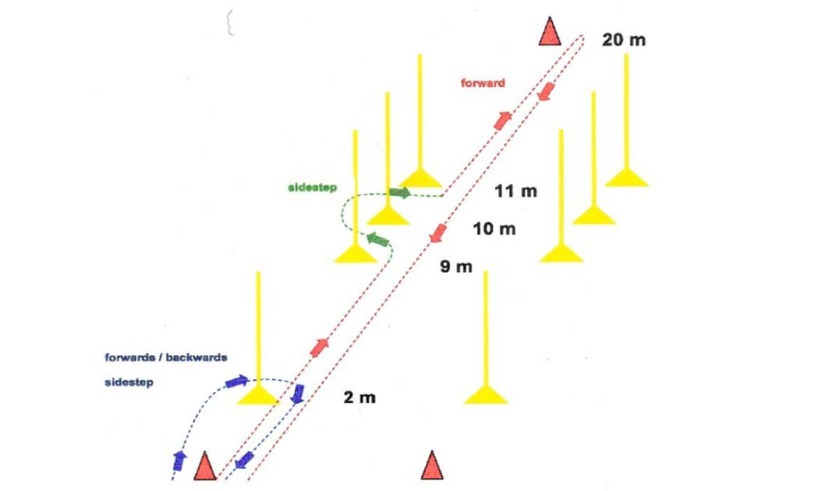
The SAFT90 was designed to replicate the movement demands of English Championship-level soccer, based on time-motion analysis of match play, dictating the actions and pace of the movement via pre-recorded audio instructions. The SAFT90 course is 20 m in length, comprising varying intensity (stand, walk, jog, stride and sprint) and multi-directional actions (forward, backward and sideward locomotion) (Figure 1). The participants’ intended route through the cone-marked course is described in Figure 1, totalling a distance of 484 m. However, given the deviation from the intended route of all participants while completing the course, this was not used to determine criterion distance. Participants were instructed to follow the audio cues in the same way as their familiarisation trials and ensure maximal effort during the sprint sections. All trials were performed on a flat, well-groomed, real grass pitch, under fair weather conditions, with participants wearing studded soccer boots and a standardized training kit issued by the soccer team. Testing was performed on the middle of the pitch to minimise the effects of the local built environment on GPS signal quality.
Instrumentation and data collection
The same three GPS devices where tightly fitted to each participant using custom-designed neoprene vests, placing the units 2.5 cm apart, in parallel between the scapulae (Thornton et al., 2019). The GPS devices were kept in the same position on each participant for all trials (Left unit - GPS#2; Central unit - GPS#3; Right Unit - GPS#1). All GPS devices were activated 20-min prior to testing to ensure that the maximal number of satellite connections were established. There was an acceptable number of identified satellites and horizontal dilution of precision for GPS#3 (10 ± 2 and 0.8 ± 0.1, respectively), GPS#2 (16 ± 1 and 0.7 ± 0.1, respectively) and GPS#1 (13 ± 2 and 0.4 ± 0.1, respectively). Participants were instructed to stand motionless prior to each trial to assist with data synchronisation. All devices were synchronized post-hoc using local time, as measured on board the GPS devices. While this was typically sufficient, the raw velocity traces were visually checked to verify temporal similarity, using the continuous acceleration from quiet standing as an indication of the initiating movement. All data were uploaded to each manufacturer’s software package and ‘raw’ (unfiltered 10 Hz) velocity traces were extracted into Microsoft Excel 2016 (Microsoft Inc. WA, US.). These data were subsequently interpolated and filtered (see data analysis).
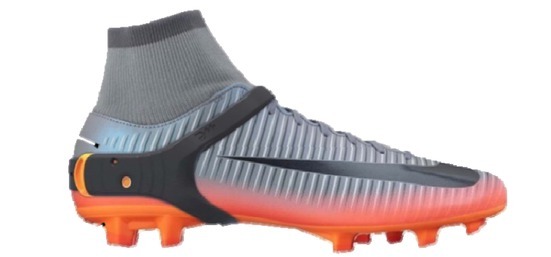
Participants were simultaneously fitted with a PlayerMaker™ system, which is a footwear sensor unit, housed within custom silicone straps, securely fixed over each football boot, sitting on the lateral aspect of the calcanei (Figure 2). The PlayerMaker™ was activated 10 min prior to the session and required no calibration by the user prior to data collection. Participants were instructed to stand motionless prior to each trial to assist with data synchronisation. The PlayerMaker™ sensor is an IMU, comprising a 3-axis 16 g accelerometer and 3-axis gyroscope (MPU-9150, InvenSense, California, USA) for measurement of accelerations and angular velocity of each foot during gait, respectively.
Figure 2
The PlayerMaker™ system fitted to the ankle of the right foot. The complete system includes an identically sized and fitted inertial measurement unit for the left ankle.
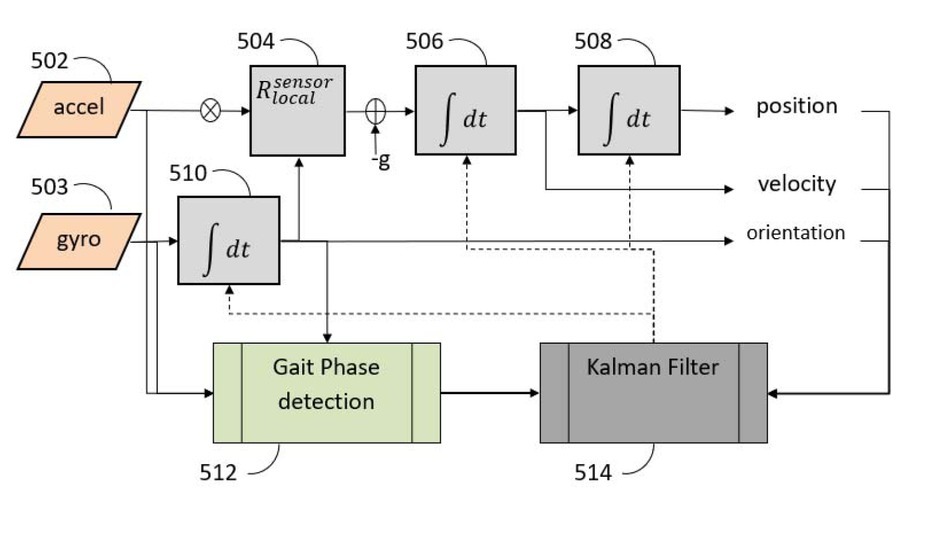
The PlayerMaker™ system calculates whole-body velocity-based metrics using data generated by the on-board MEMS, which utilizes a combination of proprietary gait tracking and foot-based event detection algorithms. In brief, the soccer-specific gait tracking algorithm permits detection of the orientation and translation of the participants‘ limbs during gait cycles, while the event detection algorithm identifies key events during gait (heel strike, toe-off, zero-velocity, zero height, non-gait pattern). The microprocessor receives accelerometer and gyroscope data, from which orientation, velocity and position vectors are determined utilizing a Kalman Filter together with gait events update (Figure 3). The resulting output can provide a number of metrics germane to soccer performance; however, velocity profiles were extracted for comparison to the GPS devices.
Figure 3
PlayerMaker™ gait tracking flowchart. 502 - accelerometer, 503 - gyroscope, 504 – "R" rotation matrix (sensor relative to local frame), 506, 508, 510 – numeric integration of raw inputs, 512 - proprietery machine learning for gait phase detection, 514 - proprietary Kalman Filter design to calculate position, velocity and orientation. "+" sign indicates a sum, the "X" indicates a cross product. The rotation matrix transforms the accelerations from the sensor frame to the local frame.
At block 502, the processor receives sensor data from the accelerometer. At block 503, the processor receives the sensor data from the gyroscope. At block 504 the acceleration data rotated to the local frame and then subtracted by g on the local z-axis. At block 506, the processed acceleration data are integrated and the velocity vector is formed at block 508. The velocity is integrated and the position vector, along with the velocity vector, is used at block 514, with the Kalman Filter. At block 510 the gyroscope data are integrated for calculation of R (that is used in block 504) and for the detection of zero-velocity update and stance, along with the raw acceleration and gyroscope data, at block 512. (Solid lines = feedforward to gait phase detection or Kalman Filter; dashed lines = feedback)
Inter-unit reliability
In a sub-analysis, seven of the participants (age 15 ± 2 years; body mass 57.5 ± 12.5 kg) wore two PlayerMaker™ systems concurrently (two on each foot) during the completion of the SAFT90 to facilitate inter-unit reliability analysis. The units were fitted adjacent to one another on the lateral aspect of the calcaneus. The same two units were worn throughout the study.
Data analysis
Raw velocity files were downloaded and exported to Microsoft Excel 2016 (Microsoft Inc. WA, US) for further analysis. All velocity traces were interpolated to 25 Hz signals to facilitate temporal comparisons and to remove sampling frequency differences between the devices. 25 Hz represents the down-graded sampling rate of the PlayerMaker™ from 1000 Hz and was deemed a suitable frequency for comparative purposes, owing to the typical centre of mass (COM) movement frequency during human locomotion ~ 10 Hz (Welk, 2002) and the minimum sampling rate determined by the Nyquist principle. Given the reported differences in output between software-derived and raw GPS velocity traces (Thornton et al., 2019), GPS raw data from GPS#2 and GPS#1 devices were identically filtered using a zero-lag exponential filter (Malone et al., 2017; Varley et al., 2017). The GPS#3 uses a median filter (personal communication) for velocity data, which we chose to maintain as this represents the output of the device in practice. The PlayerMaker™ data were down sampled from its origin of 1000 Hz to 25 Hz using a zero-lag Butterworth filter.
A total of 19 different time motion analysis variables were selected for analysis during the SAFT90, based on those typically reported to describe soccer performance (Vigh-Larsen et al., 2018; Waldron and Murphy, 2013): total distance (m); mean velocity (m/s); peak velocity (m/s); distance < 1.5 m/s (m); distance 1.5-3.5 m/s (m); distance 3.51-5.5 m/s (m); distance > 5.5 m/s (m); peak acceleration (m/s2); peak deceleration (m/s2); acceleration count < 1.5 m/s2; acceleration count 1.5-3.5 m/s2; acceleration count > 3.5 m/s2; deceleration count < -1.5 m/s2; deceleration count -1.5 - -3.5 m/s2; acceleration count < -3.5 m/s2; mean acceleration distance (m); total acceleration distance (m); mean deceleration distance (m); total deceleration distance (m). The period selected for acceleration or deceleration measurements was 0.3 s (Malone et al., 2017; Varley et al., 2017), with minor accelerations (< 0.02 m/s2) removed to reduce low-intensity acceleration or deceleration counts. Peak velocity was averaged over the fastest 0.3-s period during the SAFT90.
Statistical analysis
Systematic biases between the PlayerMaker™ system and each of the three GPS devices were performed for all time motion analysis variables using paired t-tests (Atkinson and Nevill, 1998), with statistical significance accepted at p < 0.05, with post-hoc Bonferroni adjustments. No statistical comparisons of GPS devices were necessary to conduct. The 95% Limits of Agreement (95% LoA) were used to identify the degree of systematic bias and random error (SD of the between system differences 1.96) (Atkinson and Nevill, 1998) between the PlayerMaker™ system and each of the three GPS devices. Reference to ‘total error’ hereafter refers to the sum of systematic and random error. The recommended checks for heteroscedasticity (Atkinson and Nevill, 1998) were performed on the data generated during the SAFT90, with no significant relationships found (p > 0.05). All statistical comparisons were performed in IBM SPSS (Software V24.0, IBM, NY, USA), with statistical significance accepted at p < 0.05.
Results
PlayerMaker™ to GPS comparison during the Saft90 protocol
As presented in Tables 1 & 2 and Figure 4, there were differences (p < 0.05) between most PlayerMaker™ and GPS variables during the SAFT90. However, there were no differences (p > 0.05) for peak velocity comparisons, distance > 5.5 m/s between the GPS#1, GPS#3 and PlayerMaker. The PlayerMaker™ consistently recorded greater (p < 0.05) total distances compared to all GPS devices (mean range = 17 - 32 m underestimation), as well as greater distance covered between 1.5-3.5 m/s (mean range = 20 – 32 m underestimation) and 3.51-5.5 m/s (mean range = 22 – 30 m underestimation). The distance covered between 3.51-5.5 m/s produced the widest LoA with the GPS#1 device (total error of ~ 60 m). For total distance, the total error between the GPS devices and the PlayerMaker™ ranged from ~ 25 to 50 m.
Figure 4
Distance covered in velocity zones of the PlayerMaker™ and three Global Positioning System (GPS) devices. * = significantly (p < 0.05) different to all GPS devices. ƚ = significantly (p < 0.05) different to PlayerMaker™.
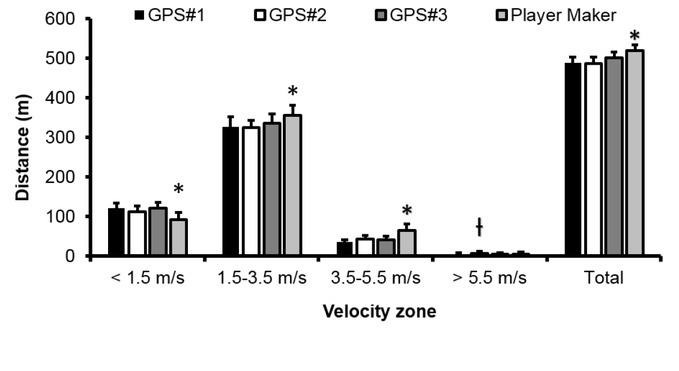
Table 1
Mean differences and 95% Limits of Agreement (95% LoA) for time motion analysis variables between the PlayerMaker™ (inertial measurement unit) and Global Positioning System #1 and #2 (GPS) devices during the SAFT90 protocol.
Table 2
Mean differences and 95% Limits of Agreement (95% LoA) for time motion analysis variables within the PlayerMaker™ (inertial measurement unit) and compared to Global Positioning System #3 (GPS) device during the SAFT90 protocol.
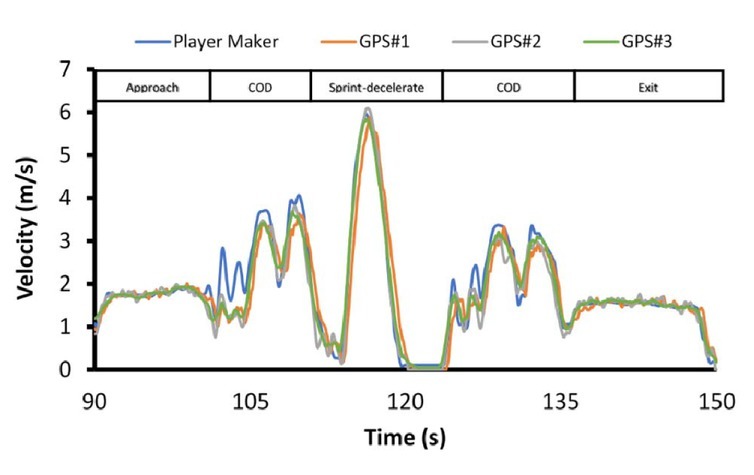
Similarly, peak accelerations (mean range = 0.3 – 1.75 m/s2 underestimation) and decelerations (mean range = 0.6 – 1.56 m/s2 underestimation) were of smaller magnitude when measured by GPS devices compared to PlayerMaker™. This translated to a total error of up to ~ 3.1 m/s2 between the PlayerMaker™ and the GPS devices (Tables 1 & 2). However, the differences (mean systematic biases) were not all in the same direction, with the GPS devices all registering a higher number of lowest intensity (< 1.5 m/s2) accelerations (mean range = 29-130 overestimation) and decelerations (mean range = 111 and 195 overestimation for GPS#3 and GPS#1, respectively). This trend was reversed for higher intensity accelerations. Total acceleration distance was higher for all of the GPS devices (p < 0.05; range = 8 – 12 m), but mean acceleration distance was higher for the PlayerMaker™ (p < 0.05; range = 0.02 – 0.08 m). Total deceleration (p < 0.05; range = 9 – 20 m) and mean deceleration (p < 0.05; range = 0.02 – 0.17 m) distance was lower when measured by all GPS devices. Figure 5 shows the velocity profile of a representative participant during a 60-s segment of the SAFT90 to highlight the above differences.
PlayerMaker™ inter-unit reliability during the Saft90 protocol
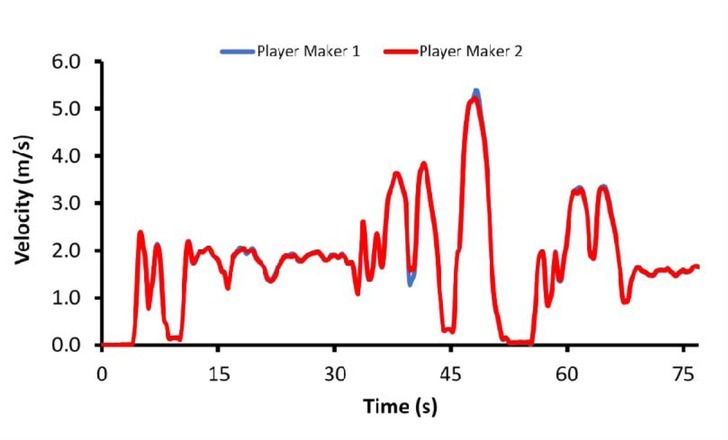
As presented in Tables 1 & 2, the PlayerMaker™ system was not systematically different to its comparative unit for any variable (p > 0.05) during the SAFT90. The 95% LoA revealed that the low-intensity (< 1.5 m/s2) acceleration and deceleration counts were least reliable, with random variation of ± 21 and ± 16. The random error of total distance between the two PlayerMaker™ systems was ± 1.28 m during the total 5-min, 20-s SAFT90 protocol. Figure 6 shows the velocity traces of two PlayerMaker™ representative systems during a 75-s segment of the SAFT90.
Discussion
The first aim of this study was to compare the PlayerMaker™ system to three commercially available GPS devices for the measurement of velocity-based metrics during team sports movements. We found a number of differences between methods, with measurements such as total distance covered and distance in three velocity zones higher in the PlayerMaker™ system. These differences were accompanied by larger peak accelerations and peak decelerations, as well as a higher number of high-intensity velocity changes, measured by the PlayerMaker™. The GPS devices tended to measure a larger number of low-intensity accelerations and decelerations (particularly the GPS#1 and GPS#3 devices), leading to larger total acceleration distances, yet lower mean acceleration and deceleration distances. Despite mean velocity discrepancies during the SAFT90, there were no differences in peak velocity between all devices. It would appear that the change in method (technological and anatomical differences) leads to differences in the quantification of time-motion analysis data during intermittent team sports activity, with the IMU generally recording higher distances, velocities and velocity changes compared to the GPS devices. These differences were not apparent when the PlayerMaker™ system’s inter-unit reliability was assessed, demonstrating the consistency of these devices for measuring team sports movement patterns.
GPS devices have a number of well-documented error sources, including orbital error, satellite clock error, ionospheric error, tropospheric error and multipath and receiver noise (Karaim and Aboelmagd, 2018). The accumulation of these errors, mixed with limited raw data sampling frequency, has led to underestimation of criterion velocity and distance covered by ~ 10-30% (Duffield et al., 2010; Vickery et al., 2014). Whist we did not have a reference system in the current study, it is worth recognising that the GPS devices also recorded lower values for a number of velocity-based metrics compared to the PlayerMaker™ system. Spatio-temporal gait characteristics measured by more rudimentary IMUs typically compare closely to gold-standard 3D camera systems (Kluge et al., 2017), providing further confidence that the MEMS included in the PlayerMaker™ are less susceptible to technical error. However, the complexity of velocity measurement during team sports movements provides additional challenges to the calculation of whole-body velocity when using IMUs. Indeed, while IMUs do not have any of the same limitations as GPS devices, a problem often experienced is so-called ‘drift error’. Here, IMUs fitted to lower-limbs can measure velocity of body segments by integration of raw acceleration; however, this leads to cumulative signal errors across time (i.e. drift). The PlayerMaker™ system corrects for these errors using a Kalman Filter, whereby zero-velocity updates are used to calibrate the sensors. While these approaches are well-known for simple locomotive patterns, such as linear walking or running (Takeda et al., 2014), they are insufficient for estimating velocity when gait patterns are more complex. The PlayerMaker™ uses advanced gait phase detection for soccer-specific movement, based on a custom-built machine learning algorithm. The advanced gait phase detection process detects the zero-velocity phases more efficiently and, in addition, detects zero-height phases, which usually occur during the stance phase of gait. The aforementioned detections are used as input to the Kalman Filter and affect the position and velocity estimation, thus controlling drift errors. These processes reduce the error of the system and assist with the accuracy of the PlayerMaker™.
There are obvious differences in the technology and algorithmic approaches used to calculate velocity between GPS and IMUs, which provide some explanation for the differences observed in the current study. However, it is noteworthy that the anatomical placement of the devices is markedly different and will influence the data generated during team sports movement patterns (Barrett et al., 2014, 2016). Measurement of the COM (or spinal alignment thereof) does not reflect the entire movement of the lower limbs, leading to discrepancies in movement detection between lower limbs and the COM during soccer specific activities (Barrett et al., 2016; Nedelec et al., 2014). The larger difference of the PlayerMaker™ to the 484 m ‘intended route’ perhaps demonstrates this, where the players’ foot placement will inevitably deviate from the body’s centre line and cover greater distances.
The ability to monitor team sport activities using the GPS or IMUs has been historically difficult, due to the random, intermittent and multi-directional nature of movements. Short, rapid and forceful movements are necessary to efficiently increase or decrease velocity while completing complex movement patterns, typically resulting in greater horizontal displacement of the ground contact points (i.e. the feet) relative to the COM (Morrison et al., 2015). Based on this reasoning, the GPS unit placed between the scapulae and the foot-mounted sensors will follow separate paths during team sports running patterns. Furthermore, the PlayerMaker™ system is placed on two anatomical landmarks and must approximate horizontal velocity across both limbs. Given the complex nature of movements required to perform the SAFT90, it is assumed that the PlayerMaker™ measures a number of minor foot displacements, which would not register as clearly via a single unit placed between the scapulae. This is, perhaps, more likely among well-trained athletes, who typically attempt to maintain a narrower base of support and reduce turning arcs during change of direction tasks, resulting in less displacement of the upper trunk, in favour of higher frequency ground contacts (Zaferiou et al., 2017). This anatomical placement is important to the results of the current study and, alongside the higher sensitivity of the PlayerMaker™, is likely to explain much of the variation between systems.
Based on the above reasons, the PlayerMaker™ system quantifies rapid changes in velocity during soccer-based movements that will be unregistered by GPS devices, owing to a change in the method of measurement (i.e. technology and anatomical placement). The change in method leads to greater distances being reported, particularly in higher velocity zones, alongside larger mean acceleration or deceleration distances. The higher acceleration distance measured by all GPS units is explained by higher frequency of very low-intensity accelerations and might reflect the inability of the GPS signal to register higher-intensity velocity changes compared to IMUs. This is more likely because, unlike the GPS-velocity, the PlayerMaker™ system is not limited by a sampling rate, with a raw sampling rate of 1000 Hz. Thus, fast directional change with high foot cadence can be readily tracked. These findings are of critical importance to soccer practitioners, as high-intensity actions are associated with elite soccer performance levels (Waldron and Murphy, 2013) and differentiate between positions (Vigh-Larsen et al., 2018). Moreover, the PlayerMaker™ registered greater deceleration distances and high-intensity counts, which is consistent with the poorer validity of 10 Hz GPS devices in measuring decelerations (11.3% CV), which are typically of larger magnitude compared to accelerations (Varley et al., 2012). This is important, since decelerations are associated with increased muscle soreness and impaired neuromuscular function following soccer matches (Nedelec et al., 2014) and, therefore, require accurate quantification.
Among all of these measures, there were no systematic inter-unit differences for the PlayerMaker™ and the largest 95% LoA for distance covered being ~ 4.5 m (Table 2) across all velocity zones. Small total errors in distance travelled would permit detection of a number of differences, including differences in match-running performance of elite and sub-elite soccer players (Waldron and Murphy, 2013). There was, however, a larger random variation for total acceleration distance (± 12.52 m; Table 2) between units, indicating slightly larger noise for this variable that might preclude detection of more refined signal changes. However, this random noise would still enable detection of changes in acceleration distance that might be important in practice. For example, acceleration distance changes by a total of ~ 50 m across intensity zones between the first and the second 15-min period of professional matches (Akenhead et al., 2014), which is much larger than the inherent noise. Similarly, despite the systematic differences between methods and total error of up to ~ 25 m (GPS#1, Table 1), this noise is still within a ~ 50 m signal change and would, therefore, not significantly alter the interpretation between methods. The disagreement between methods and random error within the PlayerMaker™ would not become more noticeable until smaller changes in acceleration distance, such as the 5-10 m declines between final match periods, are necessary to quantify (Akenhead et al., 2014). Of interest, the random error of deceleration distances was lower (~ 6 m; Table 2) for the PlayerMaker™, which we speculate might be related to the motion of the ankle during these movements compared to accelerations. This is beyond the scope of the current study, but is worthy of further investigation.
Soccer researchers and practitioners should, therefore, consider the current results in relation to their desired outcomes. That is, the PlayerMaker™ system is more consistent between units compared to previous GPS reports (Coutts and Duffield, 2010; Thornton et al., 2019) and will bias its measurement of whole-body velocity towards the movement of the lower-limbs. This is arguably of greater importance to soccer practitioners, since understanding of work done by the lower limbs during team sports movement patterns has been incorporated into recent mechanical energetic models (Gray et al., 2018) and it is lower-limb measures of muscle function that are often prioritised to determine exercise-induced fatigue in practice (McCall et al., 2015). Furthermore, foot mounted IMUs have the capacity to measure an array of mechanical loading/gait parameters, which have not been explored in the current study, but could be used by practitioners to assess performance, asymmetries and neuromuscular function of players during training or competition.
Conclusions
Soccer practitioners should be aware of the differences between these two distinctly different methods (GPS or foot-worn IMU) for the measurement of over-ground velocity. Distances covered in higher velocity zones, peak accelerations and decelerations and high-intensity velocity changes are higher when measured using foot-mounted IMUs (PlayerMaker™) compared to three commercially available GPS devices. Mean velocity, but not peak velocity, also differs between these two types of technology. Practitioners can, therefore, use foot-worn IMUs or GPS devices for tracking players during training and competition (depending on governing body regulations), but understand that movement of the lower-limbs during short and rapid changes will be directly incorporated into the PlayerMaker™ velocity measurement, while GPS velocity will be based on displacements of a single sensor placed superior to the COM. If it is desirable for practitioners to bias this measurement toward lower-limb movements, then the foot-worn system would be preferable. Those working with soccer players should also consider that the PlayerMaker™ has inter-unit reliability that would enable interchangeable interpretations for almost all time motion data. This would be useful for comparisons between players, without concern over noise emanating from technical errors. Further research on the PlayerMaker™ system to soccer performance will help understand its potential applications more thoroughly.