Introduction
The ability to accelerate, reverse or quickly and effectively change direction and re-accelerate is an important component of many open-skilled sports like team sports (Dos’Santos et al., 2018; Pereira et al., 2018). These kinds of sports are characterized by high-intensity unilateral actions such as jumping and changes of direction (COD) during scoring opportunities or offensive and defensive actions, thus having a big influence on match outcomes (Faude et al., 2012; Loturco et al., 2019). For this reason, practitioners and researchers are constantly looking for better and more effective methods to both improve and optimize an athletes’ acceleration and re-acceleration capability (Loturco et al., 2019).
Much of these high-intensity unilateral actions lead team sport athletes to develop asymmetric neuromuscular adaptations of the lower limbs (Bishop et al., 2019; Maloney et al., 2017). Although some authors suggest that asymmetries are a risk factor for injury, there are only few studies that have investigated the association between both factors (Fort-Vanmeerhaeghe et al., 2020; Read et al., 2018) or reinjury (Kyritsis et al., 2016; Paterno et al., 2010). This is especially relevant for female athletes, whose lower limb asymmetries in strength, coordination and postural control are more prevalent than males (Myer et al., 2011). Inter-limb asymmetries have been a common line of investigation in recent years. Lately, literature on this topic has highlighted the different nature of asymmetries as in terms of magnitude and direction across different tasks and skills (Bishop et al., 2018a, 2018b; Dos’Santos et al., 2017; Maloney et al., 2017; Maszczyk et al., 2018). In addition, other investigations have reported that asymmetries in force or power qualities in unilateral jumping may be detrimental to athletic performance (Arboix-Alió et al., 2020; Bell et al., 2014; Madruga-Parera et al., 2019). Although, this association remains unclear in COD skills (Dos’Santos et al., 2017; Lockie et al., 2014), it seems logical that in multidirectional sports, it would be advantageous to be equally proficient (balanced/symmetrical) and fast at changing direction from both limbs or directions, given the unpredictable nature of agility requirements (DosʼSantos et al., 2019). Furthermore, coaches, physical trainers and medical staff often promote the use of unilateral lower limb strengthening exercises in order to reduce muscle imbalances and to limit COD deficits between limbs (Rouissi et al., 2016; Stern at al., 2020).
In recent years, a new concept known as the “COD deficit” has been proposed as an appropriate method for assessing COD ability (Nimphius et al., 2016) in several team sports such as soccer (Loturco et al., 2018), handball (Madruga-Parera et al., 2019, 2020; Pereira et al., 2018), basketball (Thomas et al., 2018) or netball (DosʼSantos et al., 2019). In the COD deficit, the additional time required to perform a directional change when compared to the time needed to cover the same distance in a linear sprint is calculated (Nimphius, et al., 2016). Likewise, Freitas et al. (2018) describe the COD deficit as the difference in velocity between the linear sprint and a COD task of equal distance. Therefore, COD deficit time is proposed to be a more accurate indicator of an athlete’s true COD ability, allowing a more isolated measurement, being less influenced by the athlete's linear sprint velocity (Loturco et al., 2018; Nimphius et al., 2016).
Futhermore, COD deficit can also be used for calculating lower-limb neuromuscular asymmetries. However, and despite the current popularity of this concept (DosʼSantos et al., 2018; Lockie, 2017, 2018; Thomas et al., 2018), few studies have analyzed lower-limb asymmetries using this phenomenon. In this sense, DosʼSantos et al. (2019) reported greater percentage imbalances obtained with COD deficit values in comparison with total time (11.9% vs. 2.3%, respectively). Thus, with empirical studies surrounding the use of COD deficit to calculate lower limb asymmetry in young female athletes being scarce, further research in this area is warranted.
Therefore, the main purpose of this study was to assess the magnitude of neuromuscular asymmetries in an elite youth female team-sports sample, determine its directionality and how each asymmetry score favored the same side (i.e., left or right) in unilateral jump tests (vertical, horizontal and lateral) and the 180º COD test. Secondary objectives were to evaluate the relationship between COD deficit, linear speed and COD time performance. It was hypothesized that youth female players would show significant changes in both the magnitude and direction of asymmetry across the tests. Furthermore, they would show little relationship between linear sprint and COD outcomes.
Methods
This cross-sectional study attempted to determine the magnitude and direction of inter-limb asymmetry in young female elite basketball and handball players. Vertical, lateral and horizontal unilateral jumps, linear and change of direction sprints were assessed using a single leg vertical countermovement jump (SLCJ-V), a single leg horizontal countermovement jump (SLCJ-H), a single leg lateral countermovement jump (SLCJ-L), a 10 m sprint and a 180º COD speed test, respectively. All tests were performed in May 2019, at the first week of the end of the season.
Participants
Thirty-three young elite female basketball and handball players volunteered to participate in this study. Table 1 shows the participant characteristics including age, height, mass, BMI, playing experience and biological maturation. Biological maturation was calculated in a non-invasive manner using a regression equation comprising measures of: age, body mass, standing height, and sitting height (Mirwald et al., 2002). All of the participants were involved in a four-year talent development program at the time of the study. Routine training did not differ between groups and consisted of 7-10 sessions (90-120 minutes per week), of which 2-3 were dedicated towards structured strength and conditioning training. In addition, they played a competitive match at the weekends, totaling approximately 14-20 hours of combined training and competition, per week. Written informed consent was obtained from both participants and their parents or guardians and this study was approved by the Catalan Sport Council Ethics Committee.
Table 1
Participants’ characteristics by sport.
| Sport | n | Age (years) | Body height (cm) | Body mass (kg) | BMI (kg·m2) | Training experience (years) | Years post PHV * |
|---|---|---|---|---|---|---|---|
| Basketball | 21 | 16.19 ± 1.17 | 1.81 ± 0.08 | 73.81 ± 11.23 | 22.41 ± 2.27 | 8.86 ± 2.41 | 3.13 ± 1.19 |
| Handball | 12 | 15.67 ± 1.16 | 1.75 ± 0.62 | 64.32 ± 6.54 | 20.82 ± 1.21 | 9.17 ± 2.55 | 2.15 ± 2.44 |
| Total | 33 | 16 ± 1.17 | 1.79 ± 0.07 | 70.36 ± 10.72 | 21.83 ± 2.08 | 8.74 ± 2.55 | 2.81 ± 1.74 |
* estimation of biological age (Mirwald et al., 2002)
Design and Procedures
A week before data collection, participants were familiarized with the testing procedures enabling them to practice each test between 2-5 times. Prior to data collection, all participants performed a 10-min neuromuscular warm-up consisting of light jogging and dynamic stretches involving the lower body (e.g., multidirectional lunges, inchworms, bodyweight squats and pillar activation for the trunk). Following the warm-up, participants were reintroduced to testing procedures and were allowed up to three practice trials for each task. Data collection consisted of two valid trials per limb, as specified for each task. The order of the tests and the participants were randomized with the “true random number generator” program. Each trial was separated by a 60-s recovery period.
180º Change of Direction Speed Test
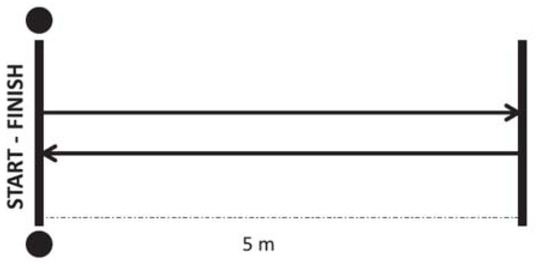
COD tests were performed with the players starting in a standing position, with their preferred foot forward and placed exactly 0.5 m behind the first timing gate. The COD tests consisted of a 10 m run which involved: a 5 m straight sprint, a turn of 180° before finishing with a final 5 m sprint. Research indicates that this test has good test-retest reliability (Castillo-Rodríguez et al., 2012). All COD tests were performed with the turns using both limbs. All sprint tests were repeated twice and the best result of each test was used for statistical analysis. One minute of recovery was allowed between each trial. Participants were given strong verbal encouragement throughout all trials to ensure maximal effort. A 10 m linear sprint test was also performed in order to calculate the COD deficit. This was done by subtracting the 10 m sprint time from the COD time in each direction and for each leg. To detect the beginning and the end of the test, electronic light gates (PME10D Velleman, Velleman, Inc., Gavere, Belgium) were connected to the Chronojump System 0.9.3 (Bosco System, Barcelona, Spain) and located 1.3 m from the ground level. This height has been previously recommended to avoid interference of the arm action in this type of measurements (Yeado et al., 1999).
Single Leg Counter Movement Jumps
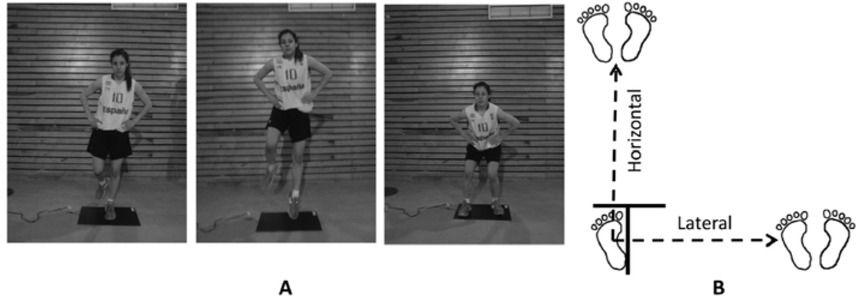
Participants carried out two successful trials on each leg in the vertical (SLCJ-V), horizontal (SLCJ-H), and lateral direction (SLCJ-L). Participants were instructed to stand on one leg, descend into a countermovement, and then rapidly extend the stance leg to jump as high or as far as possible in the designated direction (vertical, horizontal or lateral). They were also instructed to land on both feet simultaneously (Figure 2). A trial was considered successful if the hands remained on the hips throughout the movement and if balance was maintained for at least three seconds upon landing. The SLCJ-V distance in meters was calculated from flight time (Bosco et al., 1983) with a contact mat system (Chronojump Boscosystem, Barcelona, Spain). For this movement, the participant started with the foot of the selected leg on the contact mat. For the SLCJ-H and SLCJ-L, the participant started with the selected leg positioned just behind a starting line. Distances in meters were measured with a measuring tape fixed to the floor. These tasks have been shown to have good test-retest reliability (Hewit et al., 2012; Meylan et al., 2009).
10 m Linear Sprint
Sprint speed was assessed by a 10-m sprint test. The start and finish lines were clearly marked with cones. The front foot was placed 0.5 m before the first timing gate. Each player completed two sprints with a three-minute rest interval between each sprint. Total time for each sprint was recorded using electronic light gates (PME10D Velleman, Velleman, Inc., Gavere, Belgium) connected to the Chronojump System 0.9.3 (Chronojump Boscosystem, Barcelona, Spain). Gates were located at a height of 1.3 m from the ground and spaced by 1.5 m. This height is recommended to avoid interference of the arm action in this type of measurements (Yeado et al., 1999). The fastest time of the two sprints was used for further analysis.
Statistical Analysis
Statistical analyses were performed using SPSS (Version 20 for Windows; SPSS Inc., Chicago, IL, USA). Mean ± standard deviation (SD) were calculated for all variables. The Shapiro-Wilk test was used to determine the normality of the tested variables. In addition, within-session reliability of test measures was analyzed using a two-way random intraclass correlation coefficient (ICC) with an absolute agreement (95% confidence intervals) and the coefficient of variation (CV). Intraclass correlation coefficient (ICC) values were considered as > 0.9 = excellent, 0.75-0.9 = good, 0.5-0.75 = moderate, and < 0.5 = poor (Koo and Li, 2016) and CV values were considered acceptable if < 10% (Cormack et al., 2008).
Noting that asymmetries may favour either side depending on which limb scores more (Bishop et al., 2018a; Lake et al., 2018), a Kappa coefficient was calculated to determine how consistently asymmetries favoured the same side between tests. This method was chosen because the Kappa coefficient describes the proportion of agreement between two methods after any agreement may have occurred by chance (Cohen, 1960). Kappa values were interpreted following Viera and Garrett (2005), ≤ 0 = poor, 0.01-0.20 = slight, 0.21- 0.40 = fair, 0.41-0.60 = moderate, 0.610.80 = substantial, and 0.81-0.99 = almost perfect.
To identify the inter-limb asymmetry between limbs, the asymmetry index (ASI) was calculated using a Microsoft Excel data sheet with the following formula (Bishop et al., 2016; Carpes et al., 2010; Impellizzeri et al., 2007):
The highest performing limb (HPL) was defined as the side with the highest value of each task. Magnitude of differences between the HPL and the lowest performing limb (LPL) were assessed with paired sample t-tests. The magnitude of the difference were determined using Cohen’s d effect sizes (ES) (Cohen, 1988). Values were interpreted as < 0.20 = trivial; 0.20-0.60 = small; 0.61-1.20 = moderate; 1.21-2.0 = large and > 2.0 = very large following the suggestions from Hopkins et al. (2009).
The relationships between CODperformance, COD deficits and asymmetries were analyzed using Spearman’s correlations (ρ). Statistical significance was established at p ≤ 0.05. Results were considered trivial (0.00–0.09), small (0.10–0.29), moderate (0.30–0.49), large (0.50–0.69), very large (0.70–0.89), nearly perfect (0.90–0.99), and perfect (1.00) (Hopkins et al., 2009).
Results
Reliability
Descriptive statistics and reliability measures for SLCJ tests, the 10-m sprint, the COD test and COD deficit times are shown in Table 2. Almost all the tests showed excellent within-session ICC values (≥ 0.9) and had acceptable consistency with CV values < 10%.
Table 2
Descriptive statistics and reliability measures for 10-m sprint, SLCJ tests, COD test and COD deficit.
Comparisons between the Highest Performing Limb (HPL) and the Lowest Performing Limb (LPL)
Comparisons between the HPL and the LPL for each task are presented in Table 3. The results of the paired t-tests showed that there was a significant difference between the HPL and the LPL across all tasks (p < 0.001). The mean ASI values ranged from 1.69 to 9.79%. In addition, higher significant values of asymmetries were found for COD deficits (6.13 ± 4.83%) compared to COD test times (1.69 ± 1.35%; ES = 1.25).
Table 3
Highest Performing versus the Lowest Performing leg comparisons and ASI values for each test.
Kappa coefficients and descriptive agreement are presented in Table 4 and show that asymmetries rarely favoured the same side between tests (Kappa = -0.087 to 0.233), indicating different directionality between tests.
Table 4
Kappa coefficients comparing asymmetry side consistency between the COD test and jump height and distance in the single leg countermovement jump tests
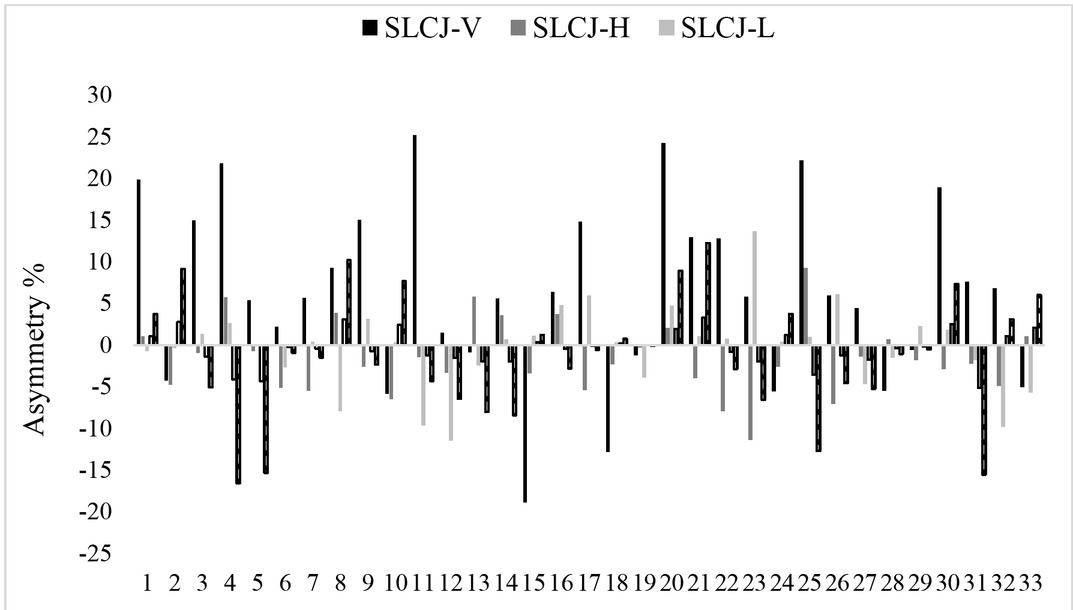
Figure 3 displays the individual asymmetries for the different tests with positive values indicating a right limb turning advantage and negative values indicating a left limb turning advantage.
Relationships between ASI and test scores
A correlation matrix comparing the ASI of each task was assessed. The only significant ASI correlation was unsurprisingly between COD speed and COD deficit (ρ = 0.983; p < 0.01).
Table 5 shows correlations between the results of the different tests. Results showed significant (p < 0.05) relationships between COD deficit and all the tests. Significant negative correlations with moderate to large magnitude of the correlation were present between COD deficit and unilateral jump tasks. Moreover, a significant correlation with very large magnitude was obtained between COD deficit and COD time. Finally, the 10-m sprint test did not correlate with any test.
Discussion
The present study aimed to determine the magnitude of asymmetries in SLCJ tests, COD performance and COD deficit in elite youth female team-sports sample and to evaluate the relationship between linear speed and COD time performance. The main findings were that when comparing the results of the HPL with those of the LPL, there were statistical differences in all the selected tests. Additionally, asymmetries rarely favoured the same side between tests. Furthermore, the secondary aim was to evaluate the relationship between COD deficit and tests’ performance, with results showing non-significant correlations between the linear sprint capacity and COD ability.
According to similar studies, we found significant differences between the HPL and the LPL, probably due to the sport-specific demands, such as unilateral jumping for basketball and handball players (Fort-Vanmeerhaeghe et al., 2016; Schiltz et al., 2009). Moreover, team sports players typically use one limb more frequently than the other, allowing for better coordination and leading to a greater strength capacity of the most commonly used limb (Stephens et al., 2007). In turn, this is likely to lead to the development of functional asymmetries (Fort-Vanmeerhaeghe et al., 2015).
In line with previous research (Bishop et al., 2016; Madruga-Parera et al., 2020), inter-limb asymmetry values differed between tests, showing that the asymmetry percentage may vary depending on the task used to quantify the imbalance. This finding indicates that it is important to obtain measurements on a variety of neuromuscular skills and not rely on any single test to quantify existing side-to-side differences. Interestingly, none of the tests exhibited an ASI greater than 10%. Previous research has suggested a 10-15% threshold of inter-limb asymmetry in strength and power to be considered as ‘normal physiological variability’ in team sports (Fort-Vanmeerhaeghe et al., 2015, 2016; Hewit et al., 2012). Although recent studies have shown the evolution of asymmetry values through the competitive season (Bishop et al., 2020a, 2020b), longitudinal research is still lacking to demonstrate the relationship between lower limb asymmetries and injury risk in healthy athletes. The SLCJ-V is likely the most sensitive task for detecting asymmetries between legs. The highest ASI mean value was obtained in this test (9.79%), which was higher in comparison with values obtained with the other jump tests (SLCJ-H = 3.63%; SLC-L = 334%). This value is similar (9.31%) to that reported by Fort-Vanmeerhaeghe et al. (2016), higher (6.30%) than the one presented by Sugiyama et al. (2014) and lower (12.26%) than the value obtained by Thomas et al. (2017). Furthermore, total time during the COD test was the least sensitive task for detecting asymmetries (1.69%), as reported by Arboix-Alió et al. (2020) and Fort-Vanmeerhaeghe et al. (2015) in previous studies (2.16% and 1.75%, respectively). Nevertheless, higher sensitivity has been reported in repeated CODs (3.39% and 2.12% for 90º and 180º, respectively) or overloaded CODs with an isoinercial device (approximately 10% for the lateral shuffle step and the crossover step) (Madruga-Parera et al., 2019).
The present study shows that COD deficit had significantly greater asymmetry values than COD test total time (6.13 ± 4.83% vs. 1.69 ± 1.35%). Previous research has shown similar findings (Dos’Santos et al., 2019; Madruga-Parera et al., 2019) and suggested that COD deficit may be better suited at detecting asymmetries (11.9 ± 12.8% vs. 2.3 ± 2.3%; and 5.48 ± 6.21% vs. 2.12 ± 2.5%; respectively). However, it is worth noting that asymmetry is somewhat ‘magnified’ when calculated from COD deficit, because the left and right values are now smaller (after the subtraction of the 10-m sprint time). This would explain the perfect Kappa coefficient value between COD and COD deficit asymmetry side consistency (Kappa =1) and the nearly perfect correlation between the respective ASI’s test (ρ = 0.983). Thus, practitioners should be aware that the elevated asymmetry values from COD deficit are not because it is a more sensitive metric than total time, but because the raw values prior to its calculation are smaller, resulting in a greater relative percentage difference. As such, it is suggested that COD deficit may not necessarily be a more appropriate measure of asymmetry, as previous studies have suggested (Dos’Santos et al., 2019; Madruga-Parera et al., 2019).
Asymmetries observed in the different functional tests also showed notable differences. This finding is in line with Fort-Vanmeerhaeghe et al. (2015) and Arboix-Alió et al. (2018) who did not find a relationship between the ASI values of different neuromuscular tests in basketball and roller hockey players, respectively. Moreover, in several players, the HPL differed between tests, showing the task-specific nature of both the direction of asymmetry and superior performance capabilities. The Kappa coefficient, which was calculated to know how frequently asymmetries favored the same side among different measurements, showed ‘poor’ to ‘fair’ levels of agreement for side consistency between tests (Kappa = -0.087 to 0.233). This is further supported in previous research from Madruga-Parera et al. (2020) who detected only ‘slight’ levels of agreement for side consistency between different jump tests (-0.05 to 0.15) or from Bishop et al. (2018a) who used the Kappa coefficient to report the side consistency of peak force asymmetries between the SLCMJ and SLBJ. Consequently, these results reinforce the changing pattern of asymmetry from test to test and highlights the need for a more individual approach to data analysis (Bishop et al., 2018a; Madruga-Parera et al., 2020). Similarly, player’s strength and conditioning training as well as rehabilitation programs should focus on evaluating and training different skills to control the asymmetries and, thus the potential associated injury risk (Fort-Vanmeerhaeghe et al., 2020).
Finally, non-significant relationships were found between the linear sprint and the other tests. This is in line with Little and Williams (2005) who found poor correlations between acceleration, maximum speed, and COD in soccer players. Likewise, Suarez-Arrones et al. (2020) revealed that linear sprinting and COD abilities were independent motor skills, recommending that both paradigms should be assessed independently. Thus, the results of the present study suggest that the COD ability has no significant relationship to linear sprinting ability and therefore, should be specifically trained to increase athletes’ efficiency during COD maneuvers (Freitas et al., 2019; Loturco et al., 2019, 2018).
The main limitation of the presentinvestigation was its cross-sectional nature which precluded the determination of any causal relationship between the different variables. In addition to this, only 180° COD was investigated in this study. COD deficit may be specific to the angle of the direction change (Nimphius et al., 2016). Further research is required quantifying COD deficit using different COD angles, such as 45°, 90° or 135°, and comparing asymmetries from different team-sports athletes and gender. Furthermore, it would be interesting to analyze the difference according to the athletes’ standard and their role in the game, because of the athlete’s physical and physiological characteristics as well as playing positions. Besides, the results of this research are only representative of the time the tests were carried out (end of the season) and, therefore, may fluctuate at different points throughout the season. For this reason, further research is needed to compare the magnitude and direction of asymmetry over a longer time period.
Moreover, this study also did not include technical analysis for COD ability, as all testing was field-based. Laboratory-based studies can provide more detailed technical information such as entry and exit velocities when athletes change direction (Sayers, 2015; Spiteri et al., 2013). Therefore, it would be interesting to carry out the technical or kinematic analysis that could help to assess the mechanical components of COD deficit in team-sport athletes and to better understand the reasons behind the COD deficit values that athletes obtain.
Conclusions
In conclusion, the current study indicates that young female players obtained significant differences between the HPL and the LPL in all neuromuscular tasks. Regarding COD ability, substantially greater asymmetries were observed for COD deficit compared to COD times. However, these differences could be attributed to the numbers being used during the subsequent calculation, rather than any one metric being ‘more sensitive’ than the other. The ASI values showed that the direction of imbalance was rarely the same between tasks. Furthermore, small and non-significant correlations were found between the linear sprint capacity and COD ability and suggest that each physical component should be assessed independently.