Introduction
The injury incidence in youth soccer has been proven to be high (Renshaw and Goodwin, 2016), which suggests the necessity to adopt specific interventions to deal with the increasing amount of injuries (Faude et al., 2013). Different warm-up training routines have been described and applied in varied populations of soccer players (Steffen et al., 2008). Among these, the FIFA 11+ program has been presented as a reference model effective to reduce the number of injuries in players above 14 years old (Bizzini and Dvorak, 2015). However, younger players can also be exposed to a high risk of sustaining injuries while playing soccer (Rössler et al., 2016), which suggests the importance of implementing injury prevention programs for players aged below 14 years old. Recently, the FIFA 11+ Kids program has been developed and applied in more than 4000 players aged between 7 and 12 years old, leading to a 50% reduction in the number of injuries in relation to control groups (Rössler and Faude, 2016).
Scientific research related to male players is abundant in the literature (Ekstrand et al., 2016), however, there are scarce investigations
which have examined the effectiveness of injury prevention strategies or physical training protocols in populations of young female participants. Female soccer is a physical demanding intermittent exercise with frequent periods of maximal intensity activities (Datson et al., 2014). It is in these intensive periods of the game when most of the injuries are sustained, during episodes that involve running, sprinting, changes of direction and/or kicking the ball (Grygorowicz et al., 2013). Complementarily, soccer players need a well-rounded athletic foundation to cope with the requirements of the game, combining different physical capacities such as muscular strength, explosive strength, balance or agility (Parsons et al., 2019). As the development of players is a long-term process, it is important to monitor the adaptations to the game demands at each critical stage in the life of youth players (Vescovi et al., 2011). In addition, the evaluation of the progress has to be age- and gender-specific, as it is impossible to extrapolate findings of the research based on top-class male players to populations of youth female players (Lesinski et al., 2017).
Therefore, it seems essential to investigate how training programs to enhance the physical performance of young female soccer players should be organized. Despite the importance that some physical capacities such as strength have when practicing a particular sports discipline, to our knowledge, very few studies have examined the effect which strength programs have on physical performance of female soccer players (Ramírez-Campillo et al., 2018) and how different strength exercises may influence performance variables (Contreras et al., 2017). The application of the FIFA 11+ prevention program has shown contradictory results on the improvement of performance capacities. On the one hand, Kilding et al. (2008) and Pardos-Mainer et al. (2019) reported increments in jumping abilities, dynamic balance and reductions in lower-limb asymmetries. On the other hand, Steffen et al. (2008) did not find performance effects after a ten-week intervention in youth female players.
As the improvement in lower-limb motor control is critical to develop complex movement patterns and technical skills (Oliver et al., 2013), players need to be adequately prepared to activate their sensorimotor system during the warm-up that precedes all training sessions and competitive matches. It would be expected that improving performance in selected neuromuscular variables could favor the acquisition of advanced coordinative and sport-specific skills, at the same time generating a protective effect on players, reducing the risk of sustaining non-contact injuries when playing the sport (Prien et al., 2017).
Thus, the aim of this study was to assess the effectiveness of a 12-week neuromuscular warm-up program on performance in selected strength, jumping and dynamic balance tests in youth female soccer players.
Methods
Participants
Forty-one female soccer players (age: 13.94 ± 0.82 years; body height: 158.19 ± 6.34 cm; body mass: 50.60 ± 7.73 kg; body mass index: 19.76 ± 4.04 kg·m-2) belonging to a Spanish First Division female soccer club academy squad participated in the study. Data collection took place during the second half of the 2016-2017 competitive season. All the players trained a minimum of two days (90 min per session) and played one match per week. Players were screened for injuries using a self-constructed questionnaire and the inclusion criterion to participate in the study was not to have any pathology or musculoskeletal injury which could affect performance in a direct way during the tests and training. In addition, participants had to attend to >85% of all training sessions to be included. Due to these requirements, 21 athletes remained in the Experimental Group (EG) and 17 athletes in the Control Group (CG) (Table 1). Participants and their tutors were informed about the purposes and objectives of the study, data confidentiality as well as the benefits and potential risks resulting from participation in the experiment. All the participants agreed to voluntarily take part in the study and signed an informed consent form before the beginning of the investigation, being allowed to change their decision or withdraw the consent at any time. The study was conformed to the recommendations of the Declaration of Helsinki and the protocol was approved by the Ethics Committee of Clinical Investigation from the Community of Madrid, according to the current legislation (Royal Decree 223/2004).
Design and Procedures
Using a controlled single-blinded randomized study design https://www.randomizer.org), players from both teams were divided into a CG and a neuromuscular training EG. Figure 1 presents the study design. The Consolidated Standards of Reports Trials (CONSORT) statement (http://www.consort-statement.org) (Schultz et al., 2010) was used as a framework. Before and after the training period, strength (back squat, hip thrust), unilateral and bilateral vertical jumping capacity, and dynamic balance were assessed in both groups. Players in the CG continued with their habitual warm-up routine before the training sessions which consisted of a 5-min cardiovascular exercise (i.e., running around the field), a 5-min dynamic mobility part (i.e., exercises in lanes) and very basic technical drills for another five minutes (i.e., passing the ball in pairs). During the same starting phase of the session, players in the EG carried out a 15-min neuromuscular activation program (Table 2). The protocol of the experimental group started with a 3-min low-intensity run followed by a 6-min block consisting of dynamic mobility, basic jumping and coordination drills using speed ladders, with the final six minutes focused on fundamental strength development exercises alternated with jumping and high-intensity running drills. The speed ladder drills included in the actual protocol have been described by Padrón-Cabo et al. (2020) and were frequently used in youth soccer training. The training intervention was 12-week long during which players carried out the program twice per week.
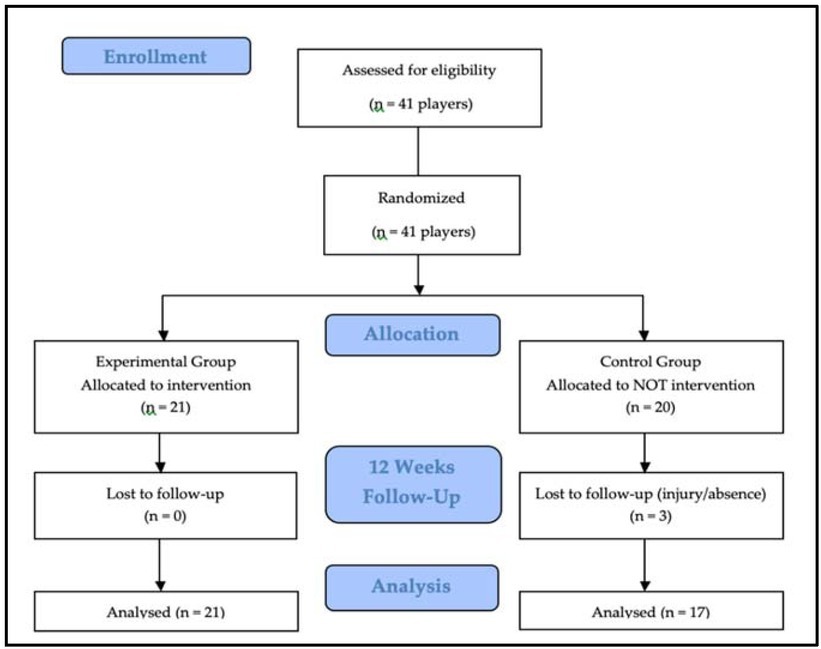
Table 2
Neuromuscular warm-up program during the experimental period.
Participants were familiarized with the testing procedure two weeks prior to the start of the study. All the tests were carried out in the same session, using an indoor facility, one week before and after the intervention period. Players wore athletic shoes during the strength and jumping tests, whereas they were barefoot for balance testing. All the tests were carried out >72 h after the last match or a hard physical training session.
All the players carried out the back squat (BS) and hip thrust (HT) tests to examine lower-body strength. The BS is a bi-lateral exercise where the load is directed along the vertical axis through a triple extension (hip-knee-ankle) moment. On the other hand, during the HT the load is directed along the anterior-posterior axis, using a bilateral hip extension moment starting from a bridge position. Both exercises can show an important transfer to team sports such as soccer, where it is necessary to apply vertical and horizontal forces during the game. During the BS, players started from a standing position, with the hips and knees fully extended, and a 10 kg barbell resting across the back at the level of the acromion which was held with a shoulder-width overhand grip. From this position, players had to descend in a continuous motion until reaching a 90° knee flexion and, from here, extend the knees and hips as fast as possible to reach the upright position. All the players were encouraged to perform the concentric phase of the movement in an explosive manner, at their maximal velocity as possible. The HT was performed lying face up on the floor, with flexed knees and the shoulders, back and feet on the ground. From this bridge position, with a 10 kg barbell resting across the hips which was held with a shoulder-width overhand grip, players were instructed to extend their hips as explosively as possible by pushing through the heels, until reaching full hip extension. In the final position the shoulders, hips and knees of players formed a straight line. Each test was repeated twice, with 45 s of passive recovery between repetitions, and the best score was recorded for further analysis. The average concentric velocity (in m·s-1) in both tests was examined with PUSHTM Band technology (PUSH Inc., Toronto, Canada). The participant wore the PUSHTM Band on the dominant forearm, with the hand supinated, in top of the ulna, 1-2 cm distal to the elbow and with the main button located proximally according to the manufacturer’s instructions (Balsalobre-Fernández et al., 2016). This wearable device consists of a three-axis accelerometer working at a sampling rate of 200 Hz. A Butterworth filter was used to smooth the acceleration data and the vertical velocity was calculated by integrating the vertical acceleration with respect to time. The mean velocity of the movement was calculated by averaging all the instantaneous velocities registered during the concentric phase of the movement. All data obtained with the PUSHTM Band was recorded in the iPhone PUSH app v.1.10.4. Balsalobre-Fernández et al. (2016)
examined the validity and reliability of this accelerometer showing a very high relationship with the mean velocity calculated with a linear velocity transducer (r = 0.85; standard error of estimate = 0.08 m·s-1; intraclass correlation coefficient (ICC) = 0.907). In addition, those authors reported acceptable test-retest reliability values (ICC = 0.981; coefficient of variation (CV) = 5.0%) for this wearable device.
Lower limb bilateral and unilateral explosive power was assessed using different types of vertical countermovement jumps (CMJ). For the first CMJ, players started from a standing position with their hands on the hips. From here, players self-selected the depth of the knee flexion and, without stopping the movement, were encouraged to jump as high as possible. Each trial was validated by a visual inspection to ensure that the landing was without any knee flexion. After this test, players carried out the CMJ with external loads of 5 and 10 kg (CMJ-5 and CMJ-10, respectively). The procedure to carry out these jumps was the same as for the CMJ, but in this case players held a 5 and 10 kg disc close to their chest with their hands, respectively. Finally, players carried out a single-leg CMJ with the right and left leg (CMJ-R and CMJ-L, respectively). Participants started solely on the designated leg and maintained the hands on the hips during the jump. They could self-select the depth of the knee flexion and then jumped as high as possible, ensuring that the landing was without any leg flexion. Any kind of technical failure or leg swing of the opposite leg during the execution resulted in an invalid jump. Each jumping test was repeated three times, separated by 45 s of passive recovery, and the best jump was recorded and used for further analysis (Loturco et al., 2015). There was a three minute recovery period between each of the five jumping tests. Jumping height, reported in cm, was calculated with the MyJump2® iOSApp, installed on an iPhone 6 running iOS 11.1.1. This application measures the flight time of a jump by identifying the take-off and landing frames in a high-speed camera which records the movement at a 240 frames per second rate. A previous study (Balsalobre-Fernández et al., 2015) has examined the validity of this device for the calculation of jumping height, showing an almost perfect correlation with CMJ height calculated with a force plate (r = 0.995; ICC = 0.997) and good reliability (ICC = 0.999; CV = 3.4-3.6%).
Finally, players carried out the Y-balance test (YB), a reliable and valid modification of the star execution balance test (Plisky et al., 2009). The YB examines the dynamic stability and balance of participants at the same time requiring neuromuscular control, strength and flexibility (Plisky et al., 2009). All the measurements werecarried out with the Octobalance System (Check Your Motion, Albacete, Spain). The system consists of a central platform and three-cylinder plastic bars pointing at different directions (120° between them). Players started standing on one foot on the centralized platform and, without lifting the heels and with hands on the hips, had to push the measuring device with the opposite foot as far as possible. The exercise was repeated moving the leg in three different directions: anterior (YBA), posterolateral (YBPL) and posteromedial (YBPM). Once the three directions were completed, the exercise was repeated with the opposite leg. When participants committed an error during the trial (i.e., losing balance, lifting the heel or the toe) it resulted in an invalid attempt. Each exercise was repeated three times with each leg, with a 10 s passive recovery between them, and the mean distance achieved in each direction was recorded for further analysis (Pardos-Mainer et al., 2019). Before the commencement of the test, each participant was allowed six practice trials before collecting the data. In addition, the leg length of each participant was measured from the anterior superior iliac spine to the medial malleolus. The final score of the test for each leg (YB-R and YB-L for the right and left leg, respectively) was calculated by normalizing the reach distance in each direction to the limb length. The sum of the three normalized reach distances was then averaged and multiplied by 100.
Statistical Analysis
Data are presented as mean ± standard deviation (SD). Statistical significance was inferred from p < 0.05. All data were log-transformed for analysis to reduce bias arising from non-uniformity error and were back transformed for presentation purposes. Normality and equal variance (homoscedasticity) assumptions were checked with the Shapiro-Wilk and Levene’s tests, respectively. A 2 (Groups;
Control, Experimental) x 2 (Time; pre, post) repeated measures of analysis of variance (ANOVA) was used to detect between-group differences in all variables. Post-hoc tests with Bonferroni-adjusted α were conducted to identify comparisons that were statistically significant. The standardized difference or effect size (ES, 90% confidence limit (CL)) in the selected variables was calculated using the pooled SD. Threshold values for Cohen ES statistics were 0.20, 0.50 and 0.80 for small, medium and large ES, respectively (Cohen, 1988). For within-group comparisons, the chances that the differences in performance were better/greater [i.e., greater than the smallest worthwhile change (0.2 multiplied by the between-subject standard deviation, based on Cohen’s d principle)], similar, or worse/smaller were calculated. Qualitative chances (QC) of beneficial/better, similar/trivial or detrimental/poorer effect were assessed qualitatively as follows: <1%, almost certainly not; 1 to 5%, very unlikely; 5 to 25%, unlikely; 25 to 75%, possibly; 75 to 95%, likely; 95 to 99%, very likely; and >99%, almost certainly (Hopkins, 2007). If the chances of having beneficial/better and detrimental/poorer performances were both >5%, the true difference was assessed as unclear. Otherwise, we interpreted that change as the observed chance. The ICC and CV were calculated in all the tests as measures of reliability and ranged from 0.81 to 0.92 and from 2.4 to 5.9%, respectively. An ICC >0.70 and a CV <10% were considered acceptable for clinical use (Baumgartner and Chung, 2001; Bradshaw et al., 2010). Statistical analyses were performed with SPSS for Mac (Version 21.0; SPSS Inc, Chicago, IL).
Results
Related changes and qualitative outcomes resulting from the within-group analysis are shown in Tables 3 and 4 for the control and experimental group, respectively. Results from between-groups analyses are illustrated in Figure 2.
Figure 2
Efficiency of the warm-up program in the experimental group in comparison with the control group to improve strength, jumping and balance variables.
Note: Bars indicate uncertainty in the true mean changes with 90% confidence intervals. Trivial areas were calculated from the smallest worthwhile change. BS: Back Squat; HT: Hip Thrust. CMJ: Counter Movement Jump; YB: Y-Balance; YBF: Y-Balance Frontal; YBPL: Y-Balance Postero Lateral; YBPM: Y-Balance Postero Medial; R: Right leg; L: Left leg.
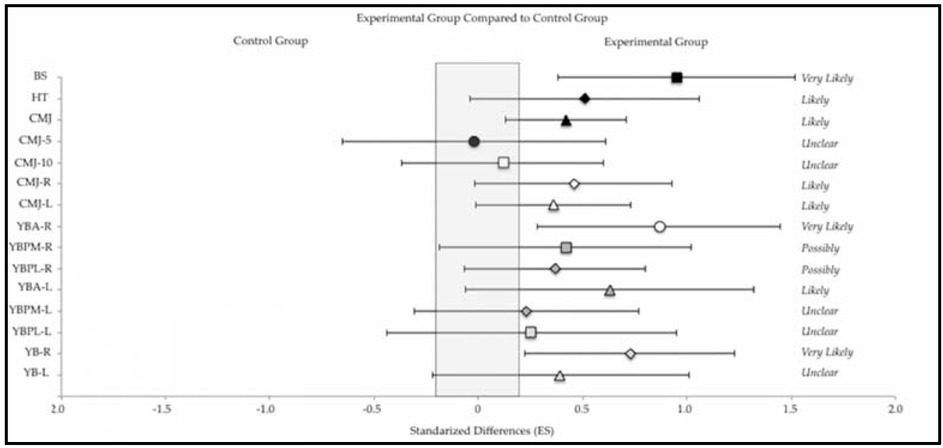
Table 3
Changes for the control group before and after the intervention period (mean ± SD).
[i] Note: 1ES: pre-post within-group Cohen d effect size; 2Percentage chance of having better/similar/poorer values; CL: Confidence Limits; QA: Qualitive Assessment; BS: Back Squat; HT: Hip Thrust; CMJ: Counter Movement Jump; YB: Y-Balance; YBF: Y-Balance Frontal; YBPL: Y-Balance Postero Lateral; YBPM: Y-Balance Postero Medial; R: Right leg; L: Left leg.
Table 4
Changes for the experimental group before and after the intervention period (mean ± SD).
[i] Note: 1ES: pre-post within-group Cohen d effect size. 2 Percentage chance of having better/similar/poorer values; *Significant difference (p < 0.05) between pre- and post-test; #Significant difference (p < 0.01) between pre- and post-test; $Significant difference (p < 0.001) between pre- and post-test; CL: Confidence Limits; QA: Qualitive Assessment; BS: Back Squat; HT: Hip Thrust; CMJ: Counter Movement Jump; YB: Y-Balance; YBF: Y-Balance Frontal; YBPL: Y-Balance Postero Lateral; YBPM: Y-Balance Postero Medial; R: Right leg; L: Left leg.
For the squat test, the repeated measures ANOVA revealed a significant group x time interaction (p = 0.001). Post-hoc analysis revealed significant pre- to post-improvements in the EG compared with the CG (p = 0.000; Δ27.0% [90% CL: 10.1;46.5]) with chances for better/similar/lower values of 98/2/0%, respectively. In terms of the hip thrust, no main group x time interaction was observed (p = 0.064), although the post-hoc analyses revealed an improvement in the EG (p = 0.000; Δ8.3% [90% CL: -0.7;18.1]), with chances for beneficial/similar/lower values in comparsion to the CG of 83/15/2%, respectively.
A significant group x time interaction was detected in the CMJ (p = 0.027). The EG showed a greater improvement in jumping height than the CG (p = 0.010; Δ7.1% [90% CL: 2.1;12.3]), with chances for better/similar/lower jumping height of 90/10/0%, respectively. There were no group x time interactions in the unilateral CMJ (right leg, p = 0.306; left leg, p = 0.089). However, the EG showed improved performance in both tests in comparison to the CG (right leg, p = 0.012; Δ10.4% [90% CL: -0.3;22.4]; left leg, p = 0.003; Δ10.1% [90% CL: -0.3;21.6]), with chances for beneficial/similar/lower values of 82/17/1% for the right leg and of 77/22/1% for the left leg, respectively. No main effects were detected for the loaded CMJ tests in both groups.
A significant group x time interaction was revealed in the anterior reach for the right leg (p = 0.014). Post-hoc analysis showed significant pre-topost-improvements in the EG compared with the CG (p = 0.016; Δ10.0% [90% CL: 3.1;17.4.]) with chances for better/similar/lower values of 97/3/0%, respectively. There were no significant group x time interactions for the measurements in all the other directions (YBPL-R, p = 0.263; YBPM-R, p = 0.154; YBA-L, p = 0.130; YBPL-L, p = 0.452; YBPM-L, p = 0.635). The total score for the right leg showed a significant group x interaction (p = 0.018). The EG increased their reach in comparison to the CG by 6.7% [90% CL: 2.0;11.6] (p=0.021) with chances for beneficial/similar/lower values of 96/4/0%, respectively. On the other hand, YB-L did not revealed any group x time interaction (p = 0.230), even though the EG showed greater scores than the CG (p = 0.288; Δ4.3% [90% CL: -2.4;11.4]).
Discussion
In this study we aimed to assess the effects of a 12-week neuromuscular warm-up program on performance in selected physical tests in youth female soccer players. Participants in the EG showed improvements in the speed of execution of the BS and the HT, increased their jumping height in the bilateral and unilateral unloaded CMJ and achieved better scores in the YB test in comparison to players who continued with their habitual warm-up routine. As these variables can influence physical performance in soccer, the adoption of this type of specific activation protocols could be an important complementary tool for this population of female athletes.
Soccer players must perform maximal-intensity actions in the course of a competitive game and, thus, it is essential for them to develop the capacity of producing and applying forces in the vertical and horizontal axis. The current neuromuscular warm-up program resulted in improvements in the mean velocity during the BS (very likely; ES = 0.95), which is a movement pattern that closely influences performance in jumping and sprinting activities (Comfort et al., 2014). In the HT, players also showed an important adaptation as a consequence of the intervention period, as the EG increased the mean velocity when executing this movement in comparison to the CG (likely; ES = 0.51). The biomechanical execution of the HT is related to activities inside the sport that require hip extension and the production of horizontal force, as it happens during sprinting. Our findings are in agreement with previous investigations which have suggested that both the BS and HT provide an effective stimulus to improve lower body strength and sport-specific variables (Contreras et al., 2017). Altogether, the enhancement of performance in both tests in the EG could be explained by the kind of exercises employed in the neuromuscular warm-up program, which respected the principle of training specificity. Recent research has also shown the effectiveness of plyometric-based training routines in the neuromechanical responses of youth soccer players (Loturco et al., 2015). As lower-body strength is positively related to sprint performance (Seitz et al., 2014), it is important for youth athletes to develop fundamental strength. Moreover, this is critical in team sports such as soccer, where youth training is mostly focused on game-based situations and there is little time to address the key components of long-term athletic performance.
Complementarily to foundational strength, young female players need optimal levels of explosive strength to carry out jumps, duels or shooting on goals during the matches. Countermovement jumps have been extensively used over the last decades to assess jumping ability in soccer players (Cometti et al., 2001). As a consequence of the intervention period, players in the EG increased their vertical jump performance by 7% (likely; ES = 0.42). The effect of different training protocols on jumping ability has shown contradictory results in the literature. On the one hand, Steffen et al. (2008) did not find improvements after the application of an injury prevention routine in adolescent female players. On the other hand, Ramirez-Campillo et al. (2018) showed positive effects of a training program in this variable, which is consistent with the findings of the present study. During the present investigation we did not find increments in jumping height when CMJ testing was carried out with additional weights (5 and 10 kg). It is possible that exercises employed during the neuromuscular protocol lacked the sufficient stimuli to produce enhancements in this variable, which is a major shortcoming also found in other investigations which have assessed the effect of injury prevention programs (Crossley et al., 2020; Vescovi and VanHeest, 2010). Nevertheless, as most of the activities during soccer consist of single-leg movements, it is essential to study the effect of neuromuscular activation on unilateral lower-limb activities. The results in both single-leg CMJs revealed positive adaptations (likely; ES = 0.46 and ES = 0.36 for the right and left leg, respectively), which could have a relevant transfer to soccer-specific activities such as accelerating-decelerating, changing the direction or kicking the ball. This is of special interest in populations of youth female soccer players, who are habitually less exposed to strength-oriented specific training. Previous studies have shown that lower-limb asymmetries detected by single-leg hop tests constitute severe risk factors for female athletes (Gomes Neto et al., 2017; Pappas and Carpes, 2012). Hence, the improvement of single-leg neuromuscular control could be an important injury-prevention strategy, as the epidemiology of female soccer players reveals a 3-higher risk of sustaining anterior cruciate ligament injuries than that of their male counterparts (Vescovi and VanHeest, 2010).
Players in the EG showed almost certain and likely improvements in the overall score in the Y-balance test with the right and left limb, respectively, after the intervention period. This test has been related with better dynamic balance, postural control and neuromuscular control of the lower extremity, which are factors than can influence the prevention of injuries (Gallardo-Fuentes et al., 2016). Going deeper into the results of this test, the greater increases were exhibited in the anterior direction. Previous studies have reported improved anterior reach distance among female soccer players in comparison to male participants (Stiffler et al., 2015). Additionally, performance in the YB-A test has also been shown to be sensitive to the implementation of training programs in youth players (Pomares-Noguera et al., 2018).
Altogether, improvements in performance variables in the strength, jumping and balance tests suggest a positive effect of the neuromuscular warm-up program in the EG in comparison to the CG. During the last years, FIFA has developed the 11+ and 11+ Kids programs which have been applied in a variety of populations and shown effective to reduce injury rates (Bizzini and Dvorak, 2015; Rössler et al., 2016). In our study, we proposed the use of a novel activation program which was principally focused on the enhancement of physical performance. This is why the current program included more strength oriented and plyometric exercises, as these kinds of drills can have a greater transfer to competitive performance. Complementarily, these exercises might have improved the dynamic flexibility of participants and increased the range of motion of the lower limbs. There are several limitations of the present study which need to be highlighted. First of all, it would be of interest to assess the effect of the program on the injury incidence of the players, as this is a key question which has to be inexorably related to performance enhancement. In relation to the latter, it could also be interesting to analyse the effect of this intervention on other relevant performance variables for soccer, such as flexibility, agility, change of direction and speed. We could hypothesize that some participants might have benefited from possessing greater ranges of motion about the joints of their lower body and this could have had an effect on the results.
The results of this study provide evidence that a neuromuscular warm-up program carried out during a 12-week intervention period can be effective in improving different physical performance variables in youth female soccer players. Greater improvements in mean velocity in the BS and HT, jumping height in the bilateral and unilateral CMJ, and balance were observed for the EG in comparison to the CG. However, the effect of the program on the CMJ performance with external loads and on the results of the YB test in different directions remained unclear. These findings suggest the importance of designing specific neuromuscular and strength development programs for youth female soccer players to complement their soccer-specific habitual activity, both for performance enhancement and injury prevention purposes.