Introduction
Soccer is an explosive sport where players perform repeated high-intensity actions. A soccer player can cover distances of ~10000 m during competitive matches, of which ~700 m and ~130 m are classified as high speed and sprinting (Lord et al., 2020), respectively. Short accelerations and linear sprints are two of the most important movement patterns since they frequently precede goals (Faude et al., 2012). Frequent high accelerations of 0.36-0.38 n·min-2 and high decelerations of 0.46-0.52 n·min-2 have been reported during match play (Kelly et al., 2019), whilst other skills have been shown to be of importance when scoring goals, including the ability to change the direction, to rotate, and to jump (Faude et al., 2012). Since power is a key determinant for all of these skills in soccer (Kelly
et al., 2019; Lord et al., 2020), its assessment across a range of physical tasks is warranted.
Recently, there has been a rise in the number of studies investigating the magnitude and direction of inter-limb asymmetry in neuromuscular capacities (i.e. change of direction [COD], jump and balance tasks) (Bishop et al., 2019a, 2019d; Madruga-Parera et al., 2020b; Maloney, 2018). The magnitude of asymmetry has been shown to be highly task-dependent with large variation reported between tasks (Bishop 2020a; Madruga-Parera et al., 2020a). Isokinetic dynamometry has been established as a method for detecting inter-limb asymmetries in strength variables for a return to the play process, with previous studies reporting magnitudes ranging from 2.6 to 6.5% (Botton et al., 2016; Schons et al., 2019). This method has been used to detect knee flexor-extensor muscular strength of soccer players. Despite the high reproducibility of this method, the evaluation of inter-limb asymmetries using iso-inertial devices reflects much better the sport-specific demands due to the speed variations and the use of the stretch shortening cycle (SSC). These tests have also been shown to be highly reproducible (Madruga-Parera et al., 2019a, 2020a). A recent investigation that used iso-inertial devices reported between-limb asymmetries of 9.8 to 12.7% for power, which were significantly greater than the limb differences for total time in the COD90º and COD180º tests, which ranged from 2.1 to 3.4% (Madruga-Parera et al., 20219a). For this reason, it has been suggested that total time to carry out a certain task may not be a very sensitive metric at detecting between-limb differences (Madruga-Parera et al., 2019a).
In addition, recent research has also highlighted the importance of monitoring not only the magnitude of the asymmetry but also its direction (Bishop et al., 2020b; Madruga-Parera et al., 2020b). Noting that asymmetry is a ratio (i.e., made up of two component parts), the direction of asymmetry refers to the superior performing limb in a given task (i.e., which leg jumps higher during a unilateral jump task) (Wang et al., 2013; Bishop, 2020a). Apart from unilateral jumps, this variability has been observed in other assessments, such as squats, countermovement jumps (CMJs), and drop jumps (DJs) in youth female soccer players (Bishop et al., 2019a). Interestingly, Bishop et al. (2020b) concluded that CMJs and DJs exhibited inherent variability in the direction of asymmetry during a competitive season in elite academy soccer players.
Previous research has examined how inter-limb asymmetries influence physical and sports performance (Lockie et al., 2014; Dos’Santos et al., 2017; Loturco et al., 2019). Particularly, some studies have indicated the association of inter-limb asymmetries with reduced linear and change of direction (COD) speed (Bishop et al., 2019b; Madruga-Parera et al., 2019a, 2020b; Maloney, 2018). Due to the importance of monitoring the athletic profile of soccer players and identifying the windows of opportunity to train them in either the clinical or sport-performance field, it would be appropriate to establish inter-limb asymmetry criteria for each sport according to its specific needs. Considering soccer, high-intensity actions such as accelerations, decelerations, and COD are frequent and occur unilaterally (Rouissi et al., 2018). In addition, given the clear positional differences in soccer and the repetitive asymmetrical soccer-specific actions, asymmetries should be expected. However, it is inconclusive whether inter-limb asymmetries in ankle ROM and in some soccer-specific actions are associated with reduced athletic performance.
Additionally, different studies have identified ankle dorsiflexion range of motion (ROM) as a predictor of dynamic balance (Basnett et al., 2013). A deficit value of ankle ROM can lead to neuromuscular alterations in the knee (Lima et al., 2018), as well as kinetic alterations during a side cutting task (DosʼSantos et al., 2020; Simpson et al., 2020). Importantly, these alterations can lead to a decrease in performance in different soccer-related skills (DosʼSantos et al., 2020; Gonzalo Skok et al., 2015). Moreover, Moreno-Pérez et al. (2019) recently found significant ankle dorsiflexion angle reductions during the competitive season and 48 h after match play compared to acute post-match values in the dominant and non-dominant leg. For this reason, it is critical to study ankle dorsiflexion in terms of its relationship with the performance of different neuromuscular abilities related to acute or chronic changes in ankle ROM.
The primary aim of this study was to analyze the magnitude and direction of inter-limb asymmetries in ankle dorsiflexion ROM, power (using iso-inertial devices), and a neuromuscular skill (COD). The secondary aim was to determine the relationship between inter-limb asymmetry scores for each test and also between these scores and scores for the different performance tests. We hypothesized that the magnitudes and the direction of the asymmetries could be athlete-dependent and related with a decrease in performance.
Methods
Participants
Sixteen semiprofessional male soccer players volunteered to participate in this study (age: 25.38 ± 6.08 years; body height: 1.78 ± 0.64 m; body mass: 79.5 ± 14.9 kg). Ten players had right kicking lower-limb dominance, while six had left lower-limb dominance. Players were currently in-season (competition) and trained on average 8 hours per week (6 and 2 hours of soccer and resistance training, respectively). We determined that for a sample size of n = 16, the statistical model was sensitive enough to detect Cohen’s d of 0.98 and a Pearson product moment correlation coefficient r = 0.60 with a power value of 0.80 and an alpha level of 0.05. We performed these calculations using G∗Power3 software for Mac (Faul et al., 2007) and following the indications of Beck (2013). We adopted the following exclusion criteria: a) history of pain within the month prior to assessment; b) not regular training during the month prior to testing; and c) musculoskeletal lower limb injury in the three months prior to testing. We obtained written informed consent and assent from participants. This study was approved by the Catalan Sports Council Ethics Committee.
Design and Procedures
We employed five tests to analyze performance and quantify the magnitude and direction of the inter-limb asymmetries of soccer players. These tests measured ankle dorsiflexion ROM (DF), power (three tests using iso-inertial resistance: leg extension strength (LE), leg curl strength (LC), and crossover step (CRO)), and change of direction 180º (COD180º). The reason to use this variety of tests is that several recent studies have noted the task-specificity of inter-limb asymmetries and suggested that more than a single test must be used to profile muscular imbalances (Bishop et al., 2018; Loturco et al., 2018).
We conducted this research on two different days separated by 72 hours. Testing session one consisted of DF, LC and LE tests, while session two was composed of CRO and COD assessments. We decided to split the five tests into two days in order to avoid possible negative interference between tests performed on the same day. Each testing session consisted of the same standardized pre-testing procedures. First, participants performed a specific warm up procedure consisting of five minutes of light jogging and dynamic stretches for the lower body (such as multi-directional lunges, inchworms, bodyweight squats, and spidermans). Upon completion, three practice trials were provided for each test. Participants were instructed to perform these at 75, 90 and 100% of their perceived maximal effort. After that, a three-minute rest interval was given before the start of the first test. We randomized the players´ starting leg in each test. Temperature, wind and humidity levels were similar across the sessions. To reduce the interference of uncontrolled variables, all the participants were instructed to avoid caffeine consumption for at least 24 hours before the tests. All soccer players were familiar with the testing procedures we used due to their regular physical assessments throughout the soccer season.
Ankle dorsiflexion ROM (DF). We tested unilateral ankle dorsiflexion ROM by the Dorsiflex App (Apple Inc., USA) using an iPhone 8. We applied test procedures following the methodology previously described by Balsalobre-Fernández et al. (2019). Participants were in a bearing lunge position and the device was placed with the screen in contact with the tibia (under the tibial tuberosity, aligning the Z-axis of the phone with the tibia). We performed three trials for each leg (i.e. left and right), with 10 s of passive recovery between trials. We selected the best score for each peak ankle among these trials for subsequent analysis.
Flywheel Leg Extension (LE) and Leg Curl (LC). We performed iso-inertial resistance LE and LC unilaterally with the Eccophysic Training Force machine (Byomedic System; SCP, Barcelona, Spain). The moment of inertia used during the exercise was 0.072 kg·m2. We adjusted this value considering the unilaterality of the exercise and based on previous studies using an inertia between 0.06 and 0.1 kg·m2, which reported positive acute and chronic responses after iso-inertial exercises (Piqueras-Sanchiz et al., 2020). We calculated the concentric and eccentric power during the different muscular actions. The first 2 repetitions were performed submaximally to generate momentum, whereas the 6 following repetitions were performed maximally. Participants executed 3 sets for each leg. The recovery time between each unilateral set was 1 min and 2 min were allowed between exercises using the same leg. The best score for each LE and LC among the 3 sets was selected for subsequent analysis, in both the concentric (C) and eccentric (E) muscular actions.
Cross-Over Step (CRO). A cross-over step test was performed using an iso-inertial device equipped with a conical pulley (Madruga-Parera et al., 2019a, 2020a). Rotational inertia was produced by an Eccotek Training Force device (Byomedic System; SCP, Barcelona, Spain) consisting of a metallic disk (diameter: 0.42 m) with 18 weights (0.421 kg and 0.057 m of diameter each). The total moment of inertia was 0.194 kg·m2 based on previous studies (Madruga-Parera et al., 2019a, 2019b). Participants executed 3 sets of 8 repetitions with each leg. A standard recovery time of 1 min between sets and 2 min between legs was used. We calculated the concentric and eccentric power during the different muscular actions. We selected the best score for each CRO among the 3 sets for subsequent analysis, in both the concentric (C) and eccentric (E) muscular actions.
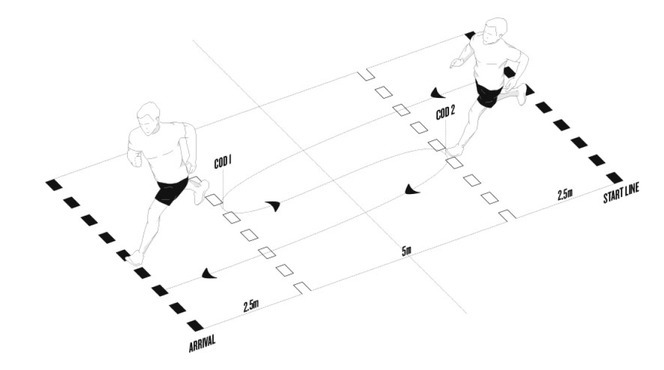
Change of direction speed (COD180º). The COD180º tests consisted of two 180° changes of direction using the same leg (right or left, respectively) in each trial (Madruga-Parera et al., 2019a). The first change of direction was performed after 7.5 m from the start, and the second one was performed after 5 m from the first change of direction. Participants sprinted a total distance of 20 m (Figure 1). We measured the total time in the COD test with photocell beams (Chronojump Boscosystem). The front foot was placed 0.3 m before the first set of photocells to ensure that the beam was not broken until each trial began. The photocell height was individually adjusted to match each athlete’s ground-to-hip height. We used for analysis the fastest time of the 3 trials for each leg. We considered a trial successful if the entire foot crossed over the line while changing direction. Each trial was separated by a three-minute recovery period.
Statistical Analyses
In accordance with the primary goal of the study, we calculated the inter-limb asymmetries (ASI) using the formula: ((100/(maximum value)*(minimum value)*-1+100) *IF(left<right,1,-1), as proposed by (Bishop et al., 2018). The ‘IF function’ in the end of the formula determines the direction of the asymmetry.
We presented the data as mean ± standard deviation (SD). Normality assumptions were checked using the Shapiro-Wilk test. We examined tests reliability using the coefficient of variation (CV) and a 2-way random intraclass correlation coefficient (ICC) with absolute agreement and 95% confidence intervals (CIs). CV values were considered acceptable when CV ≤ 10% (Cormack et al., 2008; Turner et al., 2015). Our interpretation of the ICC was: ICC < 0.50 = poor, 0.50–0.74 = moderate, 0.75–0.90 = good and > 0.90 = excellent (Koo and Li, 2016).
In accordance to the second goal of the study, we examined the differences between the asymmetry scores obtained for each test using a one-way repeated measures ANOVA. We checked sphericity assumption using the Mauchly test and corrected with the Greenhouse-Geiser correction factor when violated (p ≤ 0.05). A post-hoc test with Bonferroni correction was applied to interpret a significant main effect. Differences between asymmetry scores were reported as the raw mean differences (MD) and the standardized mean differences (dz) with their 95% CI. We calculated these standardized differences using the Cohen’s d formula dz = t/√(n) (Lakens, 2013) and we interpreted them as: < 0.2 = trivial; 0.2-0.6 = small; 0.6-1.2 = moderate; 1.2-2.0 = large; > 2.0 = very large (Hopkins et al., 2009).
Finally, we assessed the relationships between the asymmetry scores and the performance scores for each test using Pearson’s product moment correlation coefficients (r). These coefficients were interpreted as follows: r = 0.00– 0.10 = trivial, 0.11–0.30 = small, 0.31–0.50 = moderate, 0.51–0.70 = large, 0.71–0.90 = very large and 0.91–1.00 nearly perfect (Hopkins et al., 2009). We applied the Bonferroni’s correction in order to prevent type I error.
The level of significance was set at 0.05 for all tests. We performed all statistical analyses using JASP for Mac (version 0.13.1; JASP Team (2020), University of Amsterdam, the Netherlands) and IBM SPSS Statistics for Mac (v.25, IBM, New York).
Results
All the tests performed had acceptable between-trial consistency with all CV values below 10%, and good or excellent ICCs ranging from 0.79 to 1.00 (Table 1). Table 1 shows the asymmetry scores for each test. We observed larger asymmetry magnitudes in the tests that involved the use of iso-inertial resistance (LE, LC, and CRO). In Figure 2, we display the magnitudes and directions of the asymmetries for each of the 16 players included in the study. We noted that no player showed the same asymmetry direction for all the tests performed.
Figure 2
Individual player data showing the magnitude and direction of inter-limb asymmetries for all asymmetry tests.
COD: change of direction; CRO: crossover step; LC: leg curl; LE: leg extension; DF: ankle dorsiflexion; _E: eccentric power; _C: concentric power; ASY: asymmetry
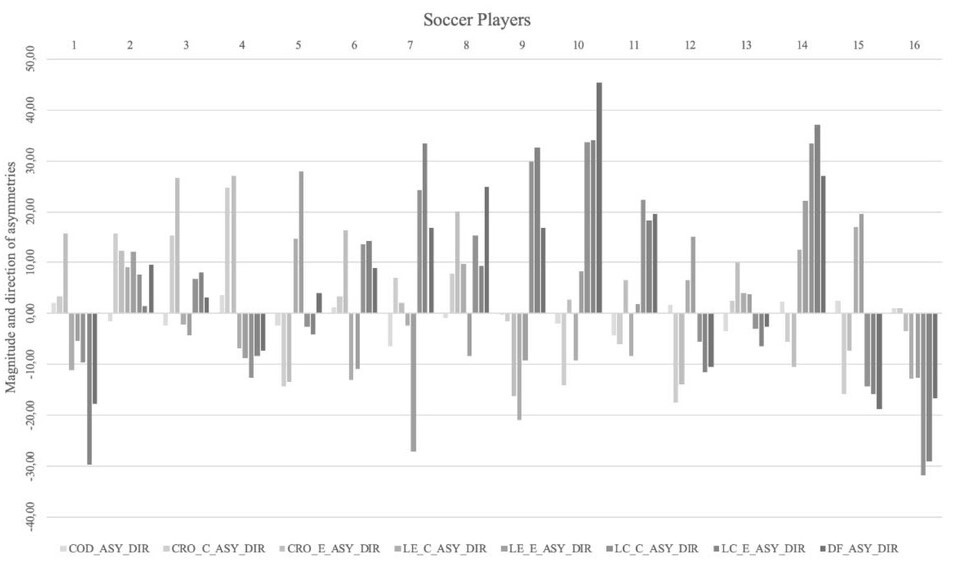
Table 1
Mean test scores and standard deviations, inter-limb asymmetries, and accompanying reliability data for each test.
[i] a denotes significantly higher asymmetry value than the ankle dorsiflexion test (p ≤ 0.05). b denotes significantly higher asymmetry value than the COD test (p ≤ 0.05). CV: coefficient of variation; ICC: intraclass correlation coefficient; CI: confidence intervals, DF: ankle dorsiflexion; COD: change of direction; CRO: crossover step; LE: leg extension: LC: leg curl; _E: eccentric power; _C: concentric power; LEFT: left leg; RIGHT: right leg.
As shown in Table 2, we observed statistically significant differences between the asymmetry scores obtained using different tests: CODASY was significantly different from CRO_EASY (MD = -10.40%, 95% CI [-19.31, -1.49], dz = -0.94, 95% CI [-1.52, -0.33], p = 0.008), from LC_CASY (MD = -15.98%, 95% CI [-24.88, -7.07], dz = -1.44, 95% CI [-2.13, -0.72]), from LC_EASY (MD = - 13.28%, 95% CI [-22.18, -4.37], dz = -1.19, 95% CI [1.83, -0.54], p < 0.001), and from LE_EASY (MD = - 9.97%, 95% CI [-18.87, -1.06], dz = -0.90, 95% CI [1.47, -0.30], p = 0.014). Furthermore, DFASY was significantly different from LC_CASY (MD = - 12.46%, 95% CI [-21.37, -3.56], dz = -1.12, 95% CI [1.74, -0.48], p < 0.001) and from LC_EASY (MD = - 9.76%, 95% CI [-18.67, -0.86], dz = -0.88, 95% CI [1.45, -0.29], p = 0.018).
Table 2
Pairwise comparison between inter-limb asymmetry data.
Relationships between the asymmetry scores and performance scores for each test are shown in Table 3. The asymmetries observed for the concentric phase of the LE test decreased performance in the eccentric phase of the CRO test for the right leg, and the asymmetries in the concentric phase of the CRO test decreased performance in LE and in COD performance tests (pBonferroni < 0.05).
Table 3
Correlations between inter-limb asymmetries and performance scores for each test.
Discussion
The primary finding of this study was that the inter-limb asymmetry magnitudes differed remarkably between tests, with highest asymmetries displayed for the tests that involved the use of iso-inertial resistance. Also, the direction of the asymmetries for a certain player depended on the test used. Secondly, we observed that the LE has a negative relationship with CRO performance, and that CRO asymmetries had a negative relationship with LE and COD performance.
The first point to be highlighted is that inter-limb asymmetry magnitudes varied depending on the assessments performed, agreeing with previous studies which showed that asymmetries were test-dependent (Bishop et al., 2018). This emphasizes the importance of using a range of assessments for investigating inter-limb asymmetries. With respect to ankle dorsi-flexion ROM, we observed slightly lower asymmetries (5.88% ± 3.42) than in a study by Gonzalo Skok et al. (2015), where average asymmetry values of 9.57% ± SD in youth basketball players were reported. These differences might be due to the different characteristics of the two samples in terms of age and sport. Surely the improvement in ROM may be due to the increase in muscle stiffness provided by eccentric overload work.
Frequently, the detection of quadriceps (leg extension) and hamstring (leg curl) asymmetries has been performed remotely in the kinematics of sport, with isokinetic devices. For example, Coratella et al. (2018) used an isokinetic device and found that interlimb asymmetries in the quadriceps muscles ranged from 9.0 to 9.7% in the concentric peak torque and from 7.8 to 9.0% in the eccentric peak torque, while in the hamstrings these asymmetries ranged from 9.6 to10.5% in the concentric peak torque and from 10.7 to 11.7% in the eccentric peak torque. Due to the fact that these magnitudes were calculated using an isokinetic device (and not with an iso-inertial device) which has been rarely used to detect inter-limb asymmetries, these magnitudes are considerably lower than those found in our study. It is also noteworthy that iso-inertial resistance evaluations allow the concentric and eccentric values to be detected in the same cycle of action, which makes the assessment more time-efficient, cheaper and functional than isokinetic dynamometry assessments. Furthermore, the magnitudes of asymmetries found in this study are similar to those observed by Madruga-Parera et al. (2020a) in youth tennis players as they ranged from 9.31 to 11.18% and by Madruga-Parera et al. (2019a) in handball players where they ranged from 9.80 to 12.70% in a CRO with the use of an iso-inertial device. We could attribute this high magnitude to the existing greater neuromuscular requirements when the eccentric phase of a movement is overloaded (Vogt and Hoppeler, 2014), as it happens with such devices. Another possible reason to explain this is the coordinative complexity of the CRO step action, which is a task closer to soccer-specific skills when compared to monoarticular tests.
It should be noted that the LE, LC and CRO tests used in this study incorporate an iso-inertial resistance device, as this type of equipment provides more sport-specificity than traditional gravity-dependent devices and valuable eccentric-overload data (post-concentric). This last aspect must be considered in the control of training and the relationships with the eccentric phase in the COD (Chaabene et al., 2018). Finally, although the COD is a soccer specific test, previous studies showed that it may not be a very sensitive metric due to the fact that it failed to detect important inter-limb asymmetries which were identified using iso-inertial tests (Madruga-Parera et al., 2019a). These results are similar to those observed in other studies using the same test (Dos’Santos et al., 2019). However, we did not calculate the COD deficit, which has been described as an alternative way of analyzing asymmetries (DosʼSantos et al., 2019; Madruga-Parera et al., 2019a). To sum up, although these results allow us to obtain a great picture of the magnitudes of the asymmetries in relation to the kinematics of the sport, we have yet not been able to determine which tests identify inter-limb asymmetries in real game situations.
Another interesting point of the present study is the direction of inter-limb asymmetry for the different tests we assessed. Previous studies have described the importance of identifying this variable in performance (Fort-Vanmeerhaeghe et al., 2020; Madruga-Parera et al., 2020b) and in the return to play process (Bishop et al., 2020c). However, this analysis has not yet been performed according to the kinematics of sport. To the authors best knowledge, only one study has linked the direction of asymmetries in tests with iso-inertial resistance with other types of evaluations (i.e. multidirectional jumps and COD tests) (Madruga-Parera et al., 2019a). Our results show that no player displayed consistently the same directionality in terms of limb dominance in all the tests and that the preferred leg varied depending on the capacity and test analyzed. These results indicate the need to individualize the battery of tests to be performed according to the needs of the athlete. Likewise, in a recent study, Bishop et al. (2020a) have shown how the jumping magnitudes and their directionality can fluctuate during the course of a sporting season. For this reason, it would be essential to observe more closely how these changes may depend on the relation of the tests with the specific kinematics of the sport analyzed.
The relationship between asymmetries and performance has recently become a controversial topic. Our results showed a moderate correlation between CRO asymmetries in the eccentric phase and LE performance. These results could be explained by the coordinative and neuromuscular complexity of performing the actions, as well as the muscles involved in the CRO, and could be potentially very useful to detect asymmetries in the last stages of the return to play process. Also, we found significant relationships between CRO asymmetries and performance in the COD (Table 3). These results are in agreement with those found in youth handball players where an association was found between asymmetries in CRO (9.80 - 11.79%) and decreased performance in COD90º and COD180º (Madruga-Parera al., 2019a). Despite the controversy over the relationship between asymmetries and their negative effect on performance, it seems that CRO could be an appropriate test to detect asymmetries that could be related with performance of soccer-specific actions (such as changes of direction).
Despite the usefulness of these findings, this study presents some limitations. There is a lack of knowledge of the relationships between the loads to be applied in iso-inertial devices. Related to this limitation, future research is needed to identify the effects of iso-inertial technology loading on the stretch shortening cycle, and how this information can improve return to play and training processes. In addition, we were unable to associate asymmetries to specific demands of the game, including cognitive, perceptual, and ecological aspects of the game. For this reason, future research should focus on establishing criteria and valuation elements at possible game-specific situations.
Conclusions and implications for practice
In conclusion, this study shows a battery of tests to detect the magnitude and the direction of inter-limb asymmetries that could be adapted to the kinematics of the sport of interest. The inclusion of tests using iso-inertial devices, which are highly reproducible, better reflects soccer-specific demands due to the speed variations and the use of the stretch shortening cycle. Among all the tests we used, strength and conditioning coaches could consider establishing the most appropriate ones for each period of the season (pre-season, competitive season, off season) to control neuromuscular risk factors and improve performance. While the tests that are less kinematically similar to the sport of interest could be used in the initial phases of the rehabilitation process, the ones that better reflect the sport-specific kinematics could be used in the final phases of the return to play process.