Introduction
The prevalence of hip/groin symptoms is high amongst elite, sub-elite and amateur players. Harøy et al. (2017) reported 45% of female and 59% of male soccer players described at least one episode of hip/groin symptoms. Kerbel et al. (2018) found that the sport with the highest rate of injuries per 100,000 athlete exposures was men's soccer (110.84). Soccer is characterised by kicking, sudden changes of direction, jumping, sprinting and quick accelerations and decelerations, all of which generate high loads and torsional forces on the hip (Saw and Villar, 2004), leading to hip/groin injuries (Kerbel et al., 2018). Adolescent soccer players are especially at risk with high physical demands placed on their joints during the critical stages of hip joint development, with 14-22% complaining of hip/groin pain (Crow et al., 2010).
The high prevalence of hip/groin symptoms have forced researchers to find possible factors which may differentiate between symptomatic and asymptomatic athletes (Jansen et al., 2010b; Linek et al., 2019a; Mohammad et al., 2014). Jansen et al. (2010b) investigated the lateral abdominal muscles (LAMs) in relation to hip/groin symptoms and found the transversus abdominis muscle (TrA) thickness was smaller in athletes with longstanding adduction-related groin pain, thus a possible risk factor for (recurrent) groin injury. Undoubtedly, the LAMs play an important role during kicking and help stabilise the body (Räty et al., 1999). Mens et al. (2006) highlighted the importance of pelvic stability on hip/ groin pain and function, showing a decrease in groin pain by 68% and an increase in hip adductor force by 39% while wearing a pelvic belt (as an external pelvic stabiliser). Anatomically the LAM may function as an internal belt due to some parts of the LAM being perpendicular to the sacroiliac joint (Richardson et al., 2002). Additionally, a systematic review by Mosler et al. (2015) concluded that reduced adductor muscle strength during the squeeze test can differentiate between athletes with and without hip and groin pain. On the other hand, Crow et al. (2010) demonstrated that hip adductor muscle strength was reduced preceding and during the onset of groin pain in elite junior athletes. The results by Mens et al. (2006) and Jansen et al. (2010b) suggest that some hip and groin symptoms may be caused by impaired pelvic control and therefore, be treated by pelvic stabilisation.
Shear wave elastography (SWE), also called supersonic shear imaging, is a recently developed ultrasonic diagnostic technique which can measure the elasticity of a specific part of a muscle (Ryu and Jeong, 2017). Previous studies have reported that the shear modulus (elasticity) measured by SWE is linearly related to passive and active muscle force (Hug et al., 2015). Thus, the shear modulus measured by SWE can determine the force generated by resting muscle tone or during isometric contraction. Additionally, SWE allows measuring muscle thickness and elasticity simultaneously. Recently, Linek et al. (2019b; 2020b) confirmed the reliable estimation of muscle thickness and elasticity in an adolescent population using ultrasound (US) measurements in the SWE mode. Also, those authors developed a reliable method for assessing LAM during isometric contraction whereby participants volition was maximally limited (Linek et al., 2019b).
To date, no studies have assessed LAM elasticity and thickness in relation to hip and groin symptoms in any population. The external oblique abdominal muscle (OE) generates a wide range of movements and torques of the trunk and the pelvis, providing overall trunk stability, while the internal oblique abdominal muscle (OI) and TrA are involved in pelvic and spinal segmental stability (Bergmark, 1989). Kim et al. (2016) suggest that additional isometric hip adduction increases the OI and OE muscle activity. Thus, the authors hypothesised that youth soccer players with hip/groin problems may present with a different strategy of pelvic and trunk stability/control, possibly influenced by changes in the abdominal muscle elasticity and thickness. Therefore, the aim of this study was twofold: a) to assess the relationship between SWE-derived elasticity and thickness measurements compared to self-reported subscales of the Copenhagen Hip and Groin Outcome Score (Thorborg et al., 2011), and b) to compare elasticity and thickness between the asymptomatic and symptomatic side in youth soccer players with unilateral symptoms.
Methods
Setting and study design
This cross-sectional study was conducted at a professional soccer club. Ultrasound measurements were collected by an experienced and qualified physiotherapist. The study was designed in accordance with the Declaration of Helsinki and approved by the local medical ethics committee (Ethics Approval number: 4/2017). All participants and their parents and/or legal guardians received oral and written information about the procedures of the study and provided written informed consent for participation.
Participants
Twenty five elite male youth soccer players, all aged 13 years, were recruited using convenience sampling. The exclusion criteria were: a) an injury which prevented participation in training or competition for longer than one week during the four months prior to the examination; b) any prior surgery on the abdominal or spinal regions; and c) low back pain (Oswestry Disability Index [ODI] greater than 20%) during the one week prior to the study (Table 1).
Table 1
Basic data of participants presented as means (SD).
[i] HAGOS - Hip and Groin Outcome Score; ADL – Activities of Daily Living; Sport – Sport and Recreational Activities; PA- Participation in Physical Activity; QOL – Quality of Living; ODI –Oswestry Disability Index; †Which leg do you prefer when playing soccer?;‡Regardless of the answers you provided in the HAGOS questionnaire, which hip/groin do you complain about when playing soccer?
The HAGOS
Ultrasound measurements were performed in the morning on a sport/activity free day. All the players completed the HAGOS questionnaire (Thorborg et al., 2011) following the protocol described by Linek et al. (2019a). There are six HAGOS subscales: Pain, Symptoms, Activities of Daily Living (ADL), Sport and Recreational Activities (Sport), Participation in Physical Activity (PA) and Quality of Life (QOL). Responses were given using a five-point Likert scale which ranged from 0 to 4 (0 = no hip/groin problem; 4 = extreme hip/groin symptoms). Raw scores were then transformed into percentages, thus all subscales were scored on a 0–100 scale, where lower scores indicated more hip/groin symptoms. The questions were answered considering hip and groin function during the past week (Thorborg et al., 2011).
After completion of the HAGOS questionnaire, the physiotherapist asked players an additional question, regardless of the answers provided in the HAGOS questionnaire: which hip/groin do you complain about when playing soccer? Possible answers were: none, both, right or left. However, the physiotherapist who performed US measurements was blinded to this information.
Oswestry Disability Index
The ODI was used to evaluate low back functional status or disability. The index has 10 items (pain intensity, personal care, lifting, walking, sitting, standing, sleeping, sex life, social life and travelling), all of which are scored on a scale of 0–5 points based on functional performance; higher scores indicate more severe disabilities. The more severe the patient’s spinal mobility dysfunction is, the closer the ODI is to 100%.
Ultrasound measurements
Aixplorer ultrasound equipment (Version 12.2.0, Software Version 12.2.0.808, Supersonic Imagine, Aix-en-Provence, France), combined with a linear transducer array (2–10 MHz; SuperLinear 10-2, Vermon, Tours, France), was used in the SWE mode to measure muscle thickness and shear modulus in the OE, OI and TrA on both sides. The probe was always placed on the anterolateral wall lateral to the umbilicus and transverse to the long axis of the body – along the line of TrA muscle fibres. On each image, the TrA musculofascial junction was visualised. If possible, the probe was adjusted to ensure parallel orientation of the OE, OI and TrA fascial borders. Pressure can have an impact on the shear modulus and thickness measurements (mainly in slender participants), therefore we used hypoallergenic transduction gel to maximally reduce the pressure applied to the skin (Linek et al., 2019b).
LAM shear modulus and thickness measurements were collected in the semi-supine position at rest and during isometric contraction. In the resting stage, the knees were in 90° flexion, and the upper limbs were placed along the sides of the trunk. Players were asked to breathe comfortably and keep their abdomen relaxed. Ultrasound images in the SWE mode were taken at the end of normal expiration – the lowest position of the TrA (Linek et al., 2019b).
In the isometric contraction stage, participants were in the same position as in the resting stage with the exception of their upper limbs. The shoulders of the upper limbs were in 90° flexion with straight elbows and hands holding the handle. In this position, each participant was encouraged to push the handle in the forward direction to reach a force equal to 5% of their body mass. When the participant achieved this value, they were asked to maintain this force until the operator indicated when to release. The participant was then asked to release the force and repeat the task again. Four repetitions were needed to collect four SWE images (Figure 1). A more detailed protocol about how measurements were taken is presented elsewhere (Linek et al., 2019b).
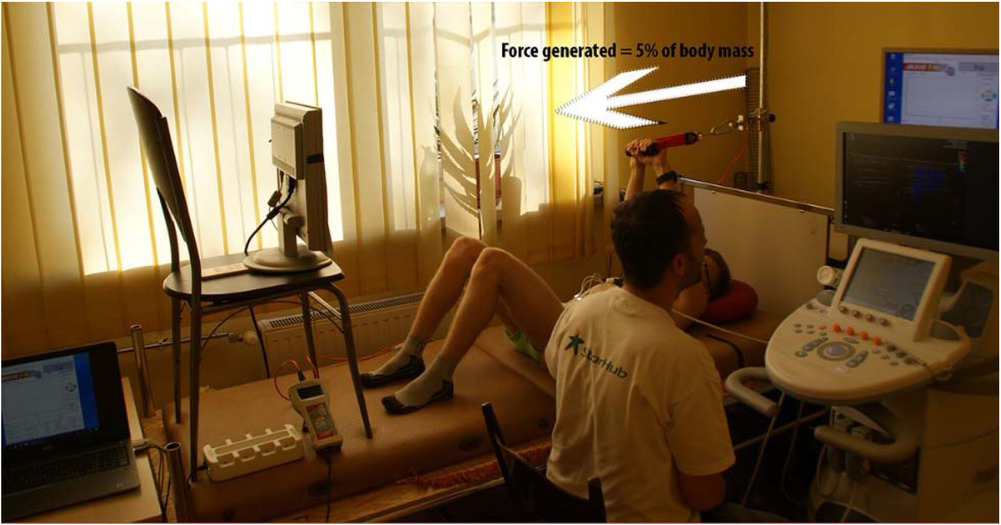
Force obtained during the isometric contraction stage was controlled by an FB1k force gauge (Axis, Gdansk, Poland) coupled with an external S-Type load cell (DEE, Keli Sensing technology, Ningbo, China). For each participant, the force gauge was calibrated and set at 5% of the body mass ± 200 g as an expected force (± 200 g was established as the threshold due to the force gauge being sensitive to very small changes). The force level was controlled continuously by the athlete and operator, both visually and sonically (Figure 1). This procedure is reliable with appropriate agreement to assess OE, OI and TrA shear modulus and thickness measurement at rest and during isometric contraction in an adolescent population (Linek et al., 2019b).
Body mass assessment
A physician medical body weight scale was used to assess body mass shortly before US measurements. This information was needed to establish an expected force during the isometric contraction stage for each participant as well as to normalise rest thickness for each muscle (Linek et al., 2019b).
Data management
The actual values for OE, OI and TrA muscle thickness were normalised to body mass with an allometric-scaling procedure, as it is recommended that allometric-scaled OE, OI and TrA thickness should be analysed (rather than the actual values). Analysis without body mass normalisation can lead to incorrect interpretations of the study results.
Allometric variables necessary for the scaling procedure were obtained from a study by Linek (2017) on adolescent soccer players; the OE, OI and TrA values were 0.77, 0.67 and 0.61, respectively. In order to normalise the muscle size measurement to body mass, the following equation was used (AP means allometric variable):
Additionally, for the muscle thickness and shear modulus measurements, a contraction ratio was calculated using the following equations: (1) contraction ratiothickness = muscle thickness during isometric contraction divided by muscle thickness at rest; (2) contraction ratioelasticity = muscle shear modulus during isometric contraction divided by muscle shear modulus at rest.
Statistical analysis
The Levene’s test was used to assess variance homogeneity. Ultrasound measurements between the right and left body side were compared with an independent t-test or, in the event of variables for which the variances were unequal, with the Welch’s test. Correlations between HAGOS subscales and SWE data were analysed using Spearman’s r and interpreted as negligible (0.00-0.10), weak (0.10-0.39), moderate (0.40-0.69), strong (0.70-0.89) or very strong (0.901.00). In order to find potential side-to side differences in LAM thickness and elasticity, it was decided to compare the symptomatic versus asymptomatic side with the independent t-test or the Welch`s test (unequal variables) among players who clearly stated unilateral symptoms. All statistical analyses were performed with Statistica 12PL software, and p-values < 0.05 were considered significant.
Results
None of the participants had symptoms of low back pain (ODI scores were minimal; mean 2%). The minimum and maximum HAGOS subscales scores were: Symptoms 71-96%; Pain 75100%; ADL 75-100%; Sport 56-100%; PA 75-100%; QOL 55-100% (see Table 1 for mean values). Out of 25 soccer players, four stated no problems in their hip/groin (mean scores on the subscales: Symptoms 95%; Pain 98%; ADL 99%; Sport 97%; PA 100%; QOL 97%); eight stated problems on both sides (mean scores on the subscales: Symptoms 83%; Pain 90%; ADL 92%; Sport 85%; PA 89%; QOL 84%); seven stated problems on the right side (mean scores on the subscales: Symptoms 87%; Pain 94%; ADL 94%; Sport 87%; PA 92%; QOL 80%) and six stated problems on the left side (mean scores on the subscales: Symptoms 85%; Pain 90%; ADL 91%; Sport 76%; PA 95%; QOL 82%). Full characteristics of the studied population are presented in Table 1.
Right versus left side
Since most participants declared hip/groin problems on both sides (and a similar number declared that they had problems on the left or the right side), the authors then determined whether there were differences in ultrasound measurements between the right and the left body side. With regard to LAM thickness measurements, there were no significant differences between the right and the left side in all 25 participants. However, there was statistically significant side-to-side asymmetry for TrA elasticity at rest and during contraction and for OE elasticity during contraction. Other elasticity variables were similar on both body sides (Table 2). Consequently, for variables with no side-to-side asymmetry, the mean value from both sides was used for further correlation analysis.
Table 2
The mean (SD) for the right and left body side; p-value from the t-test for independent samples.
| Variables | Side | Side-to-side differences | |||
|---|---|---|---|---|---|
| Right | Left | t test | p | ||
| Actual value [mm] | OE | 7.65 (2.04) | 7.10 (2.17) | 0.92 | 0.36 |
| OI | 9.79 (2.16) | 9.20 (2.00) | 1.01 | 0.32 | |
| TrA | 3.19 (0.95) | 3.20 (0.89) | 0.007 | 0.99 | |
| Allometric-scaled thickness | OE | 0.39 (0.08) | 0.36 (0.08) | 0.39 | 0.22 |
| OI | 0.74 (0.14) | 0.69 (0.12) | 1.28 | 0.20 | |
| TrA | 0.30 (0.07) | 0.30 (0.06) | 0.01 | 0.99 | |
| Actual value during | OE | 6.65 (1.65) | 5.84 (2.05) | 1.55 | 0.13 |
| contraction [mm] | OI | 9.89 (1.92) | 9.52 (2.10) | 0.64 | 0.52 |
| TrA | 3.34 (0.78) | 3.54 (0.79) | 0.88 | 0.38 | |
| Contraction ratio thickness | OE | 0.88 (0.12) | 0.82 (0.11) | 1.93 | 0.06 |
| OI | 1.02 (0.11) | 1.04 (0.11) | 0.69 | 0.49 | |
| TrA | 1.07 (0.14) | 1.13 (0.17) | 1.42 | 0.16 | |
| Shear modulus at rest [kPa] | OE | 20.8 (3.49) | 22.2 (4.44) | 1.19 | 0.24 |
| OI | 11.0 (1.93) | 11.6 (3.31) | 0.77† | 0.46 | |
| TrA | 13.6 (4.03) | 10.3 (3.33) | 3.17 | 0.002* | |
| Shear modulus during | OE | 22.5 (4.78) | 25.8 (5.81) | 2.18 | 0.03* |
| contraction [kPa] | OI | 15.0 (3.48) | 16.2 (4.75) | 1.01 | 0.32 |
| TrA | 13.9 (3.99) | 10.9 (3.65) | 2.70 | 0.01* | |
| Contraction ratio elasticity | OE | 1.09 (0.16) | 1.17 (0.20) | 1.73 | 0.09 |
| OI | 1.37 (0.25) | 1.43 (0.40) | 0.62† | 0.53 | |
| TrA | 1.07 (0.29) | 1.09 (0.25) | 0.27 | 0.79 | |
Symptomatic versus asymptomatic side
LAM comparisons were also made between the asymptomatic and symptomatic side among players who clearly declared unilateral symptoms (i.e., n = 13; seven on the right side and six on the left side). Based on independent t-tests, there were no significant differences (p > 0.05) between the symptomatic and the asymptomatic side in thickness and elasticity measurements among the 13 examined players with unilateral symptoms.
LAM muscles and HAGOS
For thickness measurements, there was a correlation between HAGOS and the OI muscle, namely positive moderate correlations between allometric-scaled OI resting thickness and the ADL, Sport and QOL HAGOS subscales. The OI contraction ratio was also moderately correlated with the Symptoms subscale. Additionally, there was a moderate positive correlation between allometric-scaled TrA resting thickness and the QOL subscale (the highest correlation is also presented in Figure 2). Other variables were not correlated (Table 3).
Figure 2
Distribution of the allometric-scaled internal oblique abdominal muscle (OI) thickness and Sports subscale of HAGOS.
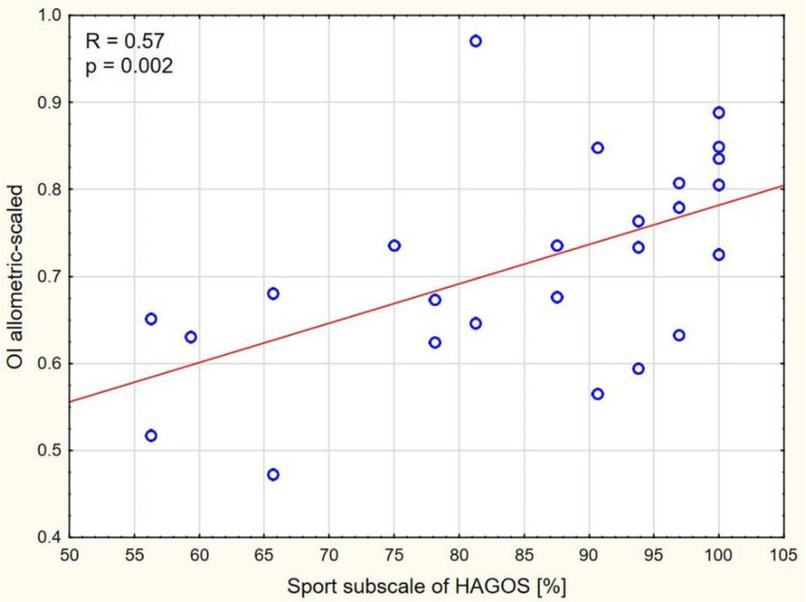
Table 3
Spearman correlation values (r) between muscle thickness measurements and HAGOS subscales.
| Variables | HAGOS subscale | ||||||
|---|---|---|---|---|---|---|---|
| Symptoms | Pain | ADL | Sport | Physical Activity | QOL | ||
| Actual value | OE | 0.11 | -0.13 | -0.05 | 0.14 | 0.28 | -0.06 |
| OI | 0.17 | 0.24 | 0.13 | 0.40* | 0.08 | 0.31 | |
| TrA | 0.11 | 0.04 | -0.04 | 0.12 | 0.06 | 0.37 | |
| Allometric-scaled | OE | 0.03 | -0.08 | 0.18 | 0.34 | 0.39 | 0.05 |
| OI | 0.13 | 0.35 | 0.40* | 0.57* | 0.07 | 0.41* | |
| TrA | 0.10 | 0.07 | 0.14 | 0.27 | 0.18 | 0.47* | |
| Actual value during | OE | -0.09 | -0.33 | -0.04 | 0.11 | 0.23 | -0.11 |
| contraction | OI | 0.34 | 0.15 | 0.18 | 0.31 | 0.10 | 0.20 |
| TrA | -0.01 | -0.09 | 0.06 | 0.16 | 0.01 | 0.34 | |
| Contraction ratio | OE | -0.12 | -0.20 | 0.11 | 0.01 | -0.00 | 0.02 |
| OI | 0.46* | 0.04 | 0.16 | 0.01 | 0.11 | -0.05 | |
| TrA | 0.05 | 0.23 | 0.27 | 0.28 | 0.05 | 0.03 | |
For shear modulus measurements, there were positive moderate correlations between OI shear modulus at rest and the QOL, right TrA shear modulus during contraction and Symptoms and left TrA shear modulus during contraction and PA (the highest correlation is also presented in Figure 3). Other variables were not correlated (Table 4).
Figure 3
Distribution of the transversus abdominis muscle (TrA) shear modulus during isometric contraction and Symptoms subscale of HAGOS.
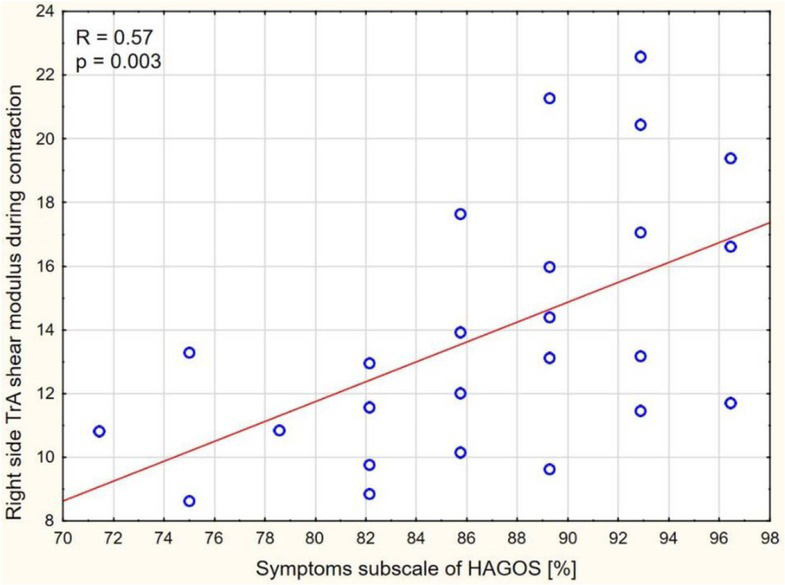
Table 4
Spearman correlation values (r) between muscle elasticity measurements and HAGOS subscales.
| Variables | HAGOS subscale | ||||||
|---|---|---|---|---|---|---|---|
| Symptoms | Pain | ADL | Sport | Physical Activity | QOL | ||
| Shear modulus at | OE | 0.04 | 0.30 | 0.21 | 0.26 | -0.20 | 0.32 |
| rest | OI | 0.07 | -0.02 | -0.21 | 0.00 | -0.06 | 0.44* |
| TrA – right side | 0.29 | 0.03 | -0.04 | 0.07 | 0.19 | 0.20 | |
| TrA – left side | 0.21 | 0.07 | 0.18 | 0.18 | 0.35 | 0.18 | |
| Shear modulus | OE – right side | 0.06 | 0.30 | 0.24 | 0.22 | 0.10 | 0.41* |
| during contraction | OE – left side | 0.19 | 0.18 | 0.19 | 0.22 | -0.10 | 0.14 |
| OI | 0.35 | 0.16 | -0.07 | 0.05 | 0.02 | 0.39 | |
| TrA – right side | 0.57* | 0.09 | -0.06 | 0.15 | 0.08 | 0.31 | |
| TrA – left side | 0.27 | 0.22 | 0.17 | 0.10 | 0.41* | 0.25 | |
| Contraction ratio | OE | 0.09 | -0.09 | -0.02 | -0.06 | 0.17 | -0.04 |
| OI | 0.24 | 0.25 | 0.14 | 0.13 | 0.22 | 0.11 | |
| TrA | 0.17 | 0.15 | 0.09 | 0.06 | 0.01 | 0.15 | |
Discussion
The prevalence of hip and groin symptoms is known to be high in soccer players (Crow et al., 2010; Harøy et al., 2017; Kerbel et al., 2018) and the present findings confirmed this, revealing that approximately 86% of the sample of youth soccer players reported some kind of bilateral or unilateral hip and groin disturbances. These results were higher than those of Thorborg et al. (2017) who examined 695 sub-elite male adult soccer players and found hip/groin pain during the previous season was reported among 49% (95% CI: 45-52%) of players, while Harøy et al. (2017) indicated that 59% of male soccer players reported hip/groin symptoms. The present study participants were much younger than those in Thorborg et al. (2017) and Harøy et al.’s (2017) studies, and the results from the HAGOS subscales suggested that the disturbances in most cases were not severe. Such results may be expected in a sample which included soccer players who participated in training or competition during the four months prior to the study. Regardless of the symptom’s severity, in the present study 21 out of 25 players reported hip/groin problems, which might not be directly linked to prior hip/groin injury or pain. Thorborg et al. (2014) reported lower HAGOS subscales in adult soccer players who experienced hip/groin pain in the previous season. The present authors hypothesised that hip/groin problems might partially be caused by poor pelvic and/or trunk control, and this impaired control may be observed prior to substantial pain or hip/groin injuries. From this perspective, participants with minor symptoms may also incur changes in optimal pelvic and/or trunk control, which may be manifested as different abdominal muscle function strategies, exhibited by changes in their thickness or elasticity compared to asymptomatic players. Thus, we assessed the relationship between LAM elasticity and thickness measurements compared to self-reported HAGOS subscales, and compared LAM elasticity and thickness between the asymptomatic and symptomatic sides among youth players with unilateral symptoms.
To the best of our knowledge, there is only one study where LAM (thickness at rest and during contraction) was analysed in adult athletes with groin pain (Jansen et al., 2010b). Those authors concluded that athletes with groin pain had thinner TrA resting thickness, and this feature may be a risk factor for (recurrent) groin injury. Another study showed that healthy athletes under the condition of anticipated groin pain had thinner TrA and OI, whereas the OE was thicker during acute groin pain (Jansen et al., 2010a). Those results suggest that abnormal LAM behaviour in athletes with groin pain may be caused by a pain anticipatory motor strategy (Jansen et al., 2010a). In turn, Whittaker and Emery (2015) reported that abdominal wall adaptations (lower inter-recti distance and higher TrA thickness) after a neuromuscular injury prevention program in adolescent soccer players might be associated with neuromuscular control, specifically better trunk control. This may, theoretically, be associated with sport related injury risk, including the hip and groin region. The present study demonstrated that adolescent soccer players with more hip/groin disturbances (indicated by lower QOL, ADL or Sport HAGOS subscale scores) had thinner allometric-scaled TrA or OI. Additionally, OI thickness during isometric contraction in relation to the resting state was lower among players with greater Symptom scores. Hides et al. (2010) found that athletes with low-back pain had less ability to contract TrA muscles than athletes without pain. Mens et al. (2006) treated hip/groin pain using pelvic stabilisation, showing an increase in hip adduction force, while hip/groin pain levels were reduced. The transversely-oriented LAMs (mainly TrA and OI) play an important role in pelvic stability (Bergmark, 1989; Richardson et al., 2002). Thus, correlations presented in this study seem reasonable.
In the present study, reduced TrA and OI allometric-scaled thickness among adolescent players with more problems in the hip/groin region may reflect localised muscle atrophy. Such atrophy of the TrA is seen in chronic low-back pain patients (Kim et al., 2013), and an electromyography study found that TrA onset was delayed in athletes with groin pain (Cowan et al., 2004). Additionally, our study revealed for the first time that OI shear modulus at rest and TrA shear modulus during isometric contraction were higher in adolescent soccer players with less problematic hips and groins. This finding may indicate that OI and TrA in more symptomatic players possibly generate lower forces, which may be explained by the shear modulus of the muscle measured by SWE, linearly related to passive and active muscle force (Hug et al., 2015). Thus, the shear modulus may determine the force generated by a muscle at rest (i.e. resting muscle tone) and during voluntary isometric contraction. Additionally, lower shear modulus values are further decreased by the end of the fatigue protocol (Morel et al., 2019; Siracusa et al., 2019), and shear modulus is suggested as an alternative tool to assess muscle fatigue (Morel et al., 2019). In this context, the preliminary shear modulus results in the present study suggest that soccer players with higher OI resting stiffness (higher shear modulus values) and higher TrA stiffness during isometric contraction present a healthier hip and groin condition. Taking into account that greater shear modulus values (greater stiffness) reflect higher force generation, this finding may mean that these muscles should have greater resting thickness, as demonstrated in the present study. Thus, players with more problematic hips and groins may have more elastic (less stiff) OI at rest and TrA during isometric contraction, which may relate to a lower force generation ability of these muscles, but could also be explained by fatigue of the muscles during the examination. Both these possibilities may affect lumbo-pelvic stability and then possibly translate to a hip and groin condition.
The present findings have several limitations: 1) the results should be applied to the group examined, namely professional male adolescent soccer players; 2) generalisation to older players or athletes involved in other sports, or to female players should be made with caution;3) the small sample size; 4) the examined players reported rather minor hip and groin problems (this factor may also be an advantage of the study, because it shows that minor symptoms are related to changes in the abdominal muscles); 5) scoliosis may affects the LAM thickness and elasticity (Borna et al., 2017; Linek et al., 2020a), but was not considered in the examined group; 6) the shear modulus measured by SWE is based on some assumptions which are not fully known in the context of skeletal muscles; 7) isometric LAM contraction was imposed by upper limbs and it may be worth assessing LAM isometric contraction imposed by lower limbs.
In conclusion, OI and TrA thickness (allometric-scaled) and elasticity (measured by shear modulus calculation) moderately correlated with hip and groin problems in male adolescent soccer players. Thus, these preliminary results provide evidence of possible differences in abdominal muscle function in adolescent soccer players who complain about hip and groin problems. The differences may be related to muscle atrophy or fatigue. This information may be useful in understanding the factors which contribute to the development of hip and groin problems and to develop prevention and rehabilitation exercise programmes. The results also justify the need for further studies which should consider lateral abdominal muscles in relation to hip and groin problems in adolescent soccer players.