Introduction
Physiological stress can be accumulated during a competitive season, thus predisposing soccer players to an inability to deal with training and competitive demands, with possible consequences for their performance (Silva et al., 2014). Physiological disturbances may emerge from the continuity of physiological stress, which can lead to muscular damage and changes in hormonal and immunological markers (Ascensão et al., 2008; Hammouda et al., 2012; Silva et al., 2008). As a result, training monitoring and extensive monitoring through multiple blood samples may contribute to controlling the states of functional and nonfunctional overreaching (Drust et al., 2007; Heisterberg et al., 2013).
Appropriate training load management and frequent monitoring of performance is a vital determinant in optimizing sports training (Halson, 2014). The rating of perceived exertion (RPE) is one of the most popular, low-cost, effective and easy-to-use controlling methods in sports (Borg, 1982; Foster et al., 2001). The reliability of the RPE in controlling the internal load has been confirmed in many different studies and sports (Alexiou & Coutts, 2008; Lambert & Borresen, 2010; Impellizzeri et al., 2004). Foster’s method is widely used to control the internal load of each training session (Foster, 1998). This method consists of multiplying the 1-to-10 RPE scale by the duration of the training session in minutes (Foster et al., 1996; Halson, 2014). The first application of Foster’s RPE in soccer revealed significant correlations with Edwards’s (HR) and TRIMP methods (Impellizzeri et al., 2004). RPE methods have also been tested with GPS technologies and HR-based methods and the main findings suggest that the RPE can be considered as a global indicator in individual training response in soccer and should be regarded as a viable method to monitor the internal load in soccer training (Casamichana et al., 2013).
Despite the benefits of the RPE method, some authors argue that the RPE is influenced more by resistance loads than by volume, and for that reason more repetitions with a lighter load are perceived as easier than performing fewer repetitions against a heavier load (Foster et al., 1996; Lambert & Borresen, 2010). Moreover, the RPE seems not to have enough reliability in high-demanding training sessions with collisions and intermittent high-intensity efforts which may lead to muscle damage (Lambert & Borresen, 2010; Takarada, 2003). Collisions are not as widely common in soccer as in rugby, nevertheless, the great range of high-impact movements which require muscular recruitment also leads to significant increases in oxidative stress and muscle damage throughout the 72 hours of recovery (Ascensão et al., 2008).
If the RPE method can be used to assess training loads, the Hooper index (HI) is a self-analysis method which measures the subjective perception of fatigue, stress level, delayed onset muscle soreness and sleep quality (Hooper & Mackinnon, 1995). This method seems to be reliable in avoiding overtraining situations (Hooper & Mackinnon, 1995). Nevertheless, the Hooper index may not contribute to changing perceived exertion in soccer, thus the hypothesis of its possible influence of the mood and pre-fatigue state on the RPE during a submaximal exercise in soccer was rejected (Haddad et al., 2013). Nevertheless, comparison with biochemical markers is scarce in elite professional soccer players.
Serum creatine kinase (CK) activity is often a popular measure to control muscular damage (Lazarim et al., 2009). The high variability of this marker and the poor relationship with muscle recovery have been pointed out in a previous study (Twist & Highton, 2013). However, CK activity has been commonly used to control muscular damage in soccer players (Andersson et al., 2008; Fatouros et al., 2008; Silva et al., 2008). Other biochemical and hormonal markers have also been used, nevertheless the cost–benefit relationship does not seem to be profitable.
As previously discussed, load monitoring is one of the tasks which may lead to performance optimization (Borresen & Lambert, 2009). Load monitoring is also useful to control the variance of the sessions’ load during the weekly microcycle (Coutinho et al., 2015; Impellizzeri et al., 2004). Nevertheless, studies which analyze the weekly variation of the training load with elite athletes are scarce. The majority of studies were conducted with elite youth players or semiprofessional players (Casamichana et al., 2013; Coutinho et al., 2015; Impellizzeri et al., 2004). Moreover, the associations between Foster’s RPE, the Hooper index and the CK variation have never been studied.
The perception of intra-week differences should be considered to identify the sensitivity of players to load variation and how this load may influence the wellness status and the organic responses to the muscle damage. Based on the previous evidence, this study had a twofold purpose, i.e., to determine: 1) the daily load variations between microcycles; and ii) the relationships between Foster's RPE, the Hooper index and CK levels over the weekly micro cycles, during an entire soccer season of elite professional players.
Methods
Participants
Thirty-five professional male soccer players (3 goalkeepers, 6 wide defenders, 4 central defenders, 9 midfielders, 8 wide midfielders and 4 forwards) (mean ± SD; age 25.7 ± 5.0 years, body height 182.3 ± 6.4 cm; body mass 79.1 ± 7.0 kg) and members of a soccer club which participated in the first Portuguese top division and in the UEFA Champions League were monitored during 41 microcycles. Participants were informed about the study protocol and signed an informed consent form before the beginning of the study. The study followed the ethical recommendations of the Declaration of Helsinki.
Design and procedures of data collection
A longitudinal study was designed to investigate the daily load variations between training weeks of an entire season in an elite professional soccer team, and also to determine the relationships between three variables, two perceptions scales (Foster’s RPE, HI) and a blood marker (CK), over the microcycles of the season.
During all training sessions, the Hooper’s Index was monitored before every session, while the RPE was obtained 30 min after each session. The duration of training sessions was recorded for the purpose of quantifying the training load (RPE x volume). For the reliability and validity of the study, only data from players who performed the entire volume of the session were used. Participants were familiarized with all experimental protocols as these were part of their day-to-day practice.
The familiarization of the subjective scales (HI and RPE) was held during the pre-season period, in order to determine the profiles of answers for each participant. Baseline samples of the blood were obtained during an entire training week to establish also patterns of recovery for each player. Additional whole blood analyses were performed 48 h after and 48 h before each match, for players who played more than 60 min.
Description of factors
Three types of training microcycles (TM) were codified: i) a week with no match; ii) a week with one match; and ii) a week with two matches. Playing positions were codified as: i) a goalkeeper (GK); ii) a wide defender (WD); iii) a central defender (CD); iv) a midfielder (CMF); v) a wide midfielder (WMF); and vi) a forward (FW). Training sessions were classified based on the number of days after or before the match day (MD). The two immediate days after the MD were classified as MD+1 and MD+2. The remaining days were classified as the number of days before the next match (e.g., MD-5, MD-4, MD-3, MD-2 and MD-1). The months were codified from January to December. The pre-season began in August and the season ended in May.
Description of variables
Hooper Index (HI)
Approximately 30 min before each training session, each player was asked to rate subjectively the four variables of the Hooper’s Index, related with the quality of sleep (concerning the night preceding the training session), the level of fatigue, the level of stress, and delayed onset muscular soreness (DOMS), on a scale of 1 – 7 in accordance with the study of Hooper and Mackinnon (1995), in which 1 was very, very low and 7 was very, very high. Considering sleep, the scale was 1 for very, very good and 7 for very, very poor. The Hooper Index was the summation of the four subjective ratings.
RPE and Internal Load (IL)
Furthermore, the RPE was collected approximately 30 min following each training session using the Borg’s CR-10 scale (1 = very light activity and 10 = maximal exertion) in order to calculate the training load, multiplying the session-RPE by the volume of the training session (Foster et al., 2001). The volume of the training session was determined since the beginning of the warm-up lap on the pitch and until the players left the pitch.
For this purpose, each player had one portable computer tablet (Microsoft Surface Pro, USA) with a custom-designed application, where participants were able to answer the scales. Each player selected his Hooper’s scale and the RPE rating by touching the respective score on the tablet, which was then automatically saved under the player’s profile. This method helped minimize factors which might influence a player’s rating, such as peer pressure and replicating other players’ ratings (Malone et al., 2015). All players were familiar with the RPE scale prior to the commencement of the study as this method had been used throughout the pre-season training stage.
Creatine Kinase (CK) activity
Blood sample collection was performed within the lab facilities of the club during a pre-training session. For the enzymatic measurement of plasma CK concentration, 32 μL capillary blood samples were obtained from the fingertip of the index finger of the selected players. The fingertip was cleaned with 95% ethanol and dried with cotton wool to remove excess liquid, an automatic lancet device was used to draw blood before a heparinized capillary tube (Reflotron®, catalog No. 955053202) was used to collect the sample. The capillary blood sample was then immediately placed onto a CK test strip (Reflotron®, catalog No. 1126695) through the use of a pipette and analyzed via the Boehringer Mannheim Reflotron Analyzer®. These collections were made in the morning, before the training session and also before any strength and conditioning workout.
Statistical Analyses
Two-way multivariate analyses of variance (MANOVA) were used to analyse the variance of IL, HI (total), minutes of training (minT) and CK activity between the factors. In the event of interactions between factors, a two-way analysis of variance (ANOVA) was applied for each dependent variable followed by one-way ANOVA and Tukey HSD post-hoc to analyse the variance within the factor. Effect size (ES) was determined and interpreted using the following criteria (Ferguson, 2009): no effect (ES < 0.04), minimum effect (0.04 < ES < 0.25), moderate effect (0.25 < ES < 0.64) and strong effect (ES > 0.64). All statistical procedures were conducted using SPSS software (version 23.0, USA) with statistical significance set at 5%.
Results
Significant differences were found in training variables between particular months (p = 0.001; ES = 0.043, minimum effect), MD (p = 0.001; ES = 0.032, no effect), TM (p = 0.001; ES = 0.020, no effect) and playing positions (p = 0.001; ES = 0.012, no effect). Significant interactions were observed in the pairs month*MD (p = 0.001; ES = 0.047, minimum effect), month*TM (p = 0.001; ES = 0.021, no effect), month*playing positions (p = 0.001; ES = 0.044, minimum effect) and MD*TM (p = 0.001; ES = 0.015, no effect). Two-way ANOVA revealed significant differences in the month*MD pair (HI: p = 0.031; minT: p = 0.001; IL: p = 0.001); month*TM pair (minT: p = 0.001; IL: p = 0.001); month*playing positions pair (HI: p = 0.001; IL: p = 0.031); and MD*TM pair (HI: p = 0.001; minT: p = 0.001).
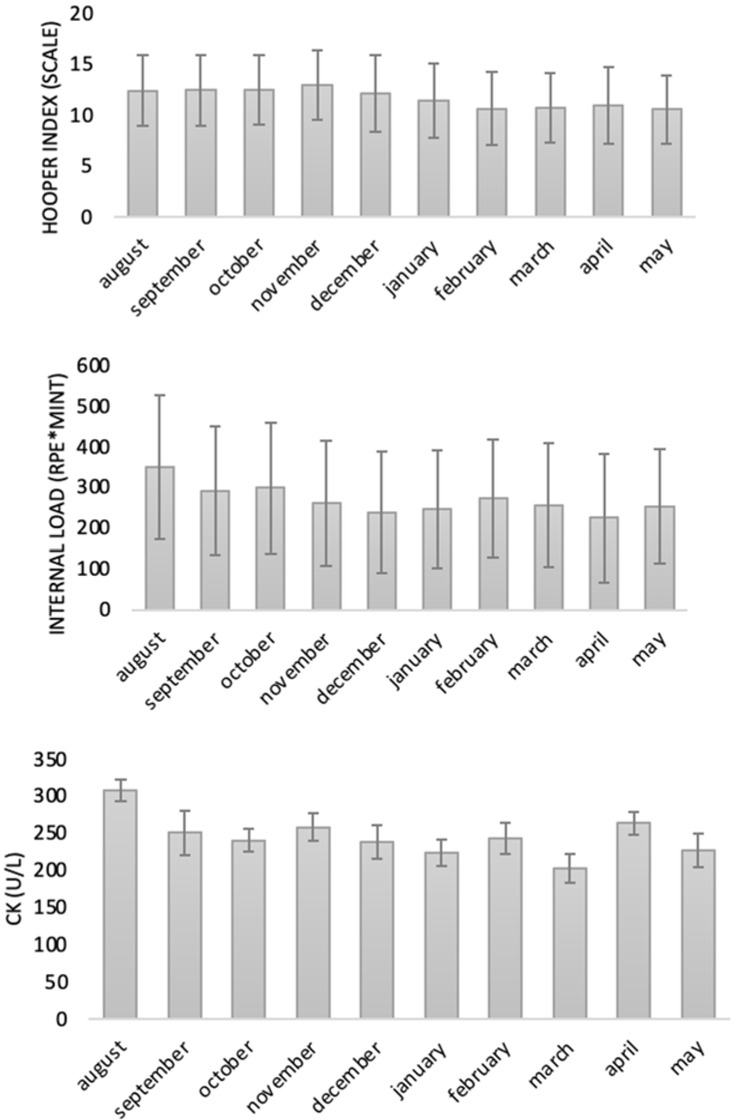
One-way ANOVA revealed significant differences between months in the HI (p = 0.001; ES = 0.052, minimum effect), minT (p = 0.001; ES = 0.066, minimum effect), IL (p = 0.001; ES = 0.052, minimum effect) and CK (p = 0.002; ES = 0.031, no effect). Results of the HI and IL per month are presented in Figure 1. A post-hoc test revealed two significant different clusters in the months’ factor (first cluster: august-to-december; second cluster: january-to-may) in which the first cluster had the greatest values of the HI. The minT variable was organized into two clusters: (i) January, February, March, April, May, November and December; and (ii) August, September and October. There were three significant clusters in the internal load variable (first cluster: August; second cluster: September, October, February; third cluster: November, December, January, March, April and May). Finally, there were significant differences in CK levels between August and January (p = 0.012) and August and May (p = 0.001).
Analysis of variance revealed significant differences in the HI (p = 0.001; ES = 0.021, no effect), minT (p = 0.001; ES = 0.255, moderate effect), IL (p = 0.001; ES = 0.039, no effect) and CK (p = 0.001; ES = 0.040, minimum effect) between MD. The HI scale had significantly greater values in MD+1, MD+2 and the lowest values were found in MD-1 and MD-2. Comparison between MD revealed that shorter (minutes) training sessions occurred on the first and second day following the match. The longer sessions (minutes) took place in the third and fourth sessions after the match. Post-hoc tests revealed that lower values of the internal load were found after 1 and 6 days of the match. On the other hand, higher values of the internal load were found on the third and fourth day after the match. Descriptive statistics can be found in Table 1.
Table 1
Descriptive statistics of training variables variation per days after the match.
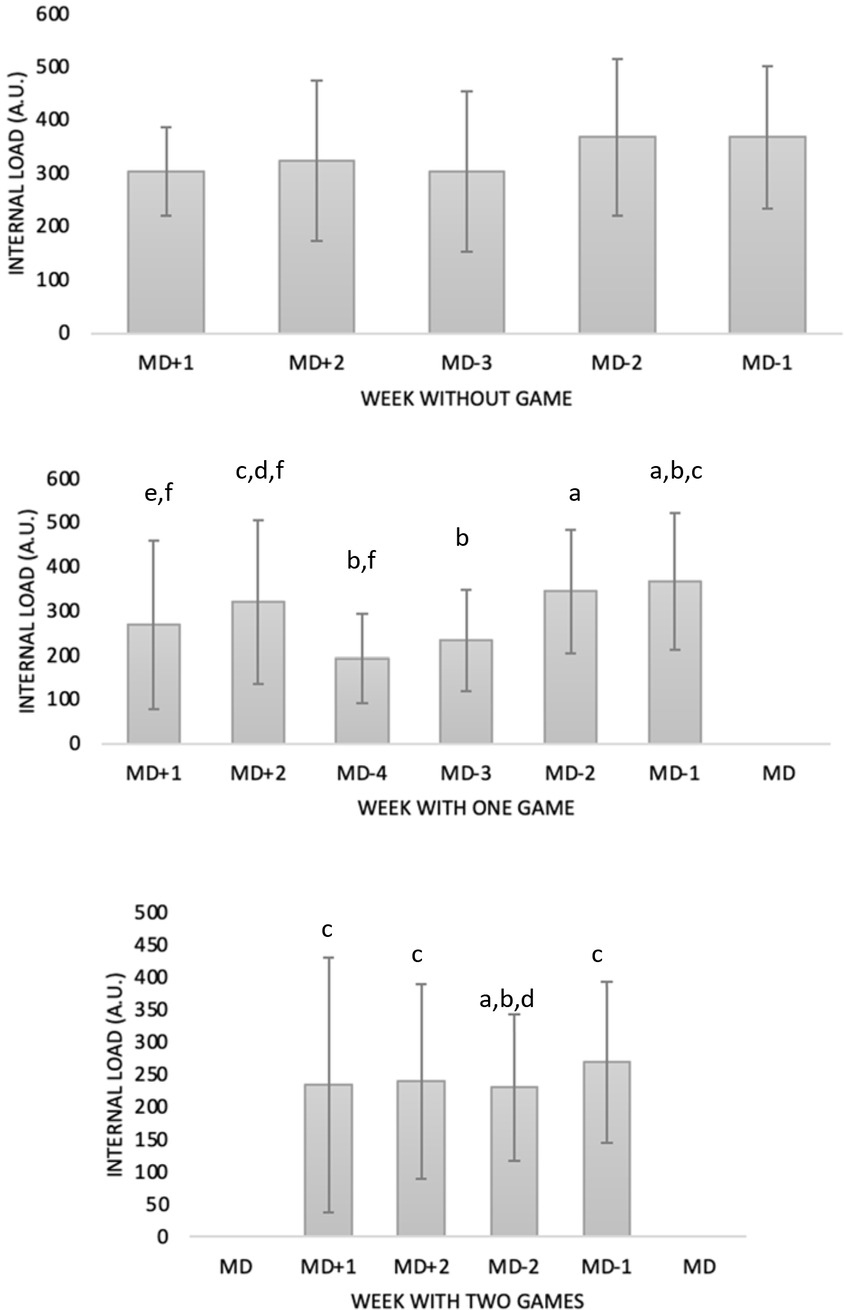
The split made per type of the microcycle revealed significant differences in the internal load between days after the match in the microcycle with one match (p = 0.001; ES = 0.132, minimum effect) and two matches (p = 0.001; ES = 0.011, no effect). No significant differences of the internal load between days after the match were found in the week with no match (p = 0.168; ES = 0.045, minimum effect). These results are presentes in Figure 2.
Figure 2
Variation of internal loads between days after the match in three types of a microcycle (no game; one game per week; two matches per week). Legend: In the week with one game: significantly different from aMD+1; bMD+2; cMD-4; dMD-3; eMD-2; fMD-1. In the week with two games: significantly different from aMD+1; bMD+2; cMD-2; dMD-1 at p < 0.05
Comparison of the HI (p = 0.044; ES = 0.002, no effect), minT (p = 0.001; ES = 0.045, minimum effect), and IL (p = 0.001; ES = 0.045, minimum effect) revealed significant differences between the type of a microcycle. No significant differences were found in CK activity (p = 0.710; ES = 0.001, no effect). Greater values of the Hooper index were found in the week with one match than the week with two matches. Post-hoc tests revealed significantly lower values of minutes of training in the weeks with two matches. Comparison of internal loads revealed significantly greater values in weeks with no matches followed by weeks with only one match.
Analysis of variance between playing positions showed significant differences in the HI (p = 0.001; ES = 0.034, no effect), minT (p = 0.006; ES = 0.006, no effect), IL (p = 0.001; ES = 0.059, minimum effect) and CK (p = 0.001; ES = 0.030, no effect). Descriptive statistics are provided in Table 2
Table 2
Descriptive statistics of training variables variation per playing positions.
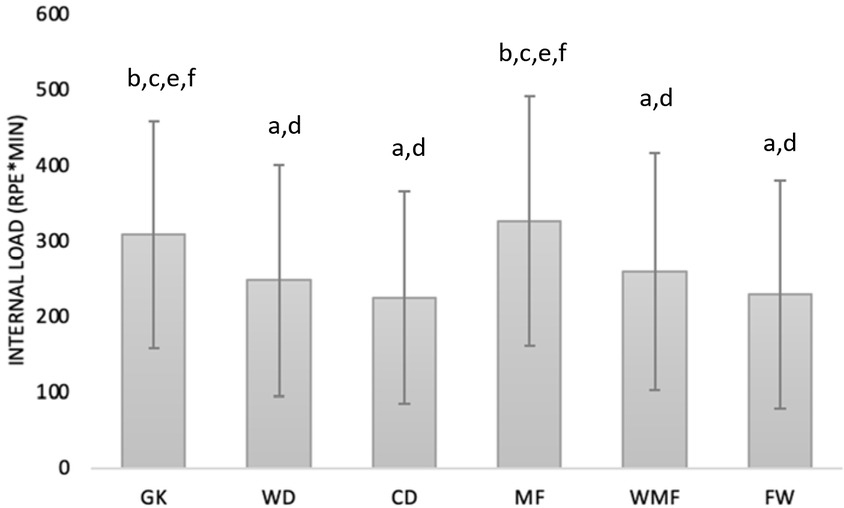
Two significantly different clusters were found in the HI (first cluster: WD, WMF and CD; second cluster: MF, GK and FW) with greater values in the first one. There were significant differences in minT between CD and MF (p = 0.013) and FW and MF (p = 0.031). MF had significantly greater values of the internal load for the remaining playing positions with the exception of the GK. On the other hand, CD had smaller values with significant differences compared to GK (p = 0.001), MF (p = 0.001) and WMF (p = 0.012). Variations of the internal load considering each playing position are presented in Figure 3. Finally, there were significant differences in CK levels between WD and MF (p = 0.001).
Discussion
The purpose of the current study was to determine the daily load variation in elite soccer players and its relationship with the rate of perceived exertion, wellness and creatine kinase levels over an entire season.
The findings indicate significant differences in the composite of training variables between the different months, match-day, type of a microcycle and playing positions.
Regarding the differences found between particular months, two significant different clusters were revealed for the HI and IL. Similar findings were reported by (Jeong et al., 2011), and such variations in training loads are highly likely to be a function of the aims and objectives of coaches during different training periods. Typically, pre-season training is more intense than in-season training, and the adjustments in load can promote specific training adaptations.
Another work in elite soccer demonstrated that perceived ratings of wellness were sensitive to daily fluctuations in training loads (Thorpe et al., 2015). Our results corroborate this sensitiveness once the athletes’ score of the HI was significantly higher in the two training sessions immediately after the match day (MD+1 & MD+2), while the lowest values were observed on the most distant days (MD-1 and -2).
An intention to periodise training loads across the microcycles was observed with the lowest IL perceived the day following a match (+1) and the day before competition (-1), with large statistically significant increases in -3 and -4. Similar findings were described for elite soccer players of a different league (Thorpe et al., 2015). These differences did not occur in the microcycles with no match, where the IL was more similar between training sessions.
Contrary to what could be expected, the HI was significantly greater in weeks with one match than weeks with two matches. One of the explanations can be the higher loads perceived during training sessions on weeks with only one match, while the microcycle with two matches per week had less training sessions and focused more on the recovery process of athletes. Further research is needed to examine this relationship.
The analysis of variance between playing positions revealed differences in the HI, minT, IL and CK, but we cannot compare these results with previous findings since this metric was not explored by a field position yet. Nevertheless, previous studies have suggested that high force production capabilities of professional players are associated with the reduced post-match markers of muscle damage (CK activity) (Owen et al., 2015). Therefore, a well-developed strength and conditioning program may ensure quick recovery after the match. The analysis of variance between playing positions revealed that MF had significantly greater levels of the internal load than the remaining playing roles and that CD presented the smallest values. Nevertheless, future studies should analyze differences between playing positions considering physical status and specific conditioning of athletes.
Research indicates that blood markers such as CK are sensitive to fatigue in team sport players (Hecksteden et al., 2016). In this line, this study shows significant differences in CK activity between different match days. The higher activity was found on MD+1, corroborating previous results that high intensity match activities influence CK in the 24 h (Russell et al., 2016). This high impact may justify the decrease in strength performance by the mechanical disruption of the fiber, namely the membrane damage, myofibrillar disruptions and loss of Z-disc integrity (Raastad et al., 2010).
This study has several limitations. Considering the study sample, our findings may only be relevant to professional soccer players. Nevertheless, the amount of data collected during the season and results similar to those of previous studies suggest that some findings can be generalized. Moreover, objectively-measured external loads were not used in this study. Such indicators may help establish an association with CK activity. GPS variables could be crossed with CK activity in future research.
Despite the above mentioned limitations, this study is the first reporting a full-season period using biomarkers and well-being variables. These findings contribute to verifying the effectiveness of such tools and provide scientific evidence for practitioners. The highlighted sensitivity of these potential markers of fatigue to changes in training and match loads may help coaches and sport scientists in training prescription and recovery management for elite athletes over both acute (daily) and extended periods of time. Biomarkers may allow coaches to identify the biological responses to loads imposed during training sessions in an objective manner. However, such analysis may not be affordable for the majority of clubs. On the other hand, perceptive scales can be used massively based on their easy-to-use process and the relative good sensitiveness to load imposed during training sessions.
Practical Implications
The present results indicate that the internal load is significantly higher in weekly microcycles with one match than with two. Interestingly, in the weeks with only one match the Hooper index and CK activity were also higher. Based on that, coaches should be aware that using the perceived scales would be a very useful approach and an appropriate method to monitor the effects of training loads in elite professional soccer players. Daily application of perceived scales should be employed at any competitive level based on the low-cost and efficiency of the method. Future studies may consider using these monitoring techniques to change individual training loads and link them with injury reports. Moreover, the CK activity is also sensitive to training load variation, thus it is suggested to be an interesting variable to monitor the mechanical effects of training sessions and to control non-functional overreaching.