Introduction
In soccer, a wide spectrum of different trajectories during acceleration maneuvers is usually performed (i.e., linear sprints, curve sprints [CS], and change of direction [COD] tasks) (Jeffreys et al., 2018). Results of motion analysis demonstrate that soccer players perform ~700 turns during official matches, most of which are at 0-90° (Bloomfield et al., 2007), and the vast majority of the sprints performed in soccer are not purely linear, but with a degree of curvature (~85%) used to evade, track, or draw an opponent (Fitzpatrick et al., 2019; Caldbeck, 2020). Exposure to speed training programs designed according to specific game demands (the concept of “gamespeed”) is crucial for any player wishing to maximize soccer performance (Jeffreys et al., 2018). In this sense, players in different positions could benefit from more specific conditioning programs and testing routines (Bloomfield et al., 2007; Maszczyk et al., 2011; Fitzpatrick et al., 2019). This means that practitioners should consider individual multidirectional sprint tests which are specific to the movement demands of soccer to detect actual (and effective) changes in speed-related performance.
The inclusion of COD speed and maneuverability measurements is recommended in testing batteries for soccer players (Arcos et al., 2020; Cuthbert et al., 2019; Dos’Santos et al., 2018, 2019; Loturco et al., 2020). As such, a variety of COD speed measurements have been used by practitioners to assess multidirectional speed ability in soccer players, (i.e., T-test, COD90⍛, 5-0-5 agility test) (Brughelli et al., 2008; Turner et al., 2011), but none of them includes curvilinear sprints or assesses the isolated ability to sprint over curvilinear trajectories. From a directional approach, a CS test is considered a hybridization between a linear sprint and a COD drill (i.e., COD: a test that contains a clear lateral foot plant to initiate the COD) (Fílter et al., 2019; Nimphius, 2014). In terms of relationships, some of correlations between COD and straight speed performances would be described as moderate (r = 0.3–0.5) in different level and sport populations (i.e., college students, Australian football players) and different types of COD tests (i.e., T-test, 20-m COD [three 90⍛ CODs]) (Brughelli et al., 2008). In fact, the magnitude of correlations seems to be influenced by the COD characteristics (i.e., angles and numbers) (Rouissi et al., 2016; Young et al., 2002), and a sport population (i.e., soccer, volleyball, basketball, handball) (Šimonek et al., 2017). Specifically, in soccer players, moderate correlations (r = 0.35) have been observed between straight running and Zigzag COD test (4 x 5 COD with 100º) completion times (Little and Williams, 2005); however, no significant correlations have been found between other COD tests (i.e., 505 and T-test) and linear sprint performance (10-, 20-, 30m) (Çınarlı et al., 2018).
In this regard, a similar significant association has been observed between linear and curvilinear speed (Fílter et al., 2019). In fact, despite being considered to be independent physical qualities (i.e., 35% shared variance), linear and CS actions exhibit a large interrelationship (r = 0.58), which means that at least part of a given increase or decrease in a specific scale is common between these capacities. Nonetheless, to date, no study has directly examined the relationship between the COD-90⍛ speed test and curved sprinting; two apparently similar non-linear actions.
Given the unpredictable nature of soccer, being equally fast at changing direction during COD maneuvers and efficient at performing both right (clockwise) and left (anti-clockwise) curvilinear sprints would be beneficial from a performance perspective. In this sense, not only performance association is relevant, but also analyzing the magnitudes and directions of interlimb asymmetries, which would aid understanding of the similarities between both tasks. Recently, there has been a rise in the number of studies investigating the magnitude and direction of interlimb functional asymmetries (i.e., assessed, for example, in vertical and horizontal jumps, or COD tasks) and asymmetries in some specific neuromuscular qualities (DosʼSantos et al., 2019; Madruga-Parera et al., 2019, 2020; Raya-González et al., 2020). Nevertheless, despite being a frequently used action (Caldbeck, 2020; Fitzpatrick et al., 2019), none of the studies considered curvilinear sprints. For example, in a study with female youth netball players, Dos’Santos et al (2019) reported asymmetries of ~2% and ~12% for 5-0-5 test completion times and COD deficits (time difference from linear sprints), respectively. The authors concluded that quantifying asymmetries based on COD completion times may produce a misinterpretation (i.e., lower percentage imbalances) of an athlete’s symmetry in COD ability, which could mask deficiencies in COD performance (DosʼSantos et al., 2019). However, this deficit-based analysis cannot be performed between curved and linear paths due to possible similar records (Fílter et al., 2019, 2020; Ohnuma et al., 2018). Another study conducted with elite youth soccer players found asymmetries of 4.6% and 3.02% for both COD-90⍛ tests (5 + 5 and 10 + 10 m, respectively), highlighting that asymmetries vary across commonly used tests without significant interrelationships (Bishop, 2020; Raya-González et al., 2020). In this line, knowing the differences between clockwise and anti-clockwise completion times would contribute to obtaining asymmetry thresholds in curvilinear sprints, and comparing these values with the COD-90⍛ measurement.
Given the limited research investigating curved sprinting in soccer players, and the lack of investigations regarding the relationship between COD speed and CS abilities, the aims of this study were to: (a) analyze the relationships between linear sprint, CS, and COD speed performances, and (b) compare the associations and direction of asymmetries between CS and COD speed tests. We hypothesized that (a) limited and non-meaningful associations would be observed between CS, linear sprint, and COD speed performance, and (b) limited and non-meaningful associations would be detected between CS and COD speed asymmetries.
Methods
Participants
Thirty-three semi-professionals (3rd Spanish division) male soccer players volunteered to participate in this study (age: 23.4 ± 0.8 years; body height: 1.78 ± 0.50 m; body mass: 74.2 ± 8.4 kg). Subjects were excluded if they presented any injury at the time of testing. Tests were completed during the third month of the competition period (nine-month season). Written consent forms were obtained from all participants. The study was conducted in accordance with the Declaration of Helsinki and was approved by the Catalan Sports Council Ethics Committee.
Design and Procedures
Following a cross-sectional design, a sample of soccer players performed 90⍛-change of direction, CS, and linear sprint tests of 17 m each. Accordingly, interlimb asymmetries in CS and COD speed tests were examined. Correlational analyses were also used to determine the relationships between the multiple tests and the magnitudes of asymmetries between COD speed and CS assessments.
Participants arrived at our facilities prior to the first training session of the week having been instructed not to eat for the preceding 2 hours and avoid caffeine consumption for at least 24 hours before the tests. All athletes were familiarized with the testing procedures. Participants were tested on two different days, separated by 72 hours. Day 1 consisted of a 17 m linear sprint and the 90⍛ COD speed assessment. On day 2, players performed the 17 m CS test.
Each participant completed a specific warm up consisting of five minutes of light jogging and dynamic stretches for the lower body (such as multi-directional lunges, inchworms, bodyweight squats, and sprint drills). Upon completion, three practice trials were provided for each test and participants were instructed to perform them at 75, 90 and 100% of their perceived maximal effort. Three minute rest intervals were allowed between all trials. The tests were executed on synthetic field turf.
To perform the tests players began in a staggered two-point stance 0.5 m behind the start photocells. Completion times were measured via photocells (Witty, Microgate, Bolzano, Italy). The photocell height was individually adjusted to match each athlete’s ground-to-hip height. The fastest time of the three trials was used for further analysis.
Measures
Linear Sprint test: Participants were required to perform a linear sprint for a total distance of 17 m as fast as possible, in line with previous research (Fílter et al., 2019). Each trial was separated by a 3-minute rest interval.
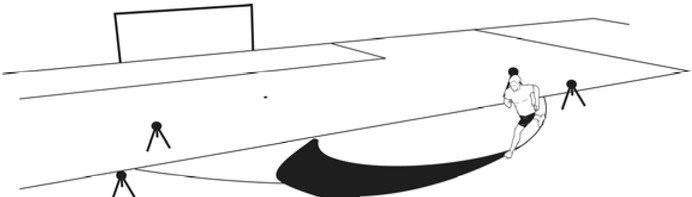
Change of direction speed test: For the COD test we used the recommendations of Maloney et al. (2016) who reported intraclass correlation coefficients (ICCs) of 0.95 and 0.97 (within- and between-session ICCs, respectively). Both sides of the COD (right direction and left direction) were assessed in a single 90⍛ COD for a total distance of 17 m (Figure 1). A guideline was used as a reference and the path was delimited with cones to avoid curvilinear paths. Three successful trials for each side were performed. The trial was considered successful if the player performed a clear lateral foot plant at the turning point. Each trial was separated by a 3 minute rest interval.

Curve sprint test: For the CS assessment we used the recommendations of a previous study (Fílter et al., 2019) which showed a reliable standardized test performed on the penalty arc line as a guideline (Figure 2). Left (anti-clockwise) and right (clockwise) curves were assessed. In order to unify terminology with COD research (Maloney et al., 2016; DosʼSantos et al., 2019; Madruga-Parera et al., 2019), a dominant and a non-dominant curve (fastest and slowest side in completion time, respectively) were used. Players were instructed to follow the penalty arc line and performed three trials in each direction in randomized order. If the player did not run within the penalty arc lines, the trial was disqualified and repeated following the rest period. Regarding reliability, the coefficient of variation (CV) and the intraclass correlation coefficient (ICC) were calculated, with 2% and 0.87 for each coefficient, respectively. Each trial was separated by a 3 minutes rest interval.
Statistical analyses
Inter-limb asymmetries in COD and CS tests were quantified as a percentage difference between limbs using the formula: (100/(maximum value)*(minimum value)*-1+100), as proposed by Bishop et al. (2018). In order to determine the direction of asymmetry, an “IF function” was added to the end of the formula in Microsoft Excel: *IF (left<right, 1, -1) (Bishop et al., 2020).
Analyses were performed using JASP for Mac (version 0.11.2; JASP Team (2019), University of Amsterdam, the Netherlands) and IBM SPSS Statistics for Mac (v.25, IBM, New York). Normal distribution of the data was checked using the Shapiro-Wilk test. Data not following a normal distribution were log-transformed (Field, 2013) before further analysis.
To examine performance differences between directions, paired-samples t-tests were used. Effect size (Cohen’s dz) calculations were performed on pairwise comparisons, which were computed using the formula dz = t/√(n) (Lakens, 2013). Effect sizes were interpreted as: < 0.2 = trivial; 0.2-0.6 = small; 0.6-1.2 = moderate; 1.2-2.0 = large; > 2.0 = very large (Hopkins et al., 2009).
To assess the relationships between the performance test scores and between asymmetry scores of each test, Pearson’s product moment correlation coefficients (r) were computed. The correlation coefficients were interpreted as follows: r = 0.0–0.1 = trivial, 0.11–0.3 = small, 0.31– 0.5 = moderate, 0.51–0.7 = large, 0.71–0.9 = very large, and 0.91–1.00 nearly perfect (Hopkins et al., 2009). The determination coefficient (r2) was calculated to establish the degree of shared variance between tasks. The level of significance was set at 0.05 for all tests.
Results
Mean and asymmetry scores and reliability data are presented in Table 1.
Table 1
Interlimb neuromuscular test scores and reliability data for each test.
[i] * p < 0.05, compared with non-dominant; ASY: Asymmetries; CI = confidence intervals; CV = coefficient of variation; COD = change of direction; CS = Curve sprint of 17m; d = Cohen’s dz; D = Dominant (fastest side); ICC: intraclass correlation coefficient; ND = Non-dominant (slowest side); Sprint = linear sprint test of 17 m; s: Seconds.
The relationships of performance times between assessments are presented in Table 2. The linear sprint speed demonstrated large relationships with all performance test scores (r = 0.60 – 0.64, p < 0.001). The CODLEFT variable showed a very large relationship with CODRIGHT (r = 0.81, p < 0.001) and a moderate relationship with CurveRIGHT (r = 0.38, p < 0.05). The CODRIGHT variable presented moderate relationships with CurveLEFT (r = 0.41, p < 0.05) and CurveRIGHT (r = 0.35, p < 0.05). The CurveLEFT showed a large relationship with CurveRIGHT (r = 0.66, p < 0.001).
Table 2
Relationships [percentage of shared variance] (Pearson’s coefficient of correlation) between performance score tests with 95% confidence intervals.
The coefficients of determination revealed that shared variance between variables was limited (Table 2). Linear sprint speed shared between 36 and 41% of variance with COD speed and CS measurements. In addition, the shared variance reduced between the COD speed and CS measurements, with a shared variance between 11 and 16%.
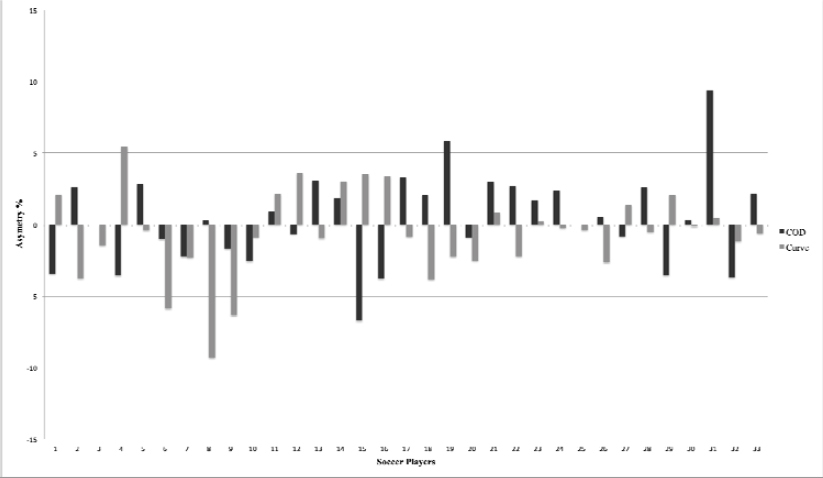
No significant relationship was reported between COD speed and CS speed asymmetry data (r = -0.05; p > 0.05). In addition, Figure 4 shows that ~70% of participants presented asymmetries in opposite directions between the CS and the COD tasks.
Discussion
The main findings of this study were: (a) the multidirectional measurements (assessed via the 90⍛ COD speed and CS tests) were largely correlated with linear sprint tests, and (b) a moderate relationship was observed between multidirectional tests (COD speed and CS tests) with a certain “opposite tendency” (a higher relationship between opposing directions [CurveLEFT - CODRIGHT; r = 0.41] than between equal directions [CurveLEFT – CODLEFT; r = 0.33]), and c) there were no meaningful relationships between COD speed and CS asymmetries. This indicates that direction dominance during COD tasks does not necessarily imply the same directional dominance during curved sprinting (and vice versa). The data of the present study support previous studies in relation to the association between linear speed and CS performances in semi-professional soccer players (Fílter et al., 2019), and the association between COD and linear sprinting (Little and Williams, 2005); nevertheless, this is the first study to examine the relationship between COD (via the 90⍛ COD speed test) and CS speed in semiprofessional soccer players.
Figure 3
Individual direction of asymmetry scores for the COD speed and curve sprint tests. Above 0 line means asymmetry favors the right and below 0 line means asymmetry favors the left side.
Filter et al. (2019) examined the association between linear speed and CS (35% shared variance), with similar results to those reported in this work (r = ~0.58). More recently, Loturco et al. (2020) reported large to very large relationships (0.67-0.76) between linear and CS velocities in elite young soccer players, suggesting that these differences may be related to distinct sample characteristics (i.e., semi-professional versus elite youth soccer players). In addition, the large relationship between linear and multidirectional tasks (COD-90⍛ and CS test [r from 0.6 to 0.64]) could be explained by common elements between these respective short all-out efforts (i.e., player’s acceleration capacity), and the reduced shared variance (i.e., ≤ 40%) as a consequence of their independent and particular features (e.g., specific cutting and arced maneuvers) (Young et al., 2001). This issue certainly deserves further investigation.
Although researchers have examined the relationship between linear speed and COD speed performance in soccer players (Buttifant et al., 1999; Little and Williams, 2005; Suarez-Arrones et al., 2020), only one study has examined the associations between COD and CS speed in semiprofessional soccer players, reporting “large” relationships between these variables (from 0.54 to 0.60) (Freitas et al., 2020). However, unlike this work, that study assessed COD maneuverability for both sides during multiple directional changes within the same task (i.e., Zigzag test), without calculating and considering inter-limb asymmetries in COD and CS measurements in its rationale.
The novel finding of this study is the limited association between single 90⍛ COD speed and CS tests, with a shared variance of ~11%. Thomas and Nelson (1990) state that ”when common variance between two variables is less than 50%, this indicates that they are specific or somewhat independent in nature”. Thus, although a turning degree can affect the magnitude of the relationship between non-linear actions (Brughelli et al., 2008; Young et al., 2001) (e.g., a higher ratio between sharp COD and curvilinear sprint), COD speed (assessed via the 90⍛ COD speed test), and CS, at least for this population of semiprofessional soccer players, they may be considered independent skills and, as a consequence, should be evaluated and likely trained separately.
From a training perspective, a previous study (Young et al., 2001) examined the effect of linear sprint training on COD speed, concluding that linear sprint training has limited ability to transfer to COD performance. However, association does not necessarily imply causation, and this cross-sectional study requires longitudinal data to examine the effects of increasing linear sprint velocity on COD speed and CS performance. Although this study focused on the physical components of multidirectional sprints, the role of perceptual skills, such as reacting to the visual presence of the ball and opponents, could also be considered in further research.
Trivial and non-significant relationships between COD asymmetries and CS asymmetries were found, confirming the task-dependent nature of inter-limb asymmetries. When individual magnitude and directional asymmetry percentages were examined (Figure 4), ~70% of soccer players (22/33) were categorized inversely in terms of the direction of asymmetries when using COD or CS tests. In summary, this means that players who had asymmetries for one side in the COD test presented an opposite direction in the CS test.
Based on the findings reported in previous studies, it seems logical that asymmetries between CS and COD-90⍛ will exhibit opposite directionality in most soccer players analyzed. In fact, most compelling evidence is in favor of the greater contribution of the outside leg during COD tasks (Young et al., 2002), and the inside leg during curvilinear sprints (Chang and Kram, 2007; Filter et al., 2020). Young et al. (2002) concluded that the outside leg would exert more influence than the inside leg in turning movements if the movements require a “clear lateral push-off action” (i.e., COD-90⍛). Conversely, during maximum effort, a reduction in peak resultant ground reaction force by the inside leg plays a significant role in limiting speed during curvilinear paths (Chang and Kram, 2007; Filter et al., 2020). Furthermore, this study obtained a higher relationship between COD and CS on opposite sides than on equal sides (Table 2). The present research provides findings suggesting that COD (assessed via the 90° COD speed test) and CS abilities are opposite qualities in terms of directional dominance.
The 90° COD speed assessment requires drastic deceleration during turns, which does not occur during curved paths. In contrast, stronger relationships between curved sprinting and COD speed could be observed using “shallower cuts” (i.e., angles of 30-45°) where there is a greater reliance on velocity maintenance and a reduction in braking requirements (Young et al., 2001). Not including other turning degrees (e.g., 45º degrees) could also be considered a study limitation. Additionally, it should be noted that the findings of this study are representative of semiprofessional soccer players; thus, caution is advised when generalizing these findings to athletes of different age-categories or performance levels. Future research is required to apply the COD and CS asymmetries to cutting tasks in a variety of cutting sports to provide information on how COD or CS asymmetries may differ between different levels and populations of athletes.
Conclusion
The main findings of this study reveal that CS and COD-90⍛ abilities are moderately correlated, thus, should be evaluated and trained separately, at least for this population, when using these protocols. In addition, large relationships were reported between linear and multidirectional tasks (i.e., COD-90⍛ and curve sprinting). These results indicate that performance in linear sprints is strongly related and greatly influences performance in multidirectional trajectories, whereas CS and COD-90⍛ seem to be more independent actions. Therefore, practitioners should use COD, CS, and linear sprint tests as different testing categories, with the aim of obtaining a more complete picture of multidirectional speed performance. In terms of asymmetries, a new variable (CS asymmetry) could be considered in team-sport testing in order to detect players’ magnitude and directions of inter-limb asymmetry and to establish the dominant curve side of each soccer player, which could contribute to better characterizing and profiling playing positions.