Introduction
Basketball is a high-intensity complex team sport characterized by the interaction of tactical, technical, psychological and physiological components (Stojanović et al., 2018). Multiple explosive jumps, sprints, accelerations, decelerations, and changes of direction based on specific movements such as shooting, rebounding, defending and dribbling are key factors for match-play performance, particularly two-point shots and defensive rebounds (Malarranha et al., 2013). Thus, understanding the physical demands encountered during competition could help strength and conditioning coaches and sport scientists to optimise players’ preparation.
Game demands in senior players have been described using video-based movement analysis methodologies (Torres-Ronda et al., 2016), which are based on a subjective visual prediction of the intensity and activity pattern load (Hulka et al., 2014). In addition to the emergence of global positioning systems for outdoor activities (Puente et al., 2017), advances in technology have permitted the use of inertial micro-sensors to quantify physical demands such as high-intensity accelerations and decelerations, among others, in semi-professional (Fox et al., 2018; Scanlan et al., 2019) and professional male basketball players (Svilar et al., 2018; Vázquez-Guerrero et al., 2018) during competition.
While some information is available about physical demands in senior players during games, little is known about youth basketball (Ben Abdelkrim et al., 2010). In addition to video analysis, inertial microtechnology combined with local positioning systems (LPS) have also enabled sports professionals to obtain positional data in U18 players during elite basketball tournaments (Vázquez-Guerrero et al., 2019a, 2019b). Comparisons between game physical demands across different age-groups and senior basketball are important to understand age-specific requirements and adapt the training process. Although understanding the demands placed upon youth players in basketball competition could have practical implications for training prescription and talent identification (Vaeyens et al., 2008), the authors are not aware of any studies that have addressed the physical requirements of elite youth basketball matches across a range of different age groups.
Although the most common method used to analyse player physical exertion during competition has been the study of the average demands, in recent years, state-of-the-art technology has rendered it possible to quantify the most demanding scenarios of match-play in numerous intermittent team sports such as soccer, rugby, Gaelic football and Australian football using different rolling averages (Whitehead et al., 2018). This novel methodology examines the predefined time frames, for instance 30, 60 or 120 s, with the greatest demands on any physical variable chosen, namely total distance covered, high-speed running or the number of high-intensity accelerations. Current research using microtechnology has utilized a traditional approach with average values to describe the physical demands of basketball competition (Scanlan et al., 2019; Vázquez-Guerrero et al., 2018, 2019a, 2019b) and to compare physical requirements between match play and training sessions (Fox et al., 2018; Svilar et al., 2018). Nevertheless, the use of average game demands for a training task design could result in under-preparation for the most demanding scenarios of basketball competition (Gabbett et al., 2016), also known in the existing literature as the most demanding passages and worst case scenarios (Martín-García et al., 2018). In addition to improving training, the identification of the most demanding scenarios would also optimise rehabilitation programs geared towards restoring a player’s specific fitness and locomotor performance related to the peak physical demands required during match play. To date, the authors are only aware of one preliminary study that has reported the most demanding scenarios during one official basketball game, covering only total distance and player load data (Salazar and Castellano, 2019).
The aim of this study was therefore to compare a traditional average physical demand approach to the most demanding 60-s scenarios (60-MDS) between youth (Under-12, Under-14, Under-16 and Under-18) and senior basketball players during official competition. We hypothesised that 60-MDS values would be significantly higher than average values. Additionally, since physiological characteristics, tactics and competition structure could influence physical demands across age groups, it was also assumed that physical game responses would tend to increase gradually with age. These data are likely to provide an important practical insight for training and game performance optimisation.
Methods
Participants
The participants in this study were male basketball players (mean ± SD, age: 15.03 ± 2.87 years; body height: 187.2 ± 15.1 cm; and body mass: 75.3 ± 18.2 kg), who belonged to an elite basketball academy of an Euroleague team and competed in five different age groups, classified as Under-12 (U12), Under-14 (U14), Under-16 (U16), Under-18 (U18), and a senior second team (Table 1). Besides the senior team, who participated in the second Spanish professional league (LEB gold), U18, U16, and U14 teams competed at the highest possible regional level. Senior to U14 games were based on FIBA rules, consisting of 4 quarters lasting 10 min, with a 2-min rest period between quarters and a 15-min recovery time between halves. Additionally, the U12 team competed in an older age category, namely the Under-13 (U13) level, according to a modification of the FIBA rules, which were: 1) the ball size was 5; 2) games consisted of eight 5-min periods; 3) all players had to play a minimum of 2 periods and a maximum of 6; 4) player substitutions were only allowed in the last 2 periods. All matches were completed on the same court under similar environmental conditions and players were allowed to consume water ad libitum during rest periods. The five teams usually played one game during the weekend after a standard warm-up protocol that included dynamic stretching, mobility, and basketball-specific individual skill work. In addition, during each microcycle, all five age group teams followed a specific holistic methodology called “structured training”, which has been developed by FC Barcelona with the purpose of preparing athletes to compete in team sports (Gómez et al., 2019; Tarragó et al., 2019). This study was performed in accordance with the provisions of the Declaration of Helsinki (Harriss and Atkinson, 2015), and no ethics committee approval was required as the data were obtained routinely during player league games (Winter and Maughan, 2009). Furthermore, players and their parents provided their written consent after the purpose of the investigation and the research protocol along with requirements had been explained to them.
Table 1
Anthropometry results and training volume according to age
Design and Procedures
The observational design was used to compare physical demands between youth and senior elite basketball using two different methods. Match demands were collected from sixty-four basketball players during eight official home games per age group of the 2018-2019 Spanish competitive basketball season (December-May). Players who completed less than 10 min in a match were excluded, resulting in a total of 344 single records.
Measures
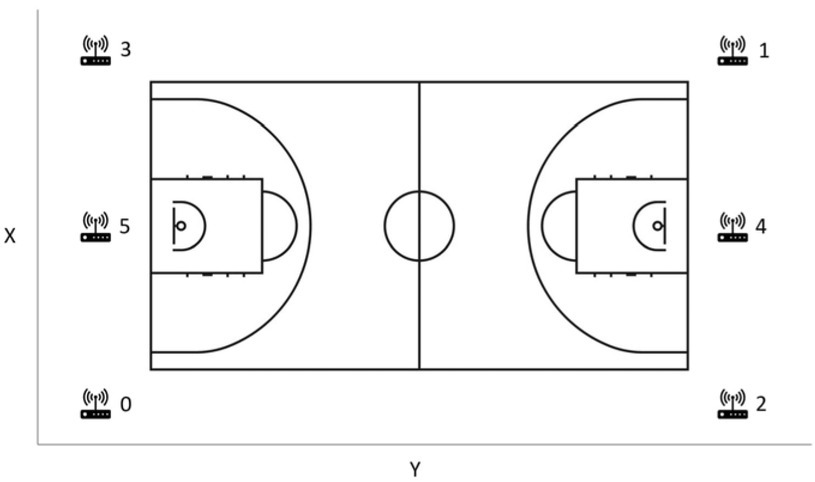
Basketball player movements were monitored during the matches using the WIMU PRO™ system (Realtrack Systems S.L., Almería, Spain), which has shown good/acceptable accuracy and inter- and intra-unit reliability for ultra-wide band positioning (Bastida-Castillo et al., 2018, 2019) and has been used in previous investigations during basketball competition (Vázquez-Guerrero et al., 2019a, 2019b). The WIMU PRO™ inertial devices (81 x 45 x 16 mm, 70 g) were fitted in a custom vest located on each player’s upper back using an adjustable harness, as recommended by the manufacturer (IMAX, Lleida, Spain). The inertial measurement units included four 3-axis accelerometers (100 Hz sample frequency), a gyroscope (100 Hz sample frequency), a 3D magnetometer (100 Hz sample frequency), a barometer, a GPS device (10 Hz sample frequency), and an ultra-wide band positioning system (18 Hz sample frequency). Following the manufacturer’s instructions, a total of six antennas were connected, calibrated, and located forming a rectangle to enhance signal emission and reception (Figure 1). Data were downloaded and analysed using the manufacturer’s specific software (SPRO™, version 950, RealTrack Systems, Almería, Spain).
Figure 1
Ultra-wide band positioning system on a basketball court. Note: X is court width, y is court length and z is height of the antenna. Numbers show the disposition of antennas in cm: 0 is x = 0, y = 0, z = 600; 1 is x = 2924, y = 5208, z = 600; 2 is x = 0, y = 5208, z = 600; 3 is x = 2928, y = 7, z = 600; 4 is x = 1469, y = 5207, z = 600; and 5 is x = 1456, y = 2, z = 600.
Similar to previous research which used the same physical demand variables to examine U18 basketball competition with the same equipment (Vázquez-Guerrero et al., 2019a, 2019b), four performance variables were selected to monitor player physical demands, such as total distance covered, distance covered >18 km·h-1 (high-speed running), and the number of high-intensity accelerations (≥2 m·s-2) and decelerations (≤-2 m·s-2). While distance was measured via positional differentiation (change in location within each time instant), acceleration was calculated via double differentiation from the positional data recorded by LPS (Malone et al., 2017). To permit comparisons between players with different playing times, all four variables were normalized by the total time spent on the court, excluding only breaks between periods and including all stoppages in play such as free-throws (Vázquez-Guerrero et al., 2019a, 2019b). Consequently, distance values were expressed in m·min-1 and the number of accelerations and decelerations in n·min-1. Furthermore, 60-MDS during match-play were also analysed using a rolling average over each physical demand variable and only the maximum value for the 60-s time frame was recorded. With sampling of 18 Hz, WIMU PRO™ software identified 1080 consecutive data points (e.g., 18 samples/s for 60 s) and average values were calculated using the current and the 1060 preceding samples. It is important to note that the 60-MDS for each variable was calculated independently and may have come from different game moments. The 60-s pre-defined time frame choice was justified on the following grounds: 1) the possibility of comparison with average physical demands during competition; and 2) basketball’s intrinsic intermittent nature only permits a few continuous match-play periods lasting more than one minute (Salazar and Castellano, 2020).
Statistical Analyses
The descriptive statistics for the outcome measures were calculated using mean and standard deviations. After testing for normality and homogeneity of variances, the t-test was performed to compare average values and 60-MDS. Furthermore, one-way analysis of variance (ANOVA) and Holm post-hoc pairwise comparisons were also performed to detect differences between age groups. All data analyses were performed using R Studio Statistical software (The R Foundation for Statistical Computing, Vienna, Austria) and statistical significance was set at p <.05. Additionally, comparison among age groups was assessed via standardised (Cohen) mean differences and their respective 90% confidence intervals (90% CI). Thresholds for effect size (ES) statistics were <0.20, trivial; 0.20-0.59, small; 0.60-1.19, moderate; 1.201.99, large; and >2.0, very large (Hopkins et al., 2009).
Results
Total game duration for each age group was as follows: 84.2 ± 5.0 min in seniors; 72.8 ± 11.1 min in U18; 76.2 ± 6.1 min in U16; 74.6 ± 11.3 min in U14; and 64.6 ± 5.0 min in U12. Thus, the average total game duration in youth basketball was lower than senior basketball, namely 13.5% in U18, 9.5% in U16, 11.5% in U14 and 23.4% in U12.
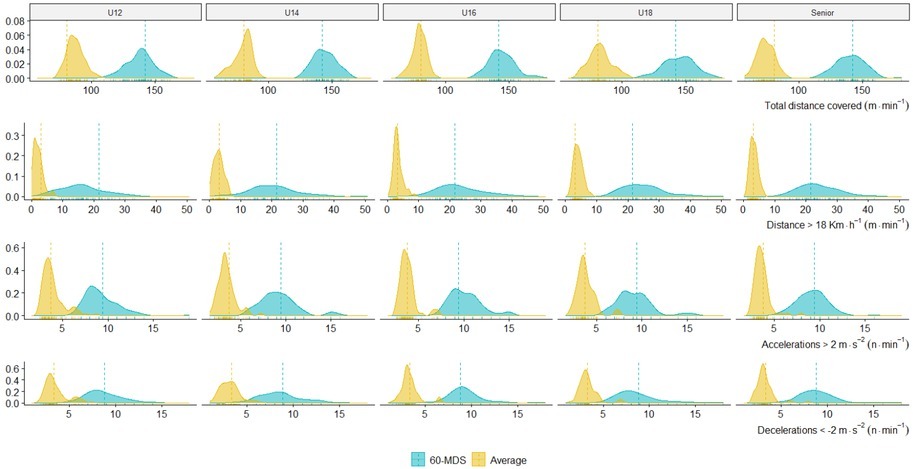
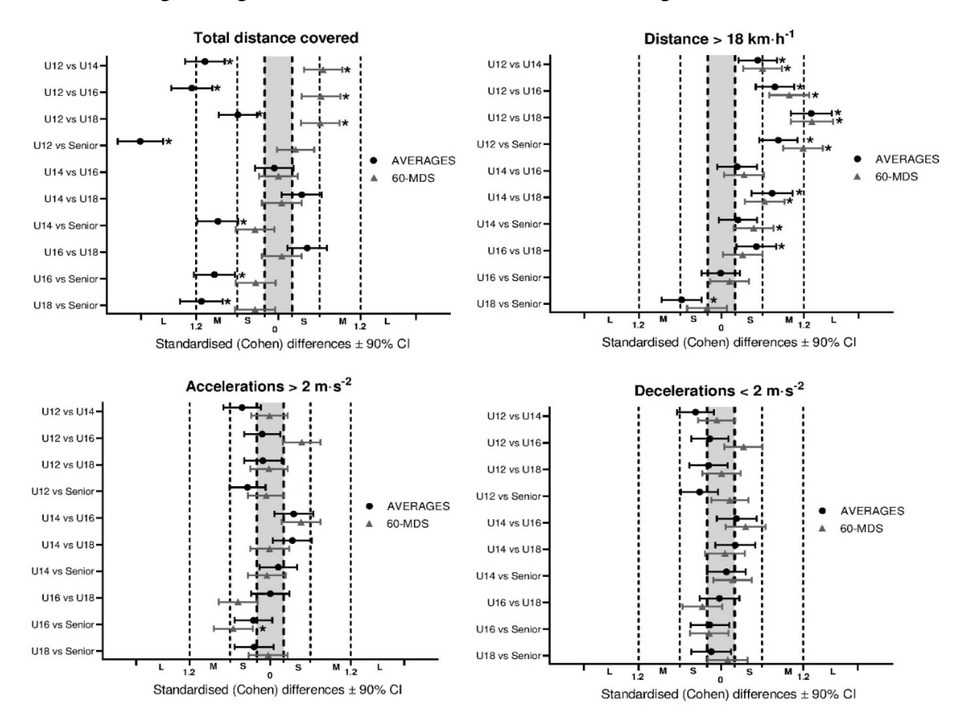
The physical demands for all five age groups examined, and the percentage difference between average values and 60-MDS are shown in Table 2 (means and SD). Furthermore, Figure 1 shows data distribution across age groups, whereas Figure 2 presents significant differences, standardised mean differences and 90% confidence intervals (CI).
Figure 2
Density plot between the five teams for the four physical demand variables selected. Note: Average and 60-MDS demands were significantly different for all variables and within all age groups. U12 is the Under-12 age group, U14 the Under-14 age group, U16 the Under-16 age group, U18 the Under-18 age group and senior is the senior team competing in the Spanish professional LEB gold league. 60-MDS are the 60-s most demanding scenarios.
The highest average results in total distance covered were found in the U12 age group, whereas the U18 team achieved the greatest value in 60-MDS. Additionally, the senior team achieved the greatest difference between averages and 60-MDS in total distance covered (90.3%) and the standardised difference between U12 and Senior teams was found to be the only very large effect of all the comparisons. Conversely, the U18 age group presented the highest values in both average and 60-MDS in high-speed running, with a difference of 521.3%. This load variable presented large effects between U12 and U18 in both average and 60-MDS values.
High-intensity accelerations and decelerations presented a similar pattern: the highest mean results were achieved by the U12 team, whereas the greatest values in 60-MDS were observed in the U16 age group. Similarly, the differences between averages and 60-MDS ranged from 136.4 to 179.4%. All effect sizes related to high-intensity accelerations and decelerations were trivial to small.
Table 2
Means (±SD) in selected physical demands for the five teams examined
Figure 3
Standardised differences (Cohen’s d) and the 90% confidence intervals between the five teams for the four physical demands variables selected. Note: Significant difference is reported with * at the right end of the 90% CI bar. U12 is the Under-12 age group, U14 the Under-14 age group, U16 the Under-16 age group, U18 the Under-18 age group and senior is the senior team competing in the Spanish professional LEB gold league. 60-MDS is 60-s most demanding scenarios.
Discussion
The purpose of this research was to compare the average physical demands and 60-MDS of match-play in different youth age groups and senior basketball players. The main findings of this study were that differences of up to 639.2% between average values and 60-MDS were found. Additionally, total distance covered and high-speed running were significantly different across the teams evaluated using both average and 60-MDS values. These differences may be partly explained by the basketball players’ maturation level and team-specific playing models.
Average physical demands and 60-MDS values presented significant differences in all four game performance variables between the five age group teams examined. The present investigation found a greater difference (range = 58.1–90.3%) in total distance covered between average physical demands and 60-MDS than the available research in elite soccer (Varley et al., 2012) and rugby sevens (Furlan et al., 2015), which presented a difference of 25.0% and 38.3% in 5-min and 2-min time intervals used to examine peak demands, respectively. Besides total distance, the high percentage increments in high-speed running (521.3-639.2%) and high-intensity accelerations and decelerations (136.4-179.4%) confirmed that average physical demands substantially underestimated peak requirements during basketball competition. Therefore, knowledge of the upper limit physical demand thresholds during official basketball competition in five different age groups could help basketball professionals enhance training and return-to-play programs, as well as optimise the early talent detection of highly trained young players.
In addition to the differences between the two methodologies, the four performance variables analysed also presented multiple differences between age groups. Conversely to previous research in soccer, in which match running performance showed an increasing trend with age (Buchheit et al., 2010), this study found that relative total distance covered was significantly higher in the U12 team compared to their older counterparts (p <.001; U14 ES = 1.07; U16 ES = 1.26; U18 ES = 0.59; Senior ES = 2.01). On the contrary, senior players’ relative total distance was significantly lower than in the other four youth teams assessed (p <.001; U12 ES = 2.01; U14 ES = 0.88; U16 ES = 0.93; U18 ES = 1.12). Two possible explanations were found: 1) players with greater experience tended to present lower values in physical demands due to better decision-making and game interpretation (Petway et al., 2020); and 2) the total time used to calculate relative values in the current research was higher in senior (9.5 to 23.4%) than youth basketball due to an increased number of game stoppages such as fouls, free throws and time-outs. Besides average physical values, 60-MDS of match-play presented significant differences and moderate effects in total distance between U12 and U14 (ES = 0.65); U12 and U16 (ES = 0.62); and U12 and U18 (ES = 0.61). Particularly, the U12 team presented the lowest values (137.8 ± 10.5 m), which could be attributed to physiological factors since physical capacities were shown to increase with growth (Papaiakovou et al., 2009). Curiously, the senior basketball team did not achieve the highest results during the 60-MDS, which could be accounted for a combination of tactical and game-related factors.
Both average physical demands and 60-MDS presented an increasing tendency with age when high-speed running was evaluated in basketball players. More concretely, the U12 age group achieved the lowest values and showed significant differences with the other four teams in both analysis methodologies. Furthermore, the U14 age group presented lower results compared to the U16, U18 and senior teams. These findings are in agreement with similar studies in soccer which reported a significant improvement in sprint performance between the ages of U14 and U15 (Mujika et al., 2009), probably influenced by maturation. Due to the fact that the average age at the onset of puberty has been suggested as 13.5 years for boys (Stratton et al., 2004), U14 and U12 basketball players may have encountered great difficulties in this study to achieve velocities above >18 km·h-1 and accumulate high-speed running distance. Thereby, using fixed speed thresholds would seem to be inappropriate for quantifying high-speed running distance in youth players.
Although total distance and high-speed running demonstrated multiple significant differences and numerous moderate to very large effect sizes between the four age groups and senior basketball, high-intensity accelerations and decelerations presented little variation, with all standardised effect sizes ranging from trivial to small. Following the analysis of these two inertial-derived variables, the U12 team showed the highest average results, which could be explained by their lower game duration, tactical reasons and the modifications of the FIBA rules used. Additionally, 60-MDS presented significant differences in high-intensity accelerations between the U16 age group and the other four teams investigated. Since U18 basketball players have reported peak accelerations up to 3.6 m·s-2 during official matches (Vázquez-Guerrero et al., 2019c), the use of the 2 m·s-2 threshold might have been insufficient to categorize accelerations as high-intensity effort and to identify significant differences between youth and senior basketball players. Therefore, the authors recommend: a) the use of a 3 m·s-2 threshold to describe high intensity accelerations, and b) the addition of a qualitative analysis to associate acceleration values with specific basketball actions across different ages.
A potential limitation of the present research is the fact that all teams monitored belonged to the same club and played under the same basketball philosophy. Additionally, the use of fixed thresholds for high-speed running (>18 km·h-1) as well as high-intensity accelerations (≥2 m·s-2) and decelerations (≤-2 m·s-2) could have impaired comparisons between players with different maturation status and physical capacities. Therefore, future investigations should use individualized thresholds for age group comparison. Finally, the exclusive use of the 60-s time period for peak demand assessment could have limited the understanding of the interaction between average physical demands and peak game requirements. To better understand basketball demands, future research should use a wider variety of time intervals during the most demanding scenarios of basketball match-play and examine the correlation of the two above mentioned analyses.
In conclusion, this study demonstrated that average game demands drastically underestimated the most demanding passages of basketball match-play and provided an insufficient approach to coaches for training task prescription. Therefore, the use of rolling techniques would be recommended to find the most demanding scenarios during official competition to establish the upper limit in each load variable and prescribe training accordingly in order to optimise game performance. Furthermore, it its worth mentioning that physical demands are shown to be substantially different between the five basketball age groups investigated, particularly regarding total distance covered and high-speed running.