Introduction
Agility as part of the physical performance can be defined as ‘a rapid whole-body movement with change of velocity or direction in response to a stimulus’ (Sheppard and Young, 2006; Young et al., 2001). The development of agility is highly important for youth tennis players who aim for the elite level, since high-level tennis players must be able to perform rapid, multidirectional movements to place themselves in the correct position for returning the ball (Kovacs, 2006; Munivrana et al., 2015). All these multidirectional movements are performed in reaction to information retracted on the opposite of the net (e.g., upcoming ball, position of the opponent; Sheppard and Young, 2006). Monitoring agility performance of talented youth tennis players is expected to provide a better insight into the performance development of these young players. For this purpose, it is recommended to use an assessment that captures a combination of the physical and cognitive aspects of agility, which players also need during a tennis match (Kovacs, 2006; Sheppard and Young, 2006). When an agility test represents the rally situations in a match as closely as possible (e.g., inclusion of a racquet, tennis-specific footwork), it will provide a complete profile of agility performance during a match (Zemková and Hamar, 2013). However, a comprehensive systematic literature search yielded no tennis-specific agility test including a response to a stimulus showing reliable and valid results. The only agility test which included both physical and cognitive agility performance, consisted of one maximal sprint, yet no reliable and valid outcomes (Ulbricht et al., 2016). Others were change of direction (COD) tests without a response to a stimulus (Barber-Westin et al., 2010; Eriksson et al., 2015; Fernandez-Fernandez et al., 2016; Huggins et al., 2017; Leone et al., 2006; Sekulic et al., 2017; Zemková and Hamar, 2014). Therefore, the aim of this study was to design a Tennis-specific Agility Test (TAT) and evaluate its measurement properties.
The first step in designing the TAT was the interpretation of the results of the preceding systematic literature search on agility assessments in racquet sports. As mentioned, this search identified no tennis-specific agility test including a response to a stimulus with proven reliability and validity. For badminton on the contrary, two badminton-specific agility tests were identified including a cognitive component and showing reliable and valid results: the Badminton Speed Test (BST; Madsen et al., 2015) and Badcamp (Loureiro and De Freitas, 2016; Loureiro et al., 2017). The two badminton-specific agility tests were used for the second step by evaluating the set-up translating it to tennis. The directions included in the tests were based on common positions of badminton players during a match situation and included a badminton-specific cognitive component as ‘response to a stimulus’ (Sheppard and Young, 2006; Young et al., 2001), randomly assigning the direction to move by lights (Loureiro and De Freitas, 2016; Loureiro et al., 2017; Madsen et al., 2015). Based on these findings, common positions in offensive and defensive situations in tennis were selected and the FITLIGHT TrainerTM system was chosen to provide the light stimulus. The third step of the design included a first test set-up by establishing the duration and distances of the tests, based on the literature with mean rally lengths of 3-5 shots (Carboch et al., 2018; Fernandez-Fernandez et al., 2007, 2008; Hornery et al., 2007) and distances around 4 m (Fernandez-Fernandez et al., 2014; Kovalchik and Reid, 2017). As the fourth step, pilot testing was performed. Two pilot measurements were performed without the use of participants to identify the possibilities of the FITLIGHT TrainerTM system, programming it in different ways. In addition, two pilot measurements were performed on participants, resulting in the deletion of two directions. As it was not an endurance test, the length of the test should equal the mean rally length of 3-5 shots (Carboch et al., 2018; Fernandez-Fernandez et al., 2007, 2008; Hornery et al., 2007). The four most important directions at the back of the court on a fast surface were selected together with the experts, resulting in the exclusion of the two backwards movements, away from the baseline. Finally, meetings were organised with an expert panel of the head coach, assistant trainers, and physical trainers. The panel included ex-professional players of the Davis Cup team who participated in multiple Grand Slam tournaments, all with over 10 years of training and Davis and Fed Cup coaching experience. Positions on the court, duration of the rally, and distances of the test were discussed. Small changes were recommended in the positions to be more representative for match situations.
Before this newly developed agility test is to be implemented in practice, it should be tested on several measurement properties (Morrow et al., 2011). As such, this study evaluated the test-retest reliability, concurrent validity and feasibility of the TAT. Reliability of the TAT was hypothesised to be at an acceptable level due to the standardised protocols including training phases before testing and the number of attempts (Morrow et al., 2011). Concurrent validity was investigated by examining the relationship with an existing COD test in tennis (i.e., Spider Drill) and the level of tennis performance. Only a moderate relation was expected, because the TAT is thought to measure both the physical and cognitive aspect of agility, while the COD test only covers the physical part. Moreover, tennis performance is based on performances in competition and tournaments and is established by several multidimensional characteristics (Elferink-Gemser et al., 2011), which are not taken into account in the assessment. The test was expected to be feasible and applicable for trainers and coaches.
Methods
Participants
A total of 69 tennis players were recruited from three different playing levels: 1) full-time tennis players competing at an international level (international players; n = 16; 22 ± 3.7 years), 2) national youth selection players competing at high national levels in their age group (national players; n = 43; 14 ± 1.4 years), and 3) tennis players competing at regional levels (regional players; n = 10; 15 ± 0.8 years). Participants were excluded when they were unable to perform a maximal effort due to injuries. The study protocol and informed consent procedure were approved by the Ethics Committee of Psychology (The Heymans Institute for Psychological Research, University of Groningen, Groningen, the Netherlands; PSY-1819-S-0262) in full compliance with the Declaration of Helsinki. Written informed parental and/or player’s consent was obtained.
Measures
In this study several instruments were used to evaluate the designed agility test. Next to the TAT, the Spider Drill was used as a recognised agility test and the Dynamic Rating System (DRS) as a measure of tennis performance in assessing the concurrent validity of the TAT.
Tennis-specific Agility Test (TAT)
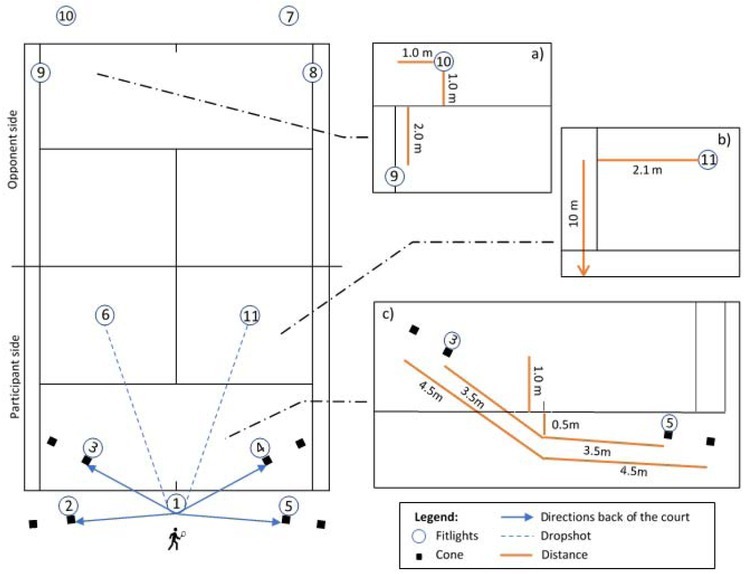
The TAT consists of four movements at the back of the court around the baseline (two side-ways, two into the court) and one drop shot (short ball placed close behind the net), randomly assigned at the opposite side of the net (opponent-side; Figure 1). The information for the direction to move was provided by the FITLIGHT TrainerTM system, a speed and cognitive light system. At the opponent-side, four lights, resembling the position of the opponent, were placed in two tennis-specific situations, a standard rally situation and a defensive situation. The standard rally situation was indicated by a light behind the baseline (lights 7 and 10), where players are, in general, not able to dictate the rally and return a standard rally ball. For the defensive situation (participants’ perspective), a light was placed inside the court on the singles line (lights 8 and 9) where a sharper angle could be played by the opponent, forcing participants into a defensive situation. To anticipate to a greater ball angle, players had to move into the court preventing the ball to move away from them. The four lights were all placed at a distance of 4 m, according to the mean distance players run per stroke (Fernandez-Fernandez et al., 2014; Kovalchik and Reid, 2017). The lights representing the position of the opponent were coupled to the lights at the side of the participant (i.e., 2+7, 3+8, 4+9, 5+10). To standardize the direction to move, participants were told that the directions (coupled lights) were all crosscourt. The order of the four lights at the back of the court was programmed into 12 different sequences of which one was only used as a practice trial. After the four directions one of the drop shots (6 or 11) was initiated and the participant had to touch the light with their racquet to finish the test.
Figure 1
Test set-up TAT with the distances for every direction (1a, 1b, 1c). The coupling of the lights at the opponent side and the participant’s side is 2+7; 3+8, 4+9, 5+10, where the combinations of 2+7 and 5+10 represent the standard rally situation, and 3+8 and 4+9 represent the defensive situation.
Participants were instructed to use tennis-specific footwork, perform a mock hit between the cones, end at the second cone with their footwork (to standardize the distances), and move back to the starting position to activate the next direction. Before the start of the TAT, participants were allowed to 1) practice without the use of the FITLIGHT TrainerTM system, 2) practice the drop shot with the use of one light, and 3) perform one complete practice trial. During official testing, participants had two attempts, of which the best time was used. If the player had no final time, the participant had to redo the test. Between the attempts a 90-s rest interval was implemented. Total time was automatically recorded by the FITLIGHT TrainerTM system when the sequence was completed.
Spider Drill
A commonly used agility test in the Netherlands is the adapted version of the Spider Drill (Huggins et al., 2017), using a stationary start at the centre of the baseline and consisting of picking up balls from the ground (Kramer et al., 2016). An ICC of .95 (CI 95%: .82-.99) was found for the Spider Drill (Huggins et al., 2017). The five places on the tennis court were the interceptions of the baseline with the singles side line (left and right side, 4.1 m), the service line with the single side line (left and right side, 6.9 m), and the centre service line with the service line (5.5 m). The order of the directions was fixed starting from right to left. The two balls at the right side had to be picked up with the right hand, the two balls at the left side with the left hand, and the ball at the centre service line was free of choice. The balls were placed behind the centre mark and the test was finished when the last ball touched the ground. The time was manually recorded using a stopwatch by the same experienced test leader. Players had two attempts of which the best total time was used.
Tennis performance
The performance level of tennis players in the Netherlands is determined by the Dynamic Rating System (DRS), which is a score from 9 (beginner) to 1 (expert) separate for boys and girls. Changes in the DRS depend on the match outcome and the level of your opponent. The dynamic nature of the DRS results in an actual representation of the performance of the player. While the DRS is not coupled to age, it is also possible to compare participants between different age categories. The levels on the DRS are comparable to the International Tennis Number (ITN) levels 1-10, with 1 being the expert level.
Design and Procedures
All participants were measured under similar conditions on an indoor hardcourt (Plexipave, Australian Open Slow Hardcourt). For the evaluation of the reliability of the designed agility test, the group of international players was assessed using a test-retest design. The retest was performed within a two-week period. The concurrent validity for comparison with the validated Spider Drill (Huggins et al., 2017; Kramer et al., 2016) was assessed on the international and national players. These measurements were part of fourth-annual physical performance measurements (including the Spider Drill). For the concurrent validity of the association with tennis performance, based on the DRS, all three groups of international, national, and regional players were used. For the regional group, the assessment was planned during a morning session. Assessment criteria for the feasibility were preparation time, time per participant, required materials, and the number of required test leaders (Kolman et al., 2017). In addition, expert meetings were performed with the head coach, assistant trainers, physical trainers, embedded scientist, and physiotherapists, discussing the practical implications and limitations.
Statistical analysis
Data analysis was performed using IBM SPSS Statistics for Windows Version 26.0 (IBM Corp. Released 2019. Armonk, NY: IBM Corp.). A one-way ANOVA with post hoc Bonferroni correction was performed for differences between the groups regarding the participants’ characteristics. Normality was checked and confirmed in terms of skewness, kurtosis, and normality plots. Moreover, an ANOVA performed for the 11 different sequences of the TAT showed no significant differences and the randomisation was therefore not of influence for the results (p < .05).
Test-retest reliability was assessed by relative and absolute reliability (Bruton et al., 2000). For the relative reliability, the Intra-Class Correlation coefficient (ICC) was calculated performing a two-way mixed ANOVA type absolute agreement single measures. An ICC of <.50 was indicated as poor, between .50-.75 as moderate, .75-.90 as good, and >.90 as excellent (Koo and Li, 2016). Absolute reliability was considered calculating the Standard Error of Measurements (SEM), the Minimal Detectable Change with 95% CI (MDC), percentual MDC of the total completion time (%MDC), and the Limits of Agreement (LoA; Blankevoort et al., 2014; Van Kampen et al., 2013):
%MDC = MDC/mean of total completion time * 100%
Concurrent validity of the Spider Drill and the TAT was assessed using Pearson correlation (1-tailed), where a correlation around .6-.7 was considered to be sufficient (Mukaka, 2012). The association of the DRS with the performance on the TAT was also calculated using Pearson correlations (1-tailed) separate for boys and girls as the second part of the concurrent validity. Alpha level was set at .05.
Results
International players were significantly different from both national and regional players regarding their age, body mass, accumulated tennis experience, hours of tennis training per week, DRS, and performance on the TAT. For height, international players were only significantly different from national players. Significant differences between national and regional players were only found for height and performance on the TAT (Table 1).
Table 1
Anthropometric and performance variables of the study population. Values expressed as M ± SD, except for sex (%-girls).
Test-retest reliability
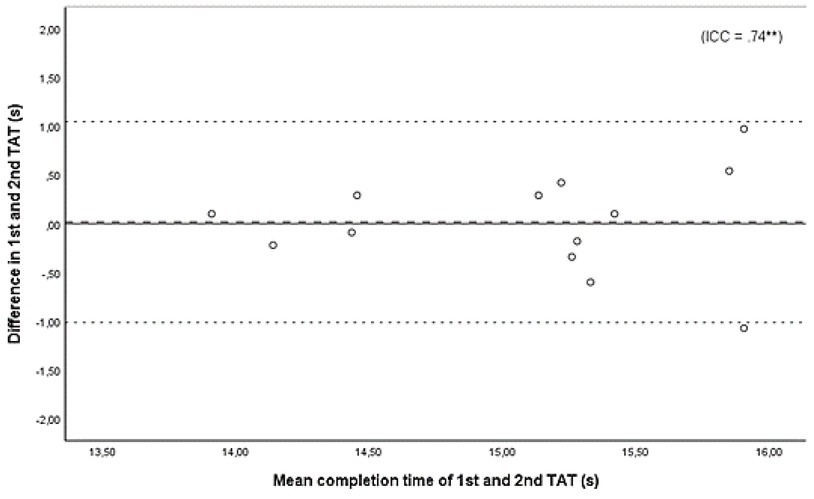
The TAT showed moderate relative reliability with an ICC of .74 (95% CI .34 - .92; p < .01). A small variation between trials was visible as some players were faster during the second trial and others were slower (Figure 2). The fastest participants showed little variation, whereas it seemed to increase up to one second for slower participants. The SEM was .34 s and the MDC .93 s, resulting in a %MDC of 6.2%. Figure 2 shows the mean difference between the two trials of .016 and the 95% LoA.
Concurrent validity
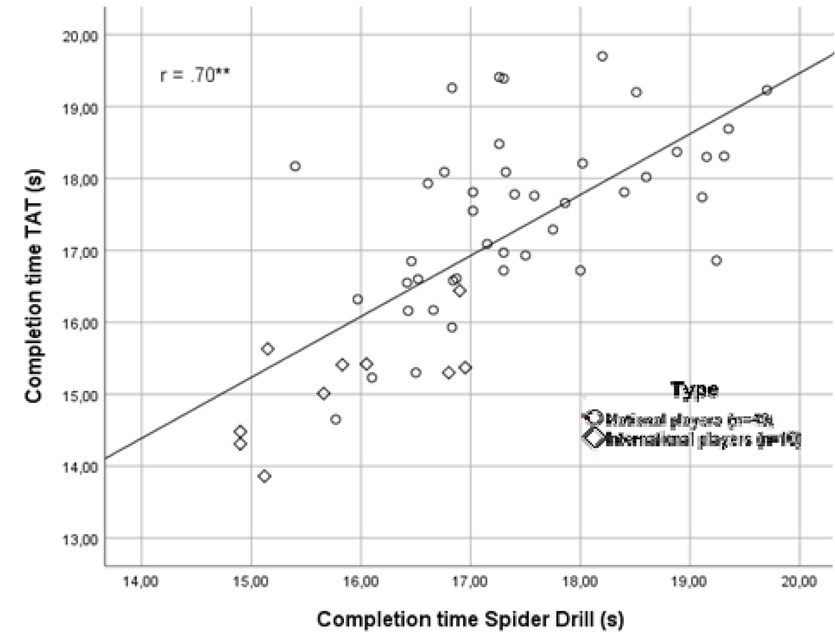
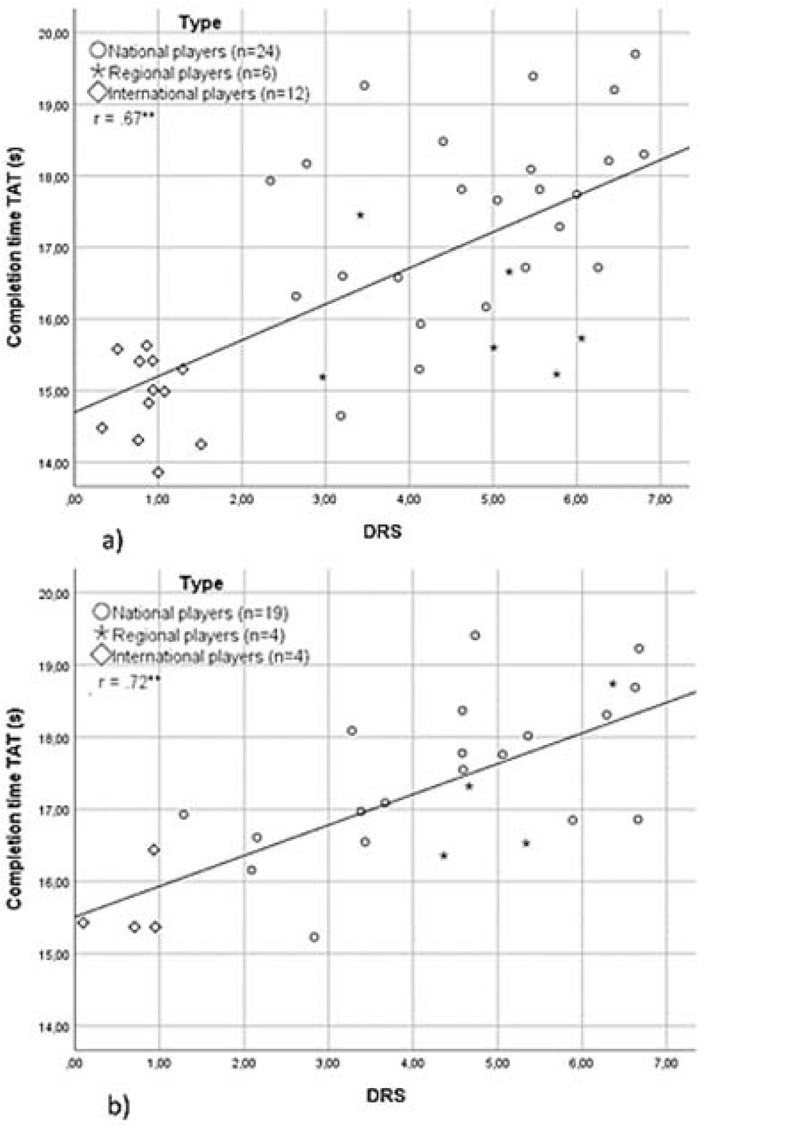
Figure 3 shows the relationship between the TAT and the Spider Drill. A significant positive moderate correlation of .70 (p < .01) was found between the TAT and the Spider Drill. Moreover, the association of the tennis performance and the TAT showed significant positive moderate correlations as well for both boys (r = .67; p < .01) and girls (r = .72; p < .01; Figure 4).
Figure 2
Bland-Altman plot for test-retest reliability of the TAT (n=13). The dashed line represents the mean difference in completion time of the first and second test day. The dotted lines represent the 95% Limits of Agreement (M ± 1.96 SD). The ICC is included in the figure; **p < .01
Feasibility
The TAT required 5-10 min preparation time and less than 5 min per participant. The required materials included the FITLIGHT TrainerTM system, which is not applicable for every tennis academy. However, when there is no access to the light system the coach would be able to randomly assign the directions by different colours for every direction (including a drop shot). For the test leaders, only one person was required. Discussing the practical implications and limitations with experts resulted in two main disadvantages. First, the use of a mock hit, which is likely to be played with less intention than hitting a tennis ball, saving time for participants. Secondly, experts raised questions about the representativeness of the light stimulus for the match situation, as it only represented the position of the player.
Discussion
The aim of this article was to design a tennis-specific agility test and evaluate the measurement properties. As hypothesized, the results revealed acceptable test-retest reliability, moderate concurrent validity, and acceptable feasibility.
Test-retest assessment of international players within a two-week period showed moderate reliability, which was lower than expected when looking at the small mean difference between the trials in the Bland-Altman plot (Figure 2). This can be explained by the homogenous population of international players, which affects the ICC (Bruton et al., 2000). Furthermore, the Bland-Altman plot showed more stable performance for faster TAT values. These results suggest that players who were fast during their first trial would show little variation with their second trial. These results seem logical, while faster results on the TAT require a more expert level of agility performance. At these levels, the physical component of agility is performed subconsciously while focussing on the cognitive stimulus assigning the direction to move. A more stable agility performance will lead to less variation between the trials. Next to the relative reliability, also the absolute reliability was measured showing an MDC of .93 s, which is 6.2% of the total completion time. The %MDC of recognised agility tests varies from <1% to 6.5% (Eriksson et al., 2015; Hachana et al., 2014; Huggins et al., 2017), with an %MDC of 1.1% for the Spider Drill (Huggins et al., 2017). The influence of a cognitive component on the %MDC is unknown, but it was expected that agility tests including a cognitive component would show more variability leading to higher %MDC values. Agility tests including both the physical and cognitive component have three possible sources of variation. A tennis-specific agility test requires good performance on the physical, cognitive, and combined agility performance and is therefore more demanding than a COD tests. It is important to note that reliability was only tested on the international group. As such, it is unknown how far these results can be generalised to other populations, while a more heterogenous population could show more variation between trials. Therefore, before the test can be widely used for monitoring agility performance in other performance groups (e.g., national or regional youth players), more research is needed with a greater population and a wider variety of performance levels.
Results of the concurrent validity showed a significant positive moderate correlation for the TAT and the Spider Drill. The moderate correlation can be explained by the similarity in the physical component, consisting of COD movements. The relationship between the TAT and the Spider Drill is not perfect due to the addition of a cognitive component in the TAT. With the addition of sport-specific factors such as a cognitive component, the sport-specificity of agility testing in tennis was thought to increase (Young et al., 2015). This sport-specific approach of agility testing, supported by other literature (Sheppard and Young, 2006; Zemková and Hamar, 2013), is beneficial for monitoring performance as it is a better representation of the match situation. In addition, Figure 3 suggests faster performance of international players on the TAT compared to the Spider Drill, but future research should provide more insight whether increasing the sport-specificity of the test also leads to a better representation of the tennis performance.
As expected, the association between the TAT and tennis performance showed moderate correlations for both boys and girls. International players also showed significantly better performance on the TAT compared to national and regional players. This superior performance could have been influenced by differences in players’ characteristics on body height, mass, experience, etc. Since international players were older and trained more hours per week than the other players, they logically accumulated more tennis experience which positively influenced their rating. Therefore, all these factors also contribute to a better rating. Comparison of the regional and national group showed significantly better performance for the regional group. In a group of talented players, a higher age would, in general, automatically lead to a more expert level on the DRS, due to the accumulated tennis experience and anthropometrical advantages. Although most differences between the characteristics of these two groups were non-significant, the small advantage on age, accumulated tennis experience, and anthropometric characteristics probably explain the superior performance for regional players. Future research should focus on a discriminative analysis with more different playing levels.
Next to the high feasibility with short preparation time (5-10 min) and time per participant (<5 min), experts addressed two points of discussion. First, the use of the mock hit. Ideally, the mock hit would be changed by hitting tennis balls, for example provided by a coach. However, in such a case the completion time would highly depend on the timing and accuracy of the provision of balls by the coach. Using a ball projection machine raises another problem of the fixed time interval between ball provisions, regardless of the split time of the participant. The use of a light stimulus was the second point of discussion. Although in practice the light stimulus seems to be the best way to deal with the challenges in measuring tennis-specific agility, more information is available for players during match situations (e.g., previous rally patterns, orientation of the opponent). Literature has shown that more skilled players show superior anticipation and are therefore better in reading cues in the movement of their opponents (Farrow and Abernethy, 2003; Sheppard and Young, 2006; Triolet et al., 2013). Reacting to a light stimulus requires no processing of complex motions of the opponent. In addition, superiority of more expert levels in interpretation of the kinematic cues may be deprived (Paul et al., 2016). Consequently, studies using a light stimulus were inconsistent considering the ability to discriminate between performance levels with some studies finding superior performance for elite players, whereas other studies showed no differences between the high- and low-performance group (Paul et al., 2016). The results of this study suggest that for the TAT, the light stimulus is sufficient for differentiating between high- and low-performance groups, at least by comparing the international to the national and regional group. Still, a next step for further improvement of the TAT is to compare different stimuli with the light stimulus to identify the most valid cognitive agility component for tennis-specific agility testing. Examples of other stimuli are the use of video footage, and a real time opponent (Shim et al., 2005).
As the TAT shows promising results, the test can be implemented for the international players providing trainers and coaches with useful information for identification of more sport-specific training targets. For the national and regional levels, the TAT could be useful in addition to the Spider Drill. Next to the assessment of the discriminative validity of the TAT, future research should focus on the translation to training to identify the most suitable approach for training agility. In the event of inferior agility performance, a relevant question is whether training should focus on improving agility as one construct or rather on the isolated components of agility, i.e., physical and cognitive agility (Jeffreys, 2011; Paterson et al., 2016; Sheppard and Young, 2006; Young et al., 2015). This requires deeper understanding of the general process of motor and cognitive learning and the translation to agility performance.
In conclusion, the TAT shows promising results with acceptable test-retest reliability and concurrent validity regarding the recognised Spider Drill. International players outscore national and regional players on the test, although other underlying performance characteristics may have influenced this result. The feasibility is high and makes it likely for the TAT to be used in the practical setting.