Introduction
Since a planned training task in team sports needs to represent specific variables of competition which regulate the actions and decision-making of players, small-sided games (SSGs) are often used to simulate game phases or sub-phases, representing the unstable, dynamic and unpredictable nature of a match (Davids et al., 2013). The ecological dynamics approach reinforces the use of game spatial-temporal information and the emergence of possibilities for action over training and competition is dependent on players and teams action capabilities (Travassos et al., 2012). By manipulating specific rules during SSGs, it is possible to emphasise specific information which will guide players’ decisions, as well as affect their tactical, technical and physical performance (Barnabe et al., 2016; Olthof et al., 2018; Travassos et al., 2014). Coaches need to design training tasks, sampling the specific variables of the competition which regulate the actions and decision making of players, according to their own capabilities and in line with the coach perspective (Travassos et al., 2014). A real challenge for coaches is not only to manipulate constraints for the design of challenging training tasks, but to identify the relationship between the manipulation of such constraints, the action capabilities of players, and the desired collective tactical goals of the team, in accordance to the individual player’s stage of development (Owen et al., 2020).
Players’ development depends on several factors, including age, gender, maturation, previous experience, pre-training levels for motor skills, current physical activity, psychological factors and genetics, alongside an appropriate progressive development program (Malina et al., 2007). According to Malina et al. (2007), maturation is especially marked in boys aged 1315 years, resulting in greater size, speed, strength and power, what may allow a competitive advantage for players in a more advanced state of maturity. While practising the same SSG, Almeida et al. (2013) observed considerable differences in individual and collective performance of players with very different skills and experience levels. For instance, different age groups deal differently with available space, showing different spatial relations in the playing area. As the age increases, the interpersonal distances between players that forged the space of play tend to increase (Olthof et al., 2018).
The manipulation of playing area dimensions affects the intensity of the game, players’ actions and the energy sources used (Sangnier et al., 2019): large playing areas are associated with greater distance covered (Silva et al., 2014) and an increase in the intensity of exercise (Halouani et al., 2014; Sarmento et al., 2018) in comparison with small ones. Small playing areas appear to foster technical development (Clemente et al., 2019; Sgrò et al., 2018). In the same line of reasoning, players’ age and level of expertise influence their individual decision making and tactical individual actions, which consequently has an effect on the collective behaviour of the team (Menuchi et al., 2018).
However, it remains unclear how players of different ages behave in SSGs with different spaces when the goal is to maintain ball possession. This task constraint has been widely used to improve passing skills and creation of space in youth players as well as to develop ball circulation and team organisation in older players. It was even observed that ball possession tasks induced an increase in exercise intensity and the number of tactical individual actions, as players needed to constantly create passing lines or block opponents, thereby increasing the number of moves to keep or recover ball possession (Martín-García et al., 2020). It is then critical to explore the effects of different playing area dimensions on ball possession tasks to understand the emergent behaviours in soccer SSGs at different ages or levels of expertise. This information is required to create performance development programs on the basis of the empirical understanding that arises from tactical behaviours at different individual stages of development (Barnabe et al., 2016).
Taking the above into consideration, the aim of the study was to evaluate the effects of a 4 vs. 4 ball possession SSG on the external workload, perceived internal load and, tactical individual actions, in three different playing areas (20 x 15 m, 25 x 20 m and 30 x 25 m) in three different age groups (U11, U15 and U23). According to the theoretical principles of ecological dynamics, larger playing areas were expected to benefit players maintaining ball possession from the players out of possession. It was expected that fewer opportunities to intercept the ball in larger playing areas due to the increase in interpersonal distances between players would be observed (Vilar et al., 2014a, 2014b). It was also expected that younger age groups might be more successful in larger playing areas compared with smaller areas, as time for decision-making and action was increased due to larger interpersonal distances (Barnabe et al., 2016).
Methods
Participants
Fifty-two academy level soccer players from under-11, under-15 and under-23 age groups participated in this study (under-11: U11, n = 16, age: 10.0 ± 0.7 y, body mass: 33.0 ± 2.34 kg, height: 141.0 ± 4.6 cm, playing experience: 1.0 ± 1.1 y; under-15: U15, n = 18, age: 14.0 ± 1.3 y, body mass: 58.0 ± 13.4 kg, height: 169.0 ± 10.1 cm, playing experience: 3.0 ± 1.2; under-23: U23, n = 18, age: 21 ± 1.60 y, body mass: 66.5 ± 10.1 kg, height: 174.5 ± 4.3 cm, playing experience: 6.5 ± 1.6 y). All participants were part of the same team and participated in three weekly 90-min training sessions, plus one game on weekends at a regional playing standard on a regular turf soccer pitch. Players had around 40 weeks of training per season and goalkeepers were not included in data collection. The three groups of players considered in this study were used to determine how players of different levels of development and physical, tactical, and technical abilities cope with different pitch sizes. The experimental protocol and investigation were approved by the local Institutional Research Ethics Committee and performed in accordance with the ethical standards of the Helsinki Declaration. For the U11 and U15 teams, written informed consent was obtained from the parents of players. The same written informed consent procedure was also undertaken with the U23 participants, the coach, and the club before data collection, when informed about the benefits and risks of the investigation, acknowledging that each player could withdraw from the study at any moment.
Measures
Data on the external workload variables were collected through a Global Position System (GPS) included in the ZEPP Play Soccer system (ZEPP Labs, San Jose, United States), which uses two Micro Electromechanical Systems (MEMS) sensors and Bluetooth 4.0 Low Energy (LE) connectivity. Each player had a microchip (each with two internal sensors: 3-Axis Accelerometer + 3-Axis Gyroscope) attached to each of their gastrocnemius to record displacement data (Aroganam et al., 2019; Sasaki et al., 2019). Later, Zepp's computer software (version 1.6.0) was used to compute values of external loads: total distance covered (m), distance differentiated by walking (≤ 9 km/h), running (9 - 18 km/h) and sprinting (> 18 km/h), number of sprints (n), maximum sprint speed (km/h); and tactical individual actions: number of passes (ball contacts) with the dominant and non-dominant foot (n), and maximum passing speed (km/h) (Owen et al., 2014). Passing actions were registered when the force applied to the ball allowed it to travel a distance of at least 5 m (ZEPP Play Soccer system). The perceived internal loads were evaluated using a Borg Scale CR10. It was presented to participants at the end of each SSG to ensure that the perceived effort was referred to that specific game condition (Coutts et al., 2009).
Design and Procedures
Participants played 4-a-side SSGs on different playing area dimensions: small playing area (20 x 15 m; playing density: 37.5 m2) (S), medium playing area (25 x 20 m; playing density: 62.5 m2) (M), and large playing area (30 x 25 m; playing density: 93.75 m2) (L) (Owen et al., 2004; Williams and Owen, 2007). Team head coaches were present during data collection and assigned players into balanced teams based on their perception of players’ physical, technical, and tactical abilities, and without considering players’ positions. The 4 vs. 4 SSGs were performed in four sets of four minutes each, with four minutes of active recovery between games (in a total of sixteen minutes of intermittent exercise for each SSG; 4 x 4 min + 4 min recovery time). Three training sessions were completed on three different days for each age category, with each session being played on the same playing area (day 1 on M; day 2 on S; and day 3 on L). Additionally, each session was performed in the same training session of the microcyle, with a week of difference. Before the beginning of each session, players performed a general warm-up which included running at various intensities, joint mobilization and stretching, for 20 min duration. Due to the purpose of the exercise (maintaining and recovering ball possession), no goalkeeper or any type of the goal or target was used. The coach did not intervene during the SSG with any corrective feedback or encouragement. If the ball went out of play, other strategically placed balls allowed an immediate restart from a pass.
Statistical Analysis
A descriptive analysis was performed using means and standard deviations (Table 1 and Figure 1). A Shapiro-Wilk test was used to assess the normal distribution of data. Due to the existence of normal and non-normal distribution of data, the differences between age groups were assessed using parametric and non-parametric tests (ANOVA and Kruskal-Wallis, respectively) for each playing area condition. Statistical significance was set at p < .05 and calculations were carried out using SPSS software V24.0 (IBM SPSS Statistics for Windows, Armonk, NY: IBM Corp.).
Figure 1
Standardised (Cohen) differences for considered variables according to the age group. Error bars indicate uncertainty in true mean changes with 95% confidence intervals.
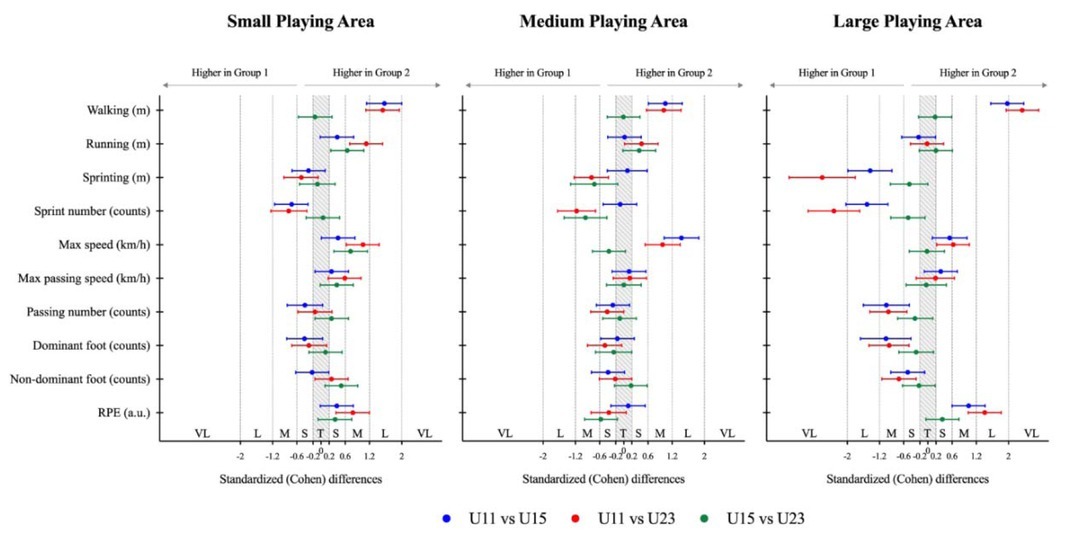
Table 1
Descriptive analysis, results of the test of normality (Shapiro-Wilk) and one-way ANOVA and/or Kruskal-Wallis repeated measured analysis of variance for each playing area considering the age effect.
Complementary, magnitude-based inferences and precision of estimation were applied (Table 2). The individual differences were analysed with a specific spreadsheet (a comparison of two group means) (Hopkins, 2007) and the age groups were compared in each playing area format and assessed via group means expressed in raw units with 95 % confidence limits (CL). The threshold for a change to be considered practically important (the smallest worthwhile difference) was 0.2 x between standard deviation. Uncertainty in the true effects of the conditions was evaluated based on non-clinical inferences. The following magnitudes of clear effects were considered: < 0.5%, most unlikely; 0.5–5%, very unlikely; 5 – 25%, unlikely; 25 to 75%, possibly; 75 to 95% likely; 95 to 99%, very likely; > 99% most likely large (Hopkins et al., 2009). Pairwise comparisons were assessed via standardized mean differences and respective 95% confidence intervals. Thresholds for effect sizes statistics were 0.2, trivial; 0.6, small; 1.2, moderate; 2.0, large; and > 2.0, very large (Hopkins et al., 2009). These statistical computations were processed with a specific post-only crossover spreadsheet for each age group (Hopkins, 2017).
Table 2
Inferences for each age group on players’ performance measures.
Results
Table 1 shows the descriptive analysis for all dependent variables across the different playing areas, considering the age effect. Table 2 shows the mean changes with ± 95 % confidence limits of each variable for each playing area. Finally, the magnitude of the results from the above-mentioned comparisons is presented in Figure 1
Small Playing Area
Results of external loads revealed significant differences in the distance covered while walking (χ2= 32.54, p < .001), running (χ2= 17.07, p < .001) and for maximum speed (χ2= 19.5, p < .001), with older ages covering more distance compared with younger ages (Table 1). Interestingly, it was observed through pairwise comparisons that the U11 age group covered more distance sprinting (possibly to likely) and performed more sprints (very likely) than U15 and U23 age groups (Table 2). Significant differences were also found in the RPE (χ2= 9.34, p = .001), with older age groups showing higher scores compared with younger ages. Regarding tactical individual actions, despite the small effect, pairwise comparisons showed that older age groups performed higher speed passing than younger age groups (possibly to likely). On the contrary, the U11 age group performed more passes (likely) with the dominant (likely) and non-dominant foot (possibly), compared to older age groups. However, the U23 age group performed more passes with the non-dominant foot compared with U11 (possibly) and U15 (likely) age groups. Interestingly, the U11 age group performed more passes with the dominant foot compared to the U23 age group (possibly).
Medium Playing Area
Results of external loads revealed significant differences in distance while walking (χ2= 20.36, p < .001), for the number of sprint (χ2= 15.79; p < .001), and maximum speed (χ2= 20.96, p < .001), with older age groups covering more distance walking compared with younger ones, while younger groups performed more sprints compared with older ones (Table 1). Despite the small effect, pairwise comparison showed that the U23 age group covered more distance while running (likely) and less distance while sprinting (very likely and likely) compared with U11 and U15 age groups (Table 2). Pairwise comparison also revealed higher RPE values for U23 than for U11 and U15 age groups (possibly and likely). Considering tactical individual actions, despite the small effect, the U11 age group performed more passes compared with U15 (possibly) and U23 (likely) age groups, and more passes with the dominant foot compared with the U23 (likely) and more passes with the non-dominant foot compared with the U15 age group (likely). Finally, the U15 age group performed more passes with the dominant foot compared with the U23 age group (likely).
Large Playing Area
Results of external loads revealed significant differences in distance while walking (χ2= 48.54, p < .001), sprinting (χ2= 27.61, p < .001) and for the number of sprints (χ2= 30.65, p < .001), with older age groups covering more distance while walking and younger age groups covering more distances while sprinting and performing a greater number of sprints (Table 1). Despite the small effect, pairwise comparison showed that the U11 age group covered more distance while running compared with the U15 age group (possibly) and achieved a higher maximum sprint speed compared with the U15 (likely) and U23 (very likely) age groups (Table 2). Significant differences were also found in the RPE (χ2= 26.45, p <.001), with older age groups showing higher scores compared with younger ones. Regarding tactical individual actions, significant differences were found in completed passes (χ2=16.38, p < .001) and dominant foot passing (χ2= 14.29, p < .001), with younger age groups performing more counts compared with older age groups. Despite the small effect, pairwise comparison showed younger age groups also completed more passes with the non-dominant foot compared with older age groups, while the U15 age group performed more passes at high speed compared with the U11 age group (possible).
Discussion
The aim of this study was to determine the effects of a 4 vs. 4 ball possession SSG in different playing areas between three different age groups. In general, the results of the study showed different behaviours according to the age-categories analysed, concluding that different age groups dealt differently with available space and explored the game possibilities in a different way (Olthof et al., 2018).
For the external workload, younger players covered more distance while running and sprinting, and performed a higher number of sprints, compared to older age groups, in all playing areas. The anaerobic system of youth players is still not fully developed, therefore, U11 players tend to use aerobic metabolism even at high intensity activities, also being able to recover quickly (Groslambert & Mahon, 2006). A study by Lupo et al. (2019) highlighted the effects of running technique on prepubescent soccer players’ ability to maintain ball possession. Thus, U11 players with different sports training approaches within the study can have improved sprint capabilities, and consequently, cover higher distances at this speed threshold. An interesting finding is that U23 players walked more in every playing area, in comparison to U15 and U11 players, highlighting a general lower game pace. The older and more experienced players demonstrated higher perceptual and cognitive motor abilities in task performance, therefore, decreasing the need to cover distances at high intensity. These findings are in line with the work of Mendez-Villanueva et al. (2013), which discovered that older players (U16, U17 and U18) tended to perform fewer sprints, but covered the same total distance as their younger counterparts (U13, U14 and U15) and also Clemente et al. (2014) revealed that younger players tended to travel longer distances at high intensities than older players.
In the analysis of the spatial-temporal relationships between soccer teams, Olthof et al. (2018) showed that with an increase in age, distance between players of the same team and in relation to opponents tended to increase, increasing the space of play and the spatial equilibrium on the pitch. Thus, U23 players probably showed much more equilibrium in the occupation of space when in attack or in defence. That is, older players, compared to younger ones, tend to disperse in the playing area during offensive phase, forming a tight formation and reducing the area of play when they need to defend, achieving better control of the game pace (Barnabe et al., 2016). As a result, more experienced players may use an individual pacing strategy, demonstrating their ability to adapt to match situations and perform cohesively as a team, consequently affecting their external load.
Considering the areas of play, the results demonstrated that in similar areas of play, younger players tended to exhibit a higher number of sprints and performed at higher intensity with greater sprint distance covered (Mendez-Villanueva et al., 2013; Menuchi et al., 2018). SSGs have demonstrated their efficacy as a training stimulus for soccer players; when systematically used in a training programme, SSGs are a training modality which develops aerobic capacity of youth players (Casamichana & Castellano, 2015). Particularly, the use of larger playing areas can be useful for practicing the specific movement requirements of competitive situations (Hill-Haas et al., 2009) and should be carefully considered in youth players to improve game comprehension and specific motor skills (Almeida et al., 2013).
In terms of internal loads, it was observed that older players generally perceived the SSG more intense when compared to younger players (U23>U15>U11). Interestingly, and in opposition to S and L playing areas, it was noticed that in the M playing area, both U11 and U15 felt the SSG more intense when compared with the U23 age-category. Indeed, Nunes et al. (2020) reported higher scores of the RPE for U23 players on small playing areas and for U11 players on larger playing areas, with no differences stated for U15 players between areas of play. According to Malina et al. (2007), children feel less effort than adults in training and competitive activities. Thus, the analysis of internal and external loads of soccer practice should be considered in relation to players’ age (Mendez-Villanueva et al., 2013). A limitation of this research is that the better athletically developed players might produce more explosive movements and thus influence the data collection process considering external load variables when compared with internal load variables and tactical individual actions (Malina et al., 2007). Therefore, further research is required to understand the relationship between the external and internal load variables of soccer players of different ages in SSGs.
For tactical actions, we noticed that U11 players performed more passes as the space of play increased. It appears that the use of larger playing areas in younger players allows the development of tactical skills more effectively, due to the increase in the time available for action and decision making (Vilar et al., 2014a). Also, more experienced players seem to be better at exploiting space, through the facilitation of team play, identifying a greater number of possibilities for certain actions, and solving tactical tasks more effectively and efficiently (Menuchi et al., 2018). Thus, varying the playing area according to players’ age and capabilities allows to explore possibilities of play according to individual needs and reinforce the situations which players will face over the competition (Casamichana & Castellano, 2015).
Although this study demonstrates important insights into the training process in different age categories, some limitations should be acknowledged. It was stated that different age categories had different demands for movement, with younger age groups covering more distance at higher intensities and older age groups covering more distance at walking speed. However, the speed thresholds can be a limitation to interpret these results, as per maturation and biological differences (Groslambert and Mahon, 2006). Thus, a running threshold for U11 may be in fact sprinting. Further research could be conducted to understand the variations on the speed threshold for different age-categories, to inform future studies. As another limitation, different team sports outcomes and aspects of play depend on several factors, and consequently the observed performance variables were not controlled for the goals scored during the SSGs, hence avoiding minimising the margin of victory effect on performance (Lupo and Tessitore, 2016). Future research would benefit from comparing SSGs in ball possession with the condition of small and regular goals.
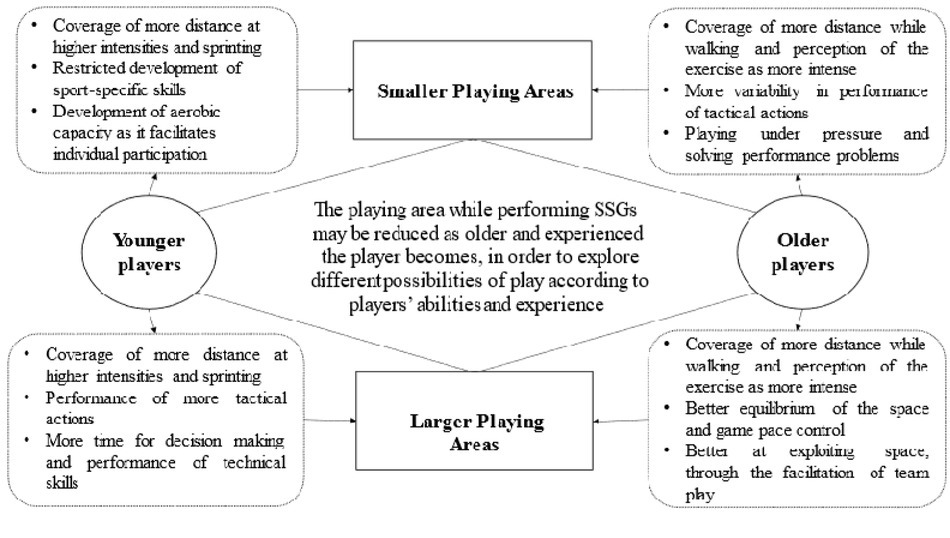
Summarizing, coaches should be aware that different age-categories will have different training effects when performing SSGs. For example, the use of the M playing area promoted lower differences in tactical actions considering all age categories. On the contrary, a great number of differences in tactical actions were reported in S and L playing areas, highlighting the idea that the manipulation of playing areas has an important role in the SSGs. Coaches need to be aware of the fact that youth players do not have the same tactical skills as adults or elite players, thus youth players need to develop physical, technical and tactical performance according to their individual needs (Dellal et al., 2011). Players at an early stage of learning the game may benefit from larger playing areas to promote development of tactical skills. These youth players will constantly perform SSGs at a higher intensity; although, they do not perceive the exercise the same way as older players. Older players may then benefit from smaller playing areas, allowing to mature tactical skills under pressure and developing decision making skills (Figure 2).
Conclusions
The age of soccer players and the size of the playing area will impact decision making and adaptations emerging from the specific performance contexts, influencing the outcomes of SSGs. Coaches should be aware that, for every playing area analysed, U23 players tend to cover more distance while walking and perceive the exercise more intense; on the other side, U11 players tend to cover more distance while running at higher intensities and do not perceive the exercise the same way. Smaller playing areas can be used to benefit older and experienced players in maintaining ball possession, due to the individual's ability to explore various possibilities of tactical actions among teammates. Larger playing areas can then produce more opportunities for tactical actions for younger players, without the effect of pressure constraint, and consequently with increased decision-making time. Coaches and individuals involved in training and development of soccer players should understand that different age-categories will deal differently with distinctive playing areas while performing SSGs and should be also aware of the key variables highlighted in this study before planning training drills.