Introduction
‘Ball or the man’ is a term commonly associated with rough tackling teams in contemporary soccer. The phrase suggests that any strategy (legal or illegal), which stops an attacker is justified to ensure game success. Fouls and cards (yellow and red) are a measure of evaluating the fairness of play in soccer. They have been examined from an ethical standpoint as methods for assessing aggression in soccer players (Gümüşdağ et al., 2011; Sapp et al., 2018; Tanamati Soares, 2016). A study on 130 unsportsmanlike fouls in men’s and women’s basketball games from Olympics, European and World championships showed an overall advantage in the outcome of the game to the team with more fouls (Gómez et al., 2016). Few studies have investigated the influence of fouls on game success in soccer. The majority of studies focus on correlating attacking KPIs with performance. A study that analyzed 177 FIFA world cup games from 2002 to 2010 is one of the few studies which examined defensive KPIs. The results suggested a significant influence of the number of fouls committed, yellow cards, and red cards on the teams’ success (Castellano et al., 2012). There seems to be few studies focusing on defensive KPIs (Sarmento et al., 2014). Hence there is a need to analyze defensive KPIs within game specific-scenarios.
Five full seasons in the Bundesliga were analyzed, and it was found that the probability of a win increased with increasing numbers of fouls (Anders and Rotthoff, 2011). In contrast, yellow cards and red cards lowered the winning probability. Another study based on 17 matches in the Turkish Super League concluded that only 1.2 percent of all fouls were unintentional, indicating that players intentionally commit the vast majority of the fouls (Gümüşdağ et al., 2011). Based on a limited sample size, this finding warrants further investigation of fouling behavior as a tactical strategy and its relationship with game success in professional soccer leagues. Furthermore, research analyzed when a ‘professional foul’ (tactical foul) should be committed based on hypothetical game scenarios (M. Wright and Hirotsu, 2003). That study extends previous findings on red cards’ effect by accounting for team strengths based on the end-of-season standings (Ridder et al., 1994). The study also combines the impact on the optimal timing of tactical decisions using the Markov chain prediction model (Hirotsu and Wright, 2002). Furthermore, the authors recommend rule changes in soccer based on the fouling team's advantage as a function of the foul's location. The same study also accounted for the strength of the opposition team, the foul’s timing, the punishment awarded to the fouling player, and its implications for the fouling team affecting the change in goal probability. The authors conclude that stronger teams seem to benefit more from professional fouling. The penalty for a professional foul is not always fair when accounted for the probability of scoring a goal. Considering the above studies, there seems to be a gap for analyzing fouls as a key performance indicator (KPI) for successful gameplay in high-performance soccer.
Fouls and yellow cards indicate aggressive behavior in European soccer leagues (Sapp et al., 2018). The results suggested that the English Premier League (EPL) referees called the least number of fouls compared to the other four leagues. The number of tackles and yellow cards received had strong correlations with the final table position across all leagues. They further concluded that, although European soccer has become less aggressive over the years, the EPL still seems to be the most aggressive of the investigated leagues, especially away from home (Thomas et al., 2006). Variance in referee strictness was observed across different stages of the game in the German league. The same study elaborated the referee's calibration process in calling a foul or giving a card (Unkelbach and Memmert, 2008). Assuming that this phenomenon may exist in different leagues to a varying degree is justified. Hence, it is crucial to examine and compare the effect of fouling behavior and its impact on another leagues' success.
Possession in soccer has been extensively studied as an indicator of performance and team strength. Retention of possession for a prolonged period has been linked to game success in multiple studies (Camerino et al., 2012; Casal et al., 2017; Jones et al., 2004; Lago-Ballesteros and Lago-Peñas, 2010). A systematic review suggested that the best-ranked teams maintained higher-level possession, home teams had more control than away teams on average, and differences in team strength translated to differences in ball possession with better teams having more possession (Sarmento et al., 2014). An exception to this trend was seen in the case where teams were shown to have more possession while trailing (losing) as compared to when they were leading. Most studies treat possession as an offensive KPI, but the amount of possession for a team also depicts how much of the playing time was spent in attacking versus in defending phases (Casal et al., 2017; Sarmento et al., 2014).
It also predicts the strength of the teams (Lago and Martín, 2007). It is a crucial factor that needs to be considered while evaluating a team's attacking and defensive performance. In the present study, we propose that possession should be neither an attacking nor a defending KPI. It should be treated as a category of its own, while defensive and attacking KPIs should be investigated after factoring in the time duration in ball possession. There is a need for normalizing technical and tactical data for accurately accounting for the frequency of game specific actions (Hughes and Bartlett, 2002). Hence, the present study proposes a normalization method to investigate and accurately report teams' fouling behavior without ball possession. It better depicts defensive and offensive KPIs and their relationship to success in soccer.
There seems to be few studies that account for average in possession and out of the possession time as a factor when investigating both defensive and offensive KPIs. Possession seems to be a KPI that is descriptive of the phase of play and comparative team strength (Pratas et al., 2018; Sarmento et al., 2014). Thus, the present study addresses several methodological issues presented by multiple studies (Bergkamp et al., 2019; James, 2006; Mackenzie and Cushion, 2013;).
There seems to be limited research focused on fouling as a tactical strategy for success in soccer. Intending to fill this gap, the present study investigates fouls out of possession (FPGNorm), Yellow cards out of possession YCFNorm, and the average amount of fouls required to get a yellow card (YCPFPG) and their relationship to success in European soccer leagues. Success is defined as the end of season points (Pts) and total end of season goals conceded (GA). Furthermore, the study compares how this effect potentially varies across the 5 European top-flight leagues vs. English Premier League (EPL), Spanish LA Liga (LaLiga), German Bundesliga (BL), Serie A (SA), and the French league One (FL). Following is the list of hypotheses that the study shall investigate:
(H1) The current study predicts a positive correlation of both FPGNorm and YCFNorm with the end of season points (Pts) and a negative correlation with the number of goals conceded (GA).
(H2) The effects of fouling on performance will be significantly different in the EPL as compared to the other leagues.
(H3) YCPFPG will show a negative correlation with the end of season points and positive correlation with GA, with the EPL showing significantly different effects as compared to the other leagues.
Methods
Participants
End of the season statistics from the EPL, SA, BL, LaLiga, and FL were obtained for the seasons from 2009-10 to 2018-19. Notational statistics for fouls per game (FPG), fouls which received yellow cards per game (YCF), average possession for the whole season (Percent Possession), and final table performance stats were obtained from (Whoscored.com, 2019) and defined in accordance with the definitions of the data source. Permission was obtained from whoscored.com for publishing the results of the present study under the creative commons open-source license.
Measures: Normalization
In soccer, fouls are mostly conducted by the defensive team, which is out of possession as possession rates vary widely between teams and games (Sarmento et al., 2014). FPG and YCF should be normalized according to possession to account for time spent out of possession. Thus, the following normalization equations were used, yielding a normalized number of fouls per game (FPGNorm) and a normalized number of yellow cards per game (YCFNorm):
Furthermore, the ratio YCPFPG between YCF and FPG was used to assess how many fouls per game on average were required to receive a yellow card:
Design and Procedure
To model season and league effects, post hoc regression analysis was conducted and both variables were included in the study to account for mixed results. As FPGNorm and YCFNorm were found to be positively correlated with each other, two separate models were formed. Thus, YCPFPG was used as a performance indicator which could potentially indicate how fouls and yellow cards influence performance in combination.
Statistical Analysis: Multiple Linear Regression
Multiple linear regression was conducted separately for both Points and GA as dependent variables to indicate performance over the season. The independent variables were FPGNorm, YCFNorm, and YCPFPG, season, and league. The variations in baseline levels and the interaction effect of variables on each other were accounted for using three separate models for FPGNorm, YCFNorm, and YCPFPG. In each of the models, an interaction effect of the investigated independent variables with the league was introduced to explore league wise differences. Hence, the models used for investigation were as follows:
The above models were further tested for out of sample validity using K-Fold cross-validation (K = 5). All the analysis was conducted using Excel 2016 and custom routines written in Python 3.7.1 and R 3.6.2. The generalized linear model routines from the H2O library were used to build the models and conduct k-fold cross-validation.
Results
The initial post hoc regression analysis results showed a change in the amount of FPGNorm and YCFNorm across leagues as the seasons progressed. The YCFNorm increased, and the FPGNorm seemed to decrease with each consecutive season. A correlation between YCFNorm and FPGNorm was also observed. Although there was a difference in the base rates (intercepts) of each league’s fouling behavior, the correlation of YCFNorm and FPGNorm was consistently positive. It increased with each consecutive season across all leagues.
Regression Results
Table 1a below shows the regression results predicting the end of season points using FPGNorm, season, and league as independent variables. The results show significance while indicating points (p < 0.001,
Table 1a
Pts vs. FPGNorm
Table 1b below shows the regression results to predict the total end of season goals conceded (GA) using FPGNorm, season, and league as independent variables. The model significantly predicts GA (p < 0.001,
Table 1b
GA vs. FPGNorm
[i] Note 1: GA = Total goals conceded at the end of the season, Pts = End of season points total, FPGNorm = Fouls Per game normalized for out of possession (See normalization sections in Methods), BL = German Bundesliga, FL = French League One, LaLiga = Spanish Soccer league, EPL = English Premier League.
Figure 1a below shows the simple correlation between FPGNorm and Pts for all 5 leagues, while Figure 1b shows the relationship between FPGNorm and GA visualizing the results shown in Table 1,
Figure 1
Correlation between Out of possession fouls (FPGNorm) and End of Season Performance in terms of total goals conceded and total points accumulated for top 5 European soccer leagues
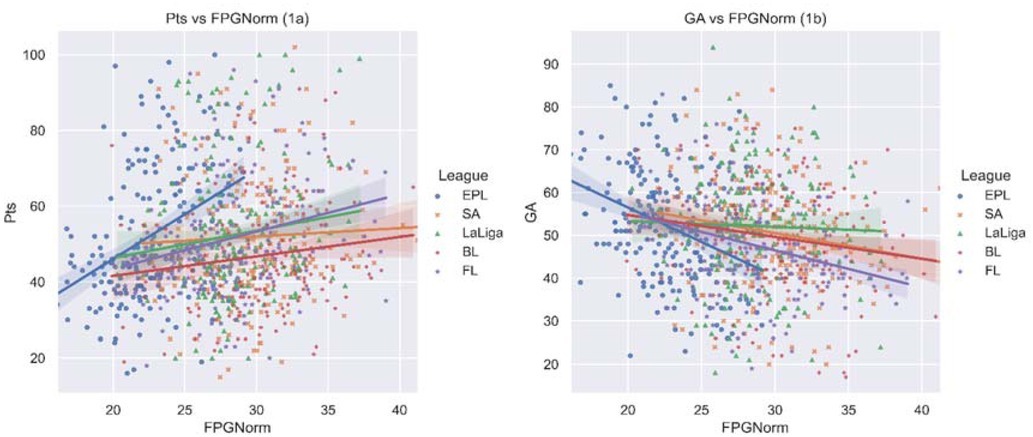
Table 2a below shows the regression results predicting the end-of-season points with YCFNorm, season, and league as independent variables. The model significantly predicts points (p < 0.001,
Table 2a
Pts vs. YCFNorm
Table 2b shows the results of a regression performed to predict GA using YCFNorm, season, and league as independent variables. The model significantly predicts GA (p < 0.001,
Table 2b
Pts vs. YCFNorm
[i] Note 2: GA = Total goals conceded at the end of the season, Pts = End of season points total, YCFNorm = Fouls which received a yellow card per game, normalized (See normalization sections in Methods), BL = German Bundesliga, FL = French League One, LaLiga = Spanish Soccer league, EPL = English Premier League.
Figure 2a represents the relationship between YCFNorm and Pts for all 5 leagues, while Figure 2b shows the relationship between YCFNorm and GA visualizing the differences in the leagues presented in Table 2.
Figure 2
Correlation between Normalized Yellow cards (YCFNorm) and End of Season Performance in terms of total goals conceded and total points accumulated for top 5 European soccer leagues
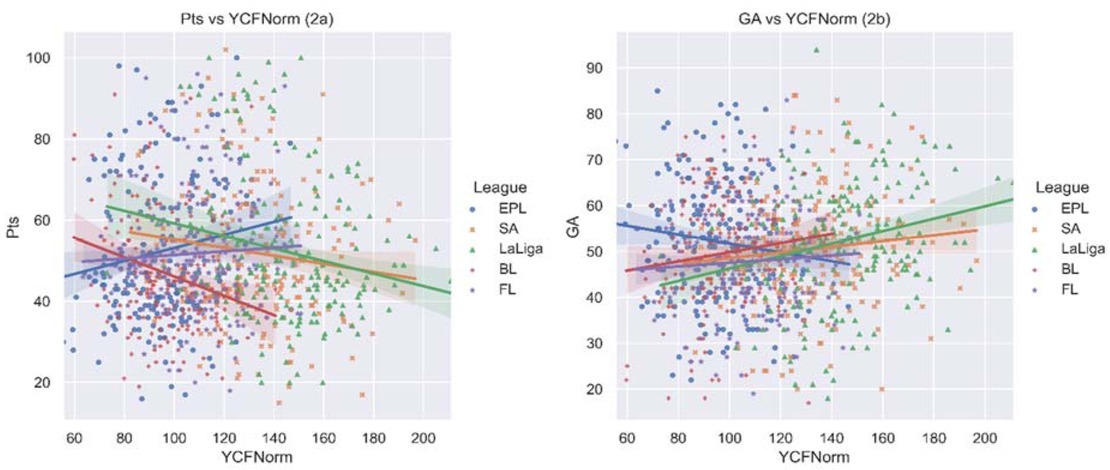
Table 3a shows the regression results predicting the end of season points with YCPFPG, season, and league as independent variables. The model significantly predicts points (p < 0.001,
Table 3a
Pts vs. YCPFPG
Table 3b shows the results of regression predicting GA using YCPFPG, season, and league as independent variables. The model significantly predicts GA (p < 0.001,
Table 3b
GA vs. YCPFPG
[i] Note 3: GA = Total goals conceded at the end of the season, Pts = End of season points total, YCPFPG = Total number yellow card fouls per game dived by the total number of fouls per game (See normalization sections in Methods) BL = German Bundesliga, FL = French League One, LaLiga = Spanish Soccer league, EPL = English Premier League
Table 4
Variance results of 5-fold cross validation for models predicting Pts and GA
[i] Note 7: Pts = End of season points total, GA = Total goals conceded at the end of the season, YCPFPG = Total number yellow card fouls per game divided by the total number of fouls per game, YCFNorm = Fouls which received a yellow card per game, FPGNorm = Fouls per game normalized for out of possession (See normalization sections in Methods),
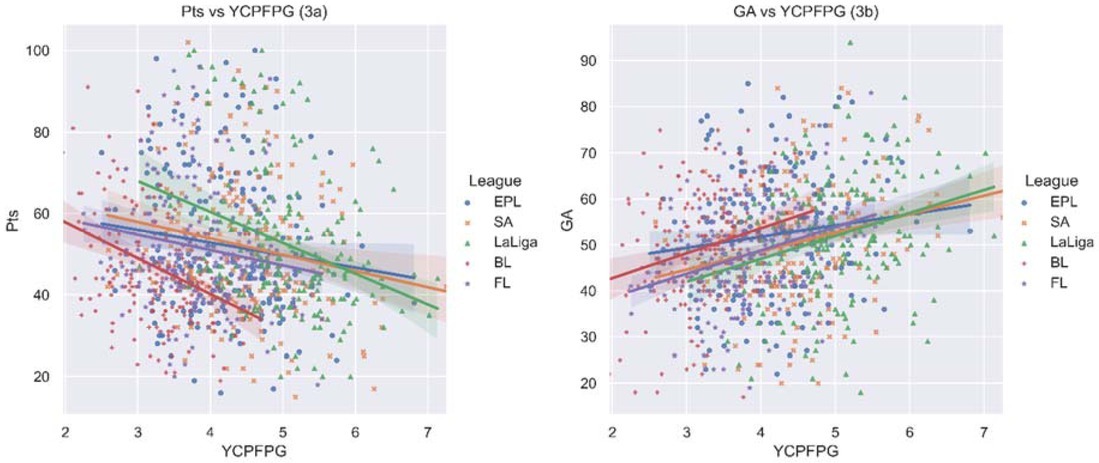
Figure 3a represents the correlation between YCFNorm and Pts for all 5 leagues while Figure 3b shows the correlation between YCFNorm and GA visualizing the results in Table 3.
Cross validation
Table 4 shows the cross-validation results for all six models. In all the cases below, the cross-validation R2 scores are lower than that of the training data. In the case of YCFNorm predicting both Pts and GA accounting in the standard deviations, R2 goes below zero. In the case of FPGNorm and YCPFPG, the standard deviations, although high, are still within the positive range.
Discussion
The present study investigates fouls as performance indicators in the European top-five soccer leagues. FPGNorm showed a significant positive correlation with points and a significant negative correlation with GA across all leagues. The EPL showed the maximum effect for both Pts and GA as compared to other leagues. YCFNorm showed a significant negative correlation with the end of season points and a significant negative correlation with GA on average for all leagues. The EPL seems to be the exception to the rule where the correlations for YCFNorm above are flipped with significance, confirming the study's initial hypotheses. YCPFPG showed a significant negative correlation with the end of season points and a significant positive correlation while predicting GA. In the BL's case, there was a significant negative correlation with YCPFPG while predicting points.
In all the above models, the cross-validation scores for R2 were lower than that of the training set, which depicts lower out of sample reliability. Considering FPGNorm and YCPFPG, the standard deviations for CV results were high, but still showed a non-zero effect on the end of season Pts and GA. This was not the case with YCFNorm, which lost reliability due to the low value and high standard deviation of R2 in the CV results while predicting both Pts and GA. Thus, we can conclude the initial hypotheses were confirmed except for YCFNorm due to low out of sample reliability.
Overall, across leagues, the total points increased every season, and GA decreased. The EPL consistently showed a significantly lower average points total and a higher number of goals conceded with every consecutive season compared to the other leagues. Although initially not hypothesized, all the leagues seemed to commit lesser YCFNorm, while YCPFPG appeared to increase every consecutive season. These observations are in line with previous results confirming that the leagues may be getting less aggressive each season, with the EPL being most competitive and aggressive (Sapp et al., 2018). The present study shows that fouls, when accounted for possession, positively predict success, which differs from previous findings, which indicate a negative relationship between success and fouls (Castellano et al., 2012; Sapp et al., 2018). This may be since previous studies did not normalize the fouls for out of possession time.
The above results may suggest that fouling while out of possession is a good strategy for success in every league, but it seems to be the most effective in the EPL. Furthermore, FPGNorm seems to predict defensive performance more accurately than the overall end of season performance. This is evident from the cross-validation scores in Table 4, which show a lower standard deviation for R2 scores while predicting GA as compared to the Pts. A large number of fouls committed at the elite level are intentional (Gümüşdağ et al., 2011; Wright and Hirotsu, 2003). Hence, further research on tactical fouls, the foul's position, and change in the expected goal (XG) after the foul is needed.
The results of YCFNorm may suggest that while committing fouls worthy of a yellow card may be a bad strategy for success overall, in the EPL committing yellow card worthy fouls seems to be beneficial. It may also suggest that most of the yellow cards received partly indicate tactical fouls as it is harder to get a yellow card in the EPL due to lower strictness levels of referees while calling fouls and giving yellow cards in this particular league (Gümüşdağ et al., 2011; Unkelbach and Memmert, 2008). It should be noted that the CV results indicate that the standard deviation on the R2 values is high, which leads to low reliability of the given model and the effects of YCFNorm suggest a need for further investigation on fouling behavior in the EPL with a more extensive and more detailed sample including the location of foul, the position of players, etc.
The results of YCPFPG may suggest that fouling without getting a yellow card seems to be a good strategy for success in general, but neither of the individual leagues show this trend. Hence, this seems to be a novel case of Simpson’s paradox, where the trend for an entire dataset is different compared to the component leagues (Simpson, 1951). Season and league differences in fouling behavior observed in the present study suggest that fouling behavior in each league may show different results in accordance with previous findings (Sapp et al., 2018). Hence, it is necessary to separate leagues while concluding for the purpose of practical implications.
Possession has been extensively studied as a performance indicator in various game situations, accounting for team strength, home-away factors, the zone of possession, etc. Previous studies suggest that possession seems to successfully predict success when accounted for performance in the whole season (Casal et al., 2017; Göral, 2015; Jones et al., 2004; Mayr et al., 2019; Mitrotasios et al., 2019). Due to the nature of the game of soccer, ‘which team has possession of the ball’ intrinsically defines the phase of play, i.e., whether the team is attacking or defending. The FPG and YCF in the present study would show different results if not normalized (see Appendix). This knowledge is crucial for modeling any KPIs for predicting performance, as it may lead to unreliable or inaccurate results due to missing normalization. Hence, the present study proposes both individuals and team KPIs should be normalized for in and out of possession time of the team in concern. Depending on what phase of play (defensive or offensive) the particular KPI is relevant for. Furthermore, the study of KPIs post normalization would have intrinsic meaning in sport-specific knowledge from a perspective of performance analysis.
Significant data and modern machine learning approaches are already a part of performance analysis, forecasting, and prediction (Couceiro et al., 2016; Dutt-Mazumder et al., 2011; Memmert et al., 2017; Rein and Memmert, 2016). The machine learning algorithms are excellent at improving the model's prediction and forecasting capability, but they still are a ‘black-box’ approach. Hence, building-in domain-specific knowledge in such algorithms' input features becomes crucial for interpreting the results along with data-based objectivity, both of which are essential factors for performance analysis, talent identification, and recruiting (Bergkamp et al., 2019; Honegger, 2018; Sarmento et al., 2018). The normalization technique in the present study, with the theoretical background, is an excellent ‘used case’ for building-in domain-specific knowledge. It provides a strong base for the application of cumulative research in notational analysis for invasion sports.
Conclusions
The present study confirms that out of possession fouls and the ratio of yellow cards to fouls seem to significantly predict success, i.e., low GA and high Pts. All models in the present study predict defensive performance better than overall performance (Table 4). Furthermore, all leagues seem to be getting stricter each year. In summary, ‘dirty play’ seems to work the best in the EPL compared to other European leagues in the current study. That may be due to the teams adopting a strategy to take advantage of the lower referee strictness. The normalization procedure suggested in the present study for in and out of possession actions can be applied in other analogous invasion sports.
With the rise of large databases and new machine learning algorithms, the suggested structure in the present study can further improve the efficiency of player recruitment, improve betting odds, and help improve the sports forecasting industry. Teams and coaches can apply the study's findings in formation on effective strategy with and without the ball. They can further use phase-specific notational statistics (post normalization) to select the right personnel based on self and the opposition team's data.
With big data, access to computational power, and sport-specific knowledge combined with Auto ML algorithms, there is a potential to explore new KPI’s and seamlessly apply them in the industry (Balaji and Allen, 2018). The current study provides the first step towards fouling behavior and its effect on success in soccer and the application of normalization techniques for KPI’s. Further detailed research with larger datasets and more sophisticated algorithms is needed to understand the current findings' full impact.
