Introduction
The subject of landings in gymnastic sports is important due to the accompanying injuries. Landings in gymnastics are a crucial element which is incorporated in every routine in each artistic gymnastic event. Gymnastic landings should be both proper in terms of judge scores and safe for the athlete (Kochanowicz et al., 2016). Although the issue has been repeatedly investigated, especially by using kinematic and dynamic analyses (Mills et al., 2009), there is limited insight into the activity of individual muscles during landings and the development of neuromuscular coordination in gymnasts when compared with a control group of non-athletes (Christoforidou et al., 2017).
The risks of landing injuries are associated with loads that affect the musculoskeletal system (Dai et al., 2015; Dufek and Bates, 1991). With regard to landings, the main loading is focused on lower limbs and the trunk. In high performance sports, where jumping is the primary technique, there is a tendency to transfer larger forces acting on the knee and spine, which can contribute to serious injuries. The higher the ground reaction forces (GRF) during landings, the higher the risk of injury, especially of the anterior cruciate ligament (ACL) (Leppanen et al., 2017; Yu and Garrett, 2007).
It was previously shown (Horita et al., 2002) that proper and thus safe landings were characterized by muscle activation and consequent contraction just before the touchdown. One of the methods suited to evaluate muscle activity includes surface electromyography (SEMG). An advantage of SEMG is the possibility to assess activation levels of different muscle groups during the two phases of landing: the preparatory or pre-landing phase and the actual landing phase, where GRFs can be recorded by a force plate. The muscle activity differs depending on the landing task, whether it demands a full stop of the motion or a rebound in drop jumps (Wang et al., 2017). The landing strategy is also adjusted to the surface on which the landing takes place, thus resulting in changes in muscle activity (Arampatzis et al., 2001, 2002).
The muscle activity before landing, associated with initial tension of the lower limb (Butler et al., 2003) as well as joint stiffness (Ambegaonkar et al., 2011), is necessary for amortization during the contact with the ground (Horita et al., 2002) and decreasing joint angular velocities (Neptune et al., 1999). Moreover, the lower limb stiffness also depends on the individuals’ strength abilities. On the other hand, it was shown that increased quadriceps femoris contraction (caused by increased activation) during the deceleration phase might lead to an increased risk of tearing the ACL (DeMorat et al., 2004).
Muscle activity changes both during the ontogenetic development (Dotan et al., 2012) and as a training effect (Felici, 2006). It was previously reported that young gymnasts in comparison with adult athletes exhibited different patterns of muscle activity in other fundamental skills such as a handstand (Kochanowicz et al., 2018). It is expected that some differences in muscle activation should also be observed during landings. It seems that various landing strategies can modulate GRFs and thus also the load on the musculoskeletal system (Prapavessis and McNair, 1999). Therefore, it is important to investigate how muscle activity develops in the course of longterm gymnastic training and if it could be associated with the above mentioned risk factors.
Therefore, the aim of the study was to evaluate the differences in GRFs and SEMG of selected muscles involved in landings between gymnasts in three subsequent stages of gymnastics training and age-matched nonathletes.
Methods
Participants
Overall, 46 male artistic gymnasts (G) and 58 male controls (C) participated in the study. Gymnasts were divided into three groups that represented particular stages of gymnastic training: the basic (G1: 8–10-year-olds), directed (G2: 12–14-year-olds), and specific stage (G3: 18–25-year-olds). Controls were age-matched untrained counterparts (C1, C2, C3). The characteristics of the groups are presented in Table 1.
Table 1
Characteristics of the participants (n = 104) (mean ± standard deviation).
| 8–10-year-olds | 12–14-year-olds | 18–25-year-olds | ||||
|---|---|---|---|---|---|---|
| Variable | Controls | Gymnasts | Controls | Gymnasts | Controls | Gymnasts |
| (n = 22) | (n = 20) | (n = 19) | (n = 15) | (n = 17) | (n = 11) | |
| Body mass (kg) | 33.50 ± 3.76 | 28.18 ± 8.04* | 51.57 ± 2.80 | 42.63 ± 7.60 | 76.57 ± 14.46 | 70.39 ± 2.83 |
| Height (cm) | 136.84 ± 6.59 | 130.85 ± 6.56* | 158.34 ± 8.61 | 154.13 ± 9.04 | 175.22 ± 6.16 | 172.25 ± 4.35 |
| BMI (kg ∙ m–2) | 17.71 ± 3.03 | 16.49 ± 2.23 | 20.33 ± 10.24 | 17.83 ± 1.77 | 25.02 ± 4.58 | 23.74 ± 0.96 |
All gymnasts were elite-oriented or at least prospective gymnasts and had started their training career at the age of 6–7 years. All measures were applied when gymnasts were in a competitive training phase. The three groups of gymnasts (G1, G2, and G3) trained 12, 22, and 24 hours per week, respectively. The control group individuals were physically active (4–6 hours of sports activities per week), but not involved in structured sports training. None of the participants had a medical history of an injury or neuromuscular disorder within the preceding two years. All measurements were taken 2–3 hours after the first meal in the morning, and each participant was well hydrated.
The study was conducted in accordance with the Declaration of Helsinki and approved by the Bioethics Committee at the Ludwik Rydygier Collegium Medicum in Bydgoszcz of the Nicolaus Copernicus University in Toruń (KB 187/2013). All participants or their legal guardians provided informed written consent to participate in the study and were informed of the potential risks and benefits of the study.
Design and Procedures
This cross-sectional study was designed to evaluate SEMG differences in a jump-landing task among gymnasts at three different stages of training and age-matched controls. The results of SEMG and jump-landing on a force plate served as dependent variables, while the group (gymnasts/controls) and the age category were considered independent variables. Before the proper examination, all participants underwent familiarization with the study procedures. The actual study consisted of two parts. First, participants’ basic anthropometric characteristics (body height and mass) were measured, as well as the maximal voluntary contraction (MVC) of the dominant lower limb (indicated by kicking ball preference) and the trunk. Second, participants performed a jump-landing task on a force plate with simultaneous SEMG recording. SEMG was also recorded during the MVC for normalization. Before the MVC and jump-landing task measurements, each participant underwent a 5-min standardized warm-up.
Measures
Maximal Voluntary Contraction
Prioritizing simplicity and reliability, we finally chose the isometric MVC for normalization of SEMG signals recorded during the jumplanding task (Burden, 2010). The MVCs were performed under isometric conditions both on a Biodex System 4 isokinetic dynamometer (Biodex Medical Systems Inc., Shirley, NY, USA) and with manually applied resistance. In the procedure, the focus was set on the muscle groups contracting eccentrically to decelerate forces acting on the body, i.e. trunk, hip, and knee joint extensors and ankle flexors. The MVC for the ankle joint was performed on the Biodex System 4 with the hip, knee, and ankle joints flexed at 135°, 45°, and 10°, respectively. The participant’s pelvis was stabilized using leather straps and the shank and knee were supported by a leather bracket. Participants were instructed to use their feet only, not to push or pull their legs. The detailed position of the remaining investigated muscle groups (trunk, knee, and hip extensors) was previously described and shown elsewhere (Kochanowicz et al., 2019). In each position, participants performed three 4-s repetitions, with verbal encouragement to maximize their effort. The 4-s duration of the MVC was chosen as a compromise between 3 and 5 s used by other researchers. There were 1-min rest intervals between repetitions to reduce the effects of fatigue.
Jump-Landing Task
Each participant performed three countermovement jumps (CMJs) on a force plate (type 9286B, Kistler, Winterthur, Switzerland). This approach allowed taking into account the individual potential in the context of the development of landing control mechanisms. Considering a well-defined height of the drop landing, the examined mechanisms might not correspond to the individual power, force, or anthropometric characteristics (Christoforidou et al., 2017). Moreover, even if the height of the drop landing is adjusted to the CMJ peak height, differences in GRFs and muscle activity between the CMJ and landing from a fixed height are observed (Afifi and Hinrichs, 2012). Therefore, in addition to the landing itself, jump indicators should be taken into account which determine the landing action.
During the task, participants had their bare feet positioned at pelvis width and parallel to each other. The hands lay on the hips during the entire performance. Each participant received an instruction to explosively bend the knees approximately to 90° (eccentric phase), jump as high as possible (concentric phase), and land afterwards on the force plate on both legs so that the metatarsus was the first element of contact with the platform (landing phase) (Hebert-Losier and Beaven, 2014). If the knee angle or landing did not meet the above criteria, the trial was repeated. There was a 1-min rest interval between the attempts. The best performance in terms of the jump height was chosen for further analysis.
The GRF data were recorded with a 600 × 400 × 35 mm force plate (type 9286B, Kistler, Winterthur, Switzerland) at a sampling rate of 200 Hz. The force plate had a measuring range of 0–10 kN and sensitivity of –3.6 pC/N. The analysis was carried out with the same manufacturer’s software (MARS, type 2875A1). The following jumping variables of the concentric phase were used for statistical analysis: peak power relative to body weight, jump height relative to body height, and peak GRFs. Peak GRFs were also investigated during the eccentric and concentric phase of the CMJ (Hebert-Losier and Beaven, 2014). Subsequently, during the landing, we analyzed: peak GRFs, time to peak GRFs, the rate of GRF development in the first (0–100 ms) and second (100–200 ms) period after contact. GRF indices were normalized to the participants’ body weight, while the rate of the GRF development to the landing peak GRFs.
The reliability of the jump and landing measures on force plates were widely described previously with the use of the intra-class correlation coefficient (ICC) in both non-athletes (ICC = 0.77–0.86) (Hebert-Losier and Beaven, 2014) and gymnasts (ICC = 0.65–0.74). Moreover, it was reported that both non-athletes (Acero et al., 2011) and gymnasts (Marina and Torrado, 2013) of young age were characterized by good repeatability of performance during jumping tasks.
Surface Electromyography
SEMG signals were received using Ag/AgCl electrodes with 1 cm2 of the active area (Sorimex, Toruń, Poland), with an inter-electrode distance of 20 mm. The signals were recorded and subsequently processed and analyzed by Noraxon’s (Scottsdale, AZ, USA) TeleMyo DTS EMG system and MyoResearch 1.08 software. They were gathered with a sampling rate of 1500 Hz and 10–500 Hz bandpass filter. The applied EMG system had an input impedance of above 100 MΩ, a base gain of 500, and a common-mode rejection of above 100 dB. Electrode placement and the preparation of the participants’ skin were performed in accordance with the SENIAM recommendations (Hermens et al., 1999) including scrubbing, cleaning with alcohol, and shaving, if necessary.
Four muscles of the dominant lower limb and ipsilateral side of trunk were investigated: rectus femoris (RF), gastrocnemius (GC), gluteus maximus (GM), and multifidus (MF). The RF, as a part of the quadriceps femoris, was chosen for this investigation owing to its strong connection to risks of the ACL rupture (Macleod et al., 2014). Moreover, previous studies successfully used the RF alone to investigate neuromuscular changes during jumping and landing tasks (Peng et al., 2011). The activity of the GC muscle was presented as average of its medial and lateral part.
SEMG data processing included full wave rectification and smoothing by root mean square (RMS, μV) values with 50-ms time frames. Analysis of the SEMG recordings was carried out using three distinct landing time periods: 1) 100 ms before the landing, 2) first (0–100 ms) and, 3) subsequent (100–200 ms) 100 ms period after contact measured with the force plate. To reduce inter-individual variability, the RMS was normalized to the signal recorded during the MVC. This was calculated as the peak value obtained during a 1-s time frame taken from the middle 2 s of the MVC performance. Normalized RMS (NRMS) was expressed as a percentage (Burden, 2010). The reliability of the SEMG measures was studied previously and was found to be sufficient to investigate muscle activity during dynamic contractions including jump and landing tasks (Fauth et al., 2010).
Statistical Analysis
Shapiro-Wilk and Levene tests were used to check the normal distribution of the variables and the homogeneity of variance, respectively. To assess the significance of the differences in SEMG signals and force plate outcomes between the gymnasts and untrained participants in three age categories, a two-way (2 groups × 3 age categories) ANOVA was performed. The first between-subjects factor (group) indicated whether the participant underwent long-term artistic gymnastic training or belonged to the control group. The second factor (age) implied three age categories: 8–10 (A1), 12–14 (A2), and 18–25 (A3) years, which in gymnasts also represented three different stages of training (basic, directed, and special, respectively). The Tukey’s post-hoc test with amendment for different group sizes was implemented when interaction between factors or the main effect was observed. The effect size of each factor was calculated using partial etasquared (η2) statistics, and the effect was recognized as trivial for values ranging 0–0.01 and as small, moderate, and large for those above 0.01, 0.06, and 0.14, respectively (Levine and Hullett, 2002). The Pearson correlation coefficient (r) was calculated to assess the correlation between jump performance and landing variables. If a particular result exceeded three standard deviations, it was considered as an outlier and excluded from the analysis. The effect was regarded statistically significant for p < 0.05. All analyses and graphs were performed with Statistica 13 commercial software (Statsoft Inc., Tulsa, OK, USA).
Results
Jump
The analysis of variance (Table 2) showed a significant effect of gymnastic training (group factor) on the relative peak power during the CMJ. Gymnasts, regardless of the stage of sports training, were characterized by 9% higher values of this variable compared with the control group. In addition, increasingly higher values were observed in subsequent age groups. The results for 12–14-year-olds were 24.6% higher than those in the youngest group, while the 18–25-year-old participants (A3) achieved 47% and 17.6% higher results in comparison with the A1 and A2 groups, respectively. No significant interaction of both factors was observed.
Table 2
Two-way (2 groups × 3 age categories) ANOVA tests for countermovement jump outcome.
Analysis of variance of the relative CMJ height showed a significant effect of both factors (Table 2). Gymnasts achieved a 21.5% higher relative height of the CMJ in comparison with the control group. Similarly to the case of peak power, the relative jump height reached higher values with higher age categories (A1: 14% < A2: 17% < A3: 19%).
The correlation analysis between jump performance and landing variables is shown in Table 3. The relative height of the CMJ was significantly correlated with each analyzed landing variable in all participants: relative peak GRFs, the rate of GRFs in 0–100 ms and 100–200 ms and time to peak GRFs. Besides time to peak GRFs in 8–10 years old gymnasts, within particular groups the correlations were nonsignificant (Table 3).
Table 3
Correlation between jump performance and ground reactions forces (GRFs) outcome.
| Relative jump height | Absolute jump height | |||||
|---|---|---|---|---|---|---|
| Relative peak | Overall: | G1: 0.10 | C1: -0.01 | Overall: | G1: 0.08 | C1: -0.04 |
| landing GRF | 0.29* | G2: 0.39 | C2: 0.36 | 0.19 | G2: 0.39 | C2: 0.30 |
| G3: 0.40 | C3: 0.24 | G3: 0.46 | C3: 0.18 | |||
| Absolute peak | Overall: | G1: 0.05 | C1: -0.25 | Overall: | G1: 0.24 | C1: -0.14 |
| landing GRF | 0.45* | G2: 0.28 | C2: 0.40 | 0.64* | G2: 0.47 | C2: 0.47* |
| G3: 0.35 | C3: 0.07 | G3: 0.44 | C3: 0.04 | |||
| Rate of GRF | Overall: | G1: 0.17 | C1: -0.10 | Overall: | G1: 0.17 | C1: -0.14 |
| development | 0.20* | G2: 0.21 | C2: 0.08 | 0.03 | G2: 0.22 | C2: -0.02 |
| (0-100 ms) | G3: 0.53 | C3: 0.26 | G3: 0.59 | C3: 0.16 | ||
| Rate of GRF | Overall: | G1: -0.19 | C1: -0.06 | Overall: | G1: -0.24 | C1: -0.06 |
| development | -0.21* | G2: -0.22 | C2: 0.21 | -0.11 | G2: -0.29 | C2: 0.23 |
| (100-200 ms) | G3: -0.55 | C3: -0.28 | G3: -0.61* | C3: -0.22 | ||
| Time to peak | Overall: | G1: -0.59* | C1: -0.05 | Overall: | G1: -0.46* | C1: -0.05 |
| GRF | -0.26* | G2: -0.34 | C2: -0.37 | -0.25 | G2: -0.29 | C2: -0.25 |
| G3: -0.55 | C3: -0.36 | G3: -0.55 | C3: -0.28 | |||
The effect of gymnastic training on the relative peak GRFs during the eccentric phase of the CMJ was not observed. The effect of age factor proved to be significant (Table 2). Only the group of adults reached significantly higher values compared with the youngest age group and that of 12–14-year-olds (17% and 11%, respectively). The results of the relative peak GRF during the concentric phase reflected those observed during the eccentric phase, showing only the effect of age factor. However, participants presented significantly higher values in all subsequent age groups (A1: 197% < A2: 207% < A3: 223%).
Landing
Ground Reaction Forces
The GRF outcome is presented in Figure1. Analysis of variance of the relative peak GRFs showed a statistically significant group effect (Table 2). Gymnasts achieved 13% higher values of GRF in comparison with the control group. Post-hoc tests of the interaction of both effects indicated that GRFs were about 33% higher in G1 than in C1 or G2 (Table 2). The main effect of age was non-significant.
Figure 1
Force plate results during the landing task in gymnasts (dark bars) and non-athletes (gray bars) Relative peak (A) and time to peak GRF (B); relative rate of GRF development in 0–100 ms (C) and 100–200 ms (D) after contact. BW – body weight, GRF – ground reaction force, *significant difference at p < 0.05.
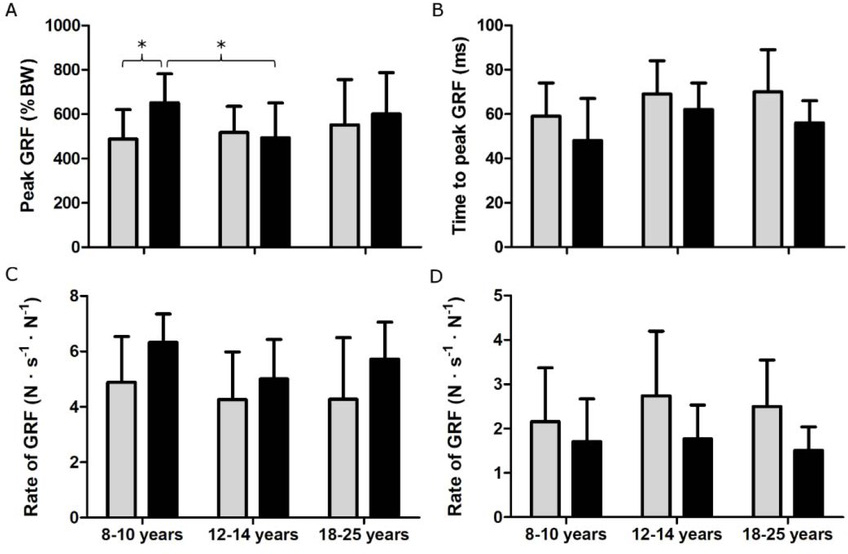
Both of the analyzed variables, group and age, showed a significant effect in the time to the peak GRFs (Table 2). Gymnasts reached peak GRFs 16.6% faster than the control group. It was also observed that in the youngest age group, the analyzed outcome was 18% lower than in the other two age groups.
The analysis of the relative rate of GRF development over the 100-ms period from contact with the force plate indicated a significant main effect of the group and age factors (Table 2). Gymnasts achieved 28% higher results than the control group. The highest results between particular age groups were obtained by the youngest participants (A1), with 21% and 14% lower results in the A2 and A3 age groups, respectively.
The next analyzed time period of the rate of GRF development was 100–200 ms after contact with the ground. In the analysis of this period, only a significant effect of the group factor was demonstrated (Table 2). The control group obtained 46% higher results than gymnasts.
Surface Electromyography
All the means and standard deviations of SEMG outcomes are shown in Table 4. Analysis of variance revealed a significant effect of gymnastic condition (group factor) on NRMS of the MF, as well as the GM and GC muscles in the 100-ms period before landing (Table 5). Gymnasts, regardless of the training stage, were characterized by twice lower activity of the MF and GC in comparison with the control group, while the NRMS of gymnasts’ GM was 26.7% lower than in the control group (Table 5). With regard to the MF and GM, in addition to the significant impact of gymnastic training, analysis of variance also showed a significant effect of age. As a result of the post-hoc analysis, it was observed that the group aged 8–10 years reached 70% (MF) and 37–66% (GM) higher values of muscle activity in comparison with the older groups (A2, A3). Analysis of variance of the RF outcome also proved a significant effect of the age factor. In this case, NRMS in each subsequent group was lower (A1: 43.5%, A2: 28.1%, A3: 16%). There was also an interaction of the age and group factors (Table 4).
Table 4
Normalized muscle activity (percentage of maximal voluntary contraction ± standard deviation).
Table 5
Two-way (2 groups × 3 age categories) ANOVA tests for the neuromuscular outcome during landing.
[i] MF – multifidus, GM – gluteus maximus, RF – rectus femoris, GC– gastrocnemius,
G– gymnasts, C– control group, A1 – 8–10-year-olds, A2 – 12–14-year-olds, A3 – 18–25-year-olds, C1, C2, C3, G1, G2, G3 – particular age groups of controls or gymnasts. Significant difference at *p ≤ 0.05, **p ≤ 0.01, ***p ≤ 0.001.
In the early landing period (0–100 ms), a significant effect of gymnastic condition (group effect) was observed in the NRMS amplitude of the MF, GM, RF, and GC muscles. Gymnasts, regardless of the training stage, were characterized by 33% lower activity of the MF and GM muscles, while the activity of the RF and GC was 15% and 26% lower compared with the control group, respectively. A significant effect of age was observed for MF, GM, and RF muscles (Table 5). The A1 group showed 75% and 154% (GM), and 47% and 80% (RF) higher NRMS in comparison with the A2 and A3 groups, respectively. The NRMS of the MF in the A1 group was 48% higher than in both older groups (A2, A3).
In the late landing period (100–200 ms after contact), a significant group effect was seen in the NRMS of the MF and GC muscles. Gymnasts were characterized by about twice (MF, GC) less muscle activity as compared with their control counterparts. Analysis of variance of the NRMS amplitude showed a significant effect of the age factor (Table 5). The NRMS in the A1 group was 35% and 44% higher compared with that in A2 and A3, respectively. The age effect was also observed for the MF muscle. In this case, the oldest group (A3) presented 84% and 148% higher NRMS in comparison with the A1 and A2 groups, respectively. The MF was also the muscle that revealed interaction of both main effects (Table 5). The differences between particular groups are presented in Table 4.
Discussion
The study illustrated the differences between gymnasts representing three different stages of sports training and age-matched untrained subjects both in the biomechanical indicators of the jump-landing task and in their neuromuscular characteristics.
The main and novel outcome was that the youngest group of gymnasts were characterized by higher relative peak GRFs during the landing than untrained subjects, as well as their 12–14-year-old training peers. They reached GRFs at the level of 6.5 times of body weight, while their untrained peers and the group of 12–14-year-olds obtained the value of only 5 times their body weight. These higher GRFs, apart from being explained by the superior jumping performance of the young gymnasts in comparison to their untrained peers, also suggest that their musculoskeletal system must endure greater relative mechanical loads, even after normalization to body weight. It is remarkable that the youngest gymnasts’ normalized GRFs were higher not only at the same age in spite of being smaller and lighter than untrained peers, but also in comparison to gymnasts at the directed stage of training. Thus, body dimensions appear to have a lesser impact on this outcome, in comparison to the inter-muscular coordination necessary to damp the impact.
The noted differences could be caused by 32% greater jump height compared with nonathletes, both in absolute values and relative to body height. However, Christoforidou et al. (2017) revealed that regardless of fixed landing heights (20, 40, 60 cm), gymnasts aged 9–12 were also characterized by higher GRF compared with untrained subjects. Moreover, the older groups of gymnasts (12-14 and 18-25 years old), also had greater jump height, but there was no significant difference in GRFs between gymnasts and nonathletes. Therefore, in the present study, apart from jump height, which certainly plays a role in the observed EMG and GRF outcomes of the youngest gymnasts in comparison to their control peers, other factors may be considered. Increased GRFs in gymnasts may also result from specific requirements of gymnastics, since landing should be quickly amortized and characterized by the smallest movement just after the initial contact with the ground, thereby increasing the risk of injury (Prapavessis and McNair, 1999).
It is possible that young gymnasts achieve the desirable landing characteristics, but their landing strategy (including lower limbs stiffness) is not effective enough in GRF reduction as in older and more experienced athletes. The other GRF-derived outcome confirms this statement. While the time to peak GRFs was shorter in gymnasts, especially young, a high correlation with the relative jump height was observed, and could be interpreted as an effect of increased stiffness (Arampatzis et al., 2001). Our results do not support those of other authors (Seegmiller and McCaw, 2003), who found no GRF differences between adult gymnasts and other recreational athletes. They also showed the highest rate of GRF development during the first 100 ms after landing. One of the reasons for that could be specific landing strategy adjusted to the more elastic surface provided by gymnastic mats, used during training and competitions. It was previously shown that adult gymnasts modulate their total body stiffness in response to landing surface condition (McNitt-Gray et al., 1994) to maintain similar values of GRFs (Arampatzis et al., 2002). Probably, young gymnasts are yet unable to modulate the landing strategy efficiently like their older peers. Obtaining high GRF values in a very short time poses a certain risk of damage to the movement apparatus involved in the landing process. The risk of tissue damage rises with the ratio of changes in GRFs to their duration. It was confirmed that GRFs may be affected by instructions regarding the technique of landing in children and adolescents, whether they were training gymnastics or other recreational sports (Prapavessis and McNair, 1999). Therefore, attention to the landing technique at early stages of sports training can improve not only its effectiveness, but also reduce potential risk of injuries (Daly et al., 2001).
The lack of difference in GRFs in older and more experienced male gymnasts and their untrained peers (12-14 and 18-25 years old) is consistent with McNair and Prapavessis’ (1999) results. Among 234 people of both sexes (average age: 16 years) active in both recreational and professional sports, they showed that GRFs did not differ between groups of different sports level but same gender when landing from 33 cm. We must emphasize that in the current study, the CMJ was used instead of the fixed height drop jump. The height from which our participants landed was within similar limits of 17–37 cm. Another analysis of landings revealed significantly higher GRFs only at the heights of 60 and 90 cm among adult female gymnasts compared with other athletes of the same gender (Seegmiller and McCaw, 2003). These results suggest that, discarding sex comparison, the jump height corresponding to the physiological capabilities (represented by the CMJ) of gymnasts at the directed and specific stage of training is insufficient to observe changes in biomechanical characteristics of landings as compared with untrained control groups. Probably, other gymnastic-trained amortization mechanisms may be utilized at lower heights.
In the present study, SEMG was used to investigate the muscle activity with the corresponding GRF outcome in order to provide insight into the individual muscles and muscle groups that were involved in the landing. The degree of muscle activation before contact with the ground results from the height from which the landing occurs. However, no significant differences were observed in the amplitude before landing at a height of 40–60 cm (Mrdakovic et al., 2008). Thus, the height at which the study participants landed should not affect the activity of the examined muscles.
In this study, the age factor contributed to the differences in muscle activity during landings. In most cases, the 8–10-year-old children exhibited higher muscle activity in comparison with the 12–14- and 18–25-year-old participants. This is in accordance with other authors (Dotan et al., 2012), who observed that muscle activity decreases from childhood across adolescence into adulthood during specific submaximal tasks. This decreased muscle activation could be explained by improved neuromuscular control in terms of nervous system maturation, probably associated with an increased capability of recruiting higherthreshold type-II motor units (Dotan et al., 2012). The exception of the above mentioned rationale is found in the EMG outcomes of the GC muscle. The normalized GC’s SEMG values were similar among all age groups in each analyzed landing period. This may suggest that the GC muscle reaches its neuromuscular potential earlier, as jumping and landing are natural and spontaneous forms of physical activity that occur in many children’s games.
In gymnasts, starting from the youngest group, during the 100-ms period before landing, the amplitude of muscle activity involved in the landing amortization (GM, RF, GC) was nearly twice lower than in the control group. The RF muscle activation in the youngest gymnasts (8–10-year-old) did not differ from that in their 12–14-year-old peers. In connection with the shorter time to peak GRFs in gymnasts, these results suggest faster development and then improvement of neuromuscular coordination as a result of the specificity of gymnastic training, aimed at fast cancelation of GRFs. Therefore, landing stability is increased, but at the expense of higher overload exposure of the musculoskeletal system (Hume et al., 2013). DeMorat et al. (2004) suggested that the quadriceps could serve as the major intrinsic force in a non-contact ACL injury. Therefore, accepting the overall relationship between SEMG amplitude and tension capability of the muscle, it is plausible to think that an excessive activation of the quadriceps could lead to an excessive stiffness, and as a consequence, an augmented risk of knee injury. The superior RF activity in youngsters indicates an increased contraction that may generate “shearing” forces directed towards the front of the knee, favoring the probability of some kind of overuse or ACL injury.
At the time of contact with the ground and in subsequent periods, muscle activity results from the pre-activation typically reported to increase stiffness when preparing for landing (Ambegaonkar et al., 2011; Arampatzis et al., 2001). In all groups, during the first 100 ms of landing, the activity of the MF, GM, and RF was similar to that observed before contact. The highest increase of muscle activation (up to 9 times) in the early landing phase was observed in GC. While the overall normalized SEMG values were lower in gymnasts in comparison with the control group, gymnasts increased their relative muscle activation relatively more than the controls. In the first 100 ms from the time of contact with the force plate, the peak GRFs were also observed, showing that the major landing impact was absorbed by ankle joints and GC muscles, as the activation of the RF did not change substantially.
In the last analyzed period (100–200 ms after contact), the MF, GM, and RF muscles increased their activity, whereas GC activity remained relatively unchanged and the highest of all analyzed muscles. Interestingly, the 18–25-year-old control group showed exceptionally higher normalized SEMG of the MF in comparison with gymnasts of the same age, as well as with other participants. This could be due to alternation of landing mechanics along maturation, as reported by Read et al. (2018), where post-puberty participants exhibited increased lateral trunk flexion during one-legged landings. It could be possible that during twolegged landings, instead of the lateral flexion, the trunk’s higher ante-flexion occurs in adults; this would explain the increased activation of the antagonist muscles (MF).
The NRMS findings are opposite to those presented by Christoforidou et al. (2017), where gymnasts demonstrated higher normalized EMG signals for the GC and vastus lateralis muscles in comparison with untrained girls. However, this outcome was true only for landing from 60-cm height. Moreover, Christoforidou et al. (2017) investigated young girls instead of boys, and the normalization method was different, i.e. peak EMG during 60-cm height landing vs. the MVC presented in the study. These factors prevent from a direct comparison of outcomes, yet indicate that different landing mechanisms could be present in gymnasts during landings from greater heights in comparison with CMJ conditions.
The main limitation of the study is a lack of the corresponding kinematic or inverted dynamics analyses, otherwise investigated extensively (Gittoes and Irwin, 2012; Mills et al., 2009), that could confirm the difference in landing strategies among groups. While the abovementioned analysis would help with inferring, the present study was mainly focused on the investigation of the ontogenetic and training induced changes in landings’ muscle activity, on which knowledge is yet to be explored.
Conclusions
In the course of long-term training, gymnasts exhibit different patterns of neuromuscular coordination aimed to implement both safe and well performed landings according to the gymnastic rules. Gymnasts aged 8–10 years showed the highest relative peak GRFs, as well as its rate of development. This condition associated with the fact that landings are repeated many times during training routines may lead to overloading of the musculoskeletal system, and thus to increased risk of injuries that are common in gymnastics sports (Brueggemann, 2010; Campbell et al., 2019). Additionally, the youngest participants were characterized by an elevated activation of the RF muscle, which according to the literature (DeMorat et al., 2004; Navacchia et al., 2019) may be considered as a potential risk factor for ACL injuries. It is recommended that further studies should be focused on the relationship between different types of intermuscular coordination and the occurrence of lower limb injuries. It is necessary to monitor the gymnastic landings and modify the landing strategies if necessary, highlighting that the approach developed during training routines could be different according to the particular stage of training.