Introduction
Studies evaluating technique in athletics throwing events focus mainly on the release variables (Bartlett, 2000; Hubbard et al., 2001; Viitasalo et al., 2003), the flight of implements (Hubbard, 2000; Salo and Viitasalo, 1995), as well as athletes' kinematics (Bartlett, 2000; Liu et al., 2014), and kinetics (Yu et al., 2002). The main release variables are: the angle of release, release height and release velocity. The first two are generally constant for top-level athletes, thus it is the release velocity that mainly determines the distance of the throw (Bartlett, 2000). It has also been proven that release velocity strongly correlates with achieved performance (Bartonietz, 2000; Viitasalo et al., 2003).
Kinematic analysis has underlined the importance of the delivery phase and sequential muscle action. In the delivery phase ca. 60-75% of release speed is obtained for the javelin throw (Morriss and Bartlett, 1996) and discus throw (Bartlett, 1992). Additionally, Best et al. (1993) indicate that during the javelin throw peak velocity first occurs at the hip, then in the shoulder and then the elbow. The speed also increases in the same direction. A sequential increase in segments' velocity has also been observed in shot putting (Lanka and Shalmanov, 1982). Additionally, Leigh and Yu (2010) report that the angle between the hips and the shoulder line immediately before the flight phase in discus throwing is associated with the resulting performance level. In other kinematic studies the work of the hand action force was calculated (Landolsi et al., 2018).
To obtain information about muscle activity, electromyography (EMG) is used. Howard et al. (2017) present a map of electrical activation in chosen muscles of the lower extremities for shot putters. Those authors suggest that the conducted research will provide coaches with new information concerning throwing techniques. Meanwhile, Terzis et al. (2003) have indicated that, in fact, vastus lateralis and pectoralis major muscle activity is essential for successful shot putting.
Yu et al. (2002) collected kinetic data and found a significant correlation between ground reaction force (GRF) data and the distance achieved by discus throwers. The presence of force plates during research also permits an analysis of the energy transfer between body segments (Błażkiewicz et al., 2016, 2019).
The need for more research evaluating athletes’ technique, including the design of biomechanical models, was described by Bartlett (1992). Since computing abilities have increased significantly in recent years, new methods have been developed in biomechanics. Some of them involve simulations of movement using a detailed musculoskeletal model of the human body. Such simulations are mainly used to calculate muscle forces and activations during the gait (Delp et al., 2007). Furthermore, there have been studies (Dupré et al., 2019) which reported the use of musculoskeletal simulations in sports. Among those studies that have used mathematical modeling for athletics throws, the research of Alexander (1991) describes the use of a simple musculoskeletal model. In this work, the authors confirmed the advantages of developing the previously described sequential muscle action.
The aim of this study was to identify muscle groups responsible for the discus and javelin throw, as well as the shot put, and to determine how the activity of these muscles would differ between throwers in each event.
Methods
Participants
The study analysed the technique and performance of the nine Polish elite athletes (all males) of whom two athletes were Olympic medallists, in the discus throw, javelin throw and shot put. Detailed characteristics of the study group can be found in Table 1. All the data given in the table were valid on the day of collection.
Table 1
Characteristics of evaluated groups of athletes.
The experiments reported in the paper were performed in accordance with the ethical standards of the Declaration of Helsinki and participants signed an informed consent form.
Measures
The data were collected in an indoor biomechanical lab using nine Vicon cameras (Vicon Motion Systems Ltd, Oxford, UK) and three Kistler force plates (Kistler Holding AG, Winterthur, Switzerland). Kinematic data were recorded at 100 Hz, while GRFs (Ground Reaction Forces) were recorded at 1000 Hz. Thirty-four reflective markers were placed on each athlete’s body according to the Plug-in-Gait model. Depending on their event, athletes performed the shot put (using the glide technique) and the javelin or discus throw with implements of regular size and weight. For the shot put and the javelin throw the entire throwing action was recorded so that athletes performed the delivery phase on the force plates. The discus throw was executed from a standing position to allow proper collection of GRF data. A net was set up in the lab to catch thrown implements. Out of the complete set of throws, each athlete’s best attempt (as evaluated by their coach) was analysed further. Vicon data saved in *.c3d files were used for musculoskeletal simulations.
Design and Procedures
The length of the delivery phase of each throw was determined based on GRF data and segments’ positions. Additionally, the delivery phase was divided into three subphases for the shot put and the javelin throw, and two subphases for the discus throw. The division was made according to biomechanically significant throwing events. For the shot put and the javelin throw, sub-phase I started when the right foot made contact with the ground and continued until the left foot made contact, sub-phase II continued until the right foot toe-off, and subphase III ended with the release of the implement. Sub-phase I of the discus throw began with a standing position and continued until peak external shoulder rotation, and sub-phase II ended with the release of the implement.
The Gait2392_arms.osim model created by Tim Dorn was used for musculoskeletal simulation. The model consists of 92 muscle actuators in the lower body and has 37 degrees of freedom. All actuators included in the model are divided into muscle groups. The names of the groups and the relevant explanation are presented in Table 2.
Table 2
Muscle groups included in the model with relevant abbreviations
OpenSim 3.3 was chosen as simulation software. The Matlab OpenSim Pipeline Tool was used to transform Vicon data into OpenSim input. Next, the Gait_2392_arms model was adjusted to the athletes’ anthropometry using the Scale Tool. Motion was applied to the model using the Inverse Kinematics Tool, while the Inverse Dynamics tool was used to apply forces. Moments calculated via the Inverse Dynamics tool were compared with the Vicon data as a method of evaluation at this stage of the modelling. A Residual Reduction Algorithm was used to adjust the body centre of mass and segment masses. To estimate muscle activation and forces the Computed Muscle Control Tool was used. The velocity of body segments was estimated using the Analyze Tool. The muscle groups that participated most in the throwing events were chosen to undergo further analysis by Matlab software.
Results
Forces generated by particular muscle groups are presented in Figure 1.
Figure 1
Muscle activation pattern in the lower body for all shot putters (A), javelin throwers (B) and discus throwers (C). Muscle groups are described in Table 2. R stands for the right side and L for the left side of the body.
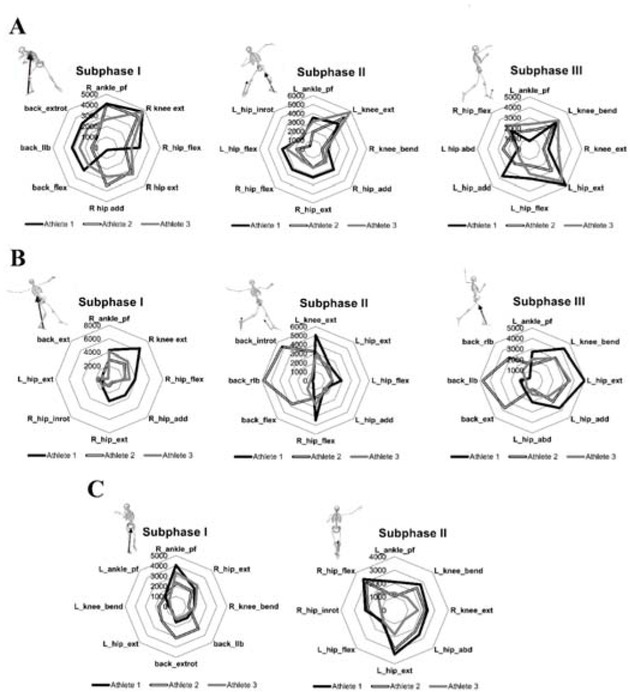
It is visible that in sub-phase I of the shot put (Figure 1 A), for each of the throwers, their right knee extensors generated the highest forces, ranging from 4000 to 5000 N. For SPA1 and SPA2 the right ankle plantar-flexors also played an important role when performing the throw. Force generated by this muscle group reached 4000 N. Additionally, SPA1 generated higher forces with three back muscle groups (back_extrot, back_llb, and back_flex) compared to SPA2 and SPA3. In sub-phase II, the profile of the generated force was similar among all the athletes, however, SPA1 generated the highest forces for all muscle groups except the left knee extensors. In sub-phase III, for all shot putters, the highest forces were generated by the left knee flexors (around 4000 N) and left hip extensors (3000-5000 N).
Sub-phase I was the most consistent of all subphases in javelin throwers (Figure 1 B). JA1 generated the highest forces for almost all muscle groups. Right knee extensors and right ankle plantar flexors generated the highest forces for all athletes. The value of the generated forces ranged between 3000-6000 N and 3000-4500 N, respectively. In sub-phases II and III, only JA1 and JA3 showed similarities. With regard to JA2, a big contribution from the back muscles (up to 6000 N) was observed, something which was not consistent with the remaining javelin throwers. Left hip extensors generated the highest forces in sub-phase III for JA1 and JA3.
Similarly to the javelin throw and the shot put, high forces (ranging from 2500 to 3000 N) were generated for right plantar flexors in sub-phase I of the discus throw (Figure 1 C). This muscle group generated the highest forces for DA1 and DA3. The force generation pattern in sub-phase I differed for DA2. In sub-phase II, muscles that generated the highest force were the left hip extensors (2000-3000 N). In general, it may be observed that in sub-phase I and sub-phase II, DA1 and DA3 presented similar patterns, however, in sub-phase II DA3 had lower values for all muscle groups. Only the value of the left ankle plantar flexors differentiated between DA1 and DA2 in sub-phase II.
For three joints i.e., the wrist, elbow, and shoulder, for which the highest linear velocity was recorded during the final acceleration phase of the movement, time trajectories are presented (Figure 2). It is visible that in the second half of the final acceleration phase, the velocity of the shoulder was lower than that of the wrist and elbow for all events. Figure 2 shows that for shot putters there was a simultaneous increase in velocity for the elbow and the wrist, however, in the javelin throw and the discus throw, for all athletes the velocity for the wrist was higher than for the elbow.
Figure 2
Time trajectories of velocity for the wrist, elbow and shoulder joints. The lines indicate the best athlete's results, whereas gray areas are set between the lowest and highest values for all athletes.
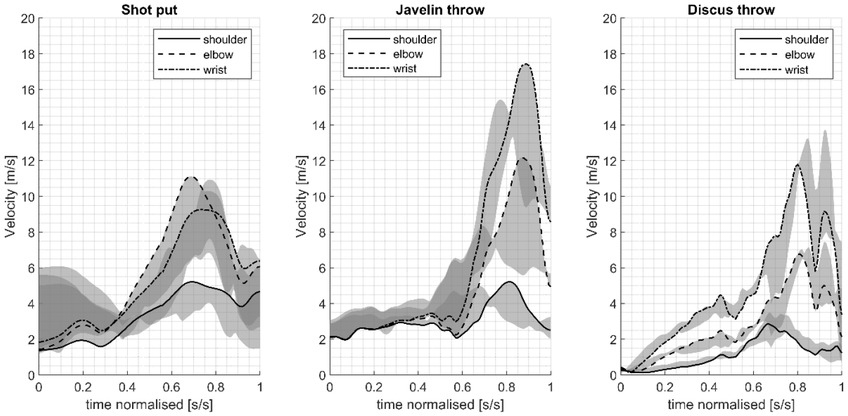
Table 3 contains peak velocity values and time (s) at the moment of peak velocity. For shot putting it was observed that the time when peak velocity occurred was similar for all the joints for SPA1 and SPA2. For SPA3, however, the maximum velocity occurred first for the elbow, then for the arm followed by the wrist. For javelin throwers sequential velocity increases were observed for all three athletes, however, for JA3 peak velocity of the arm occurred earlier, before the elbow and the wrist compared to the other athletes. For all discus throwers, the shoulder joint accelerated before the elbow and the wrist.
Table 3
Peak velocity and time at peak velocity for the shot put, the javelin throw and the discus throw
Discussion
This study presents a novel approach to evaluating athletes’ performances via musculoskeletal simulation. Since the shot put, the discus throw and the javelin throw have not been the subject of such sophisticated simulation before, the obtained results have been compared with other motion analysis methods and evaluated.
During the shot put, the javelin throw, and the discus throw, muscle groups that generate the highest forces could be identified. Plantar flexors in the right leg contributed to a large extent to the throw at the beginning of the delivery phase in each of the analysed events. At the end of the delivery phase, the left hip extensors generated a high force. For the javelin throw and the shot put the right knee extensors greatly contributed to the throw. Hovewer, this muscle group was not among those generating a high force for the discus throw. This could suggest that a high value seen in the right knee extensors related to the amortisation of the jump. For all the analysed athletics throws, the pair of agonist and antagonist muscle groups that generated forces simultaneously could be pinpointed. For the shot putters, this pair included the right hip flexors and extensors whereas the left hip flexors and extensors worked in the javelin and discus throws. Such work by the muscles provides joint stabilization and additionally allows the ballistic movement, thus enabling energy transfer to other segments (Bartlett, 2000). The role of stabilizing the front leg in the javelin throw was described by Bartonietz (2000). He indicated that to decelerate from the velocity acquired in the run-up, power needs to be developed in the front leg. Since in sub-phase III the left hip adductors and abductors generate high forces, it would seem that blocking the left hip is important to ensure left leg stabilization in the javelin throw. According to Bartonietz (2000), the knee joint of the front leg should be as stable as possible. Salo and Viitasalo (1995) reported that the minimum knee angle of the front leg was related to the performance level.
One way to validate the results of musculoskeletal simulation is by comparing the estimated muscle activity with electromyography. Howard et al. (2017) recorded biopotentials from the rectus femoris, biceps femoris, as well as the medial and lateral gastrocnemius muscles during the shot put. Those authors presented a map of the muscle activation in relation to what percentage of the cycle had occurred. The right leg biceps femoris and the right leg rectus femoris showed high activity (over 50% of the max. threshold from 34 to 53% of the way through the throwing cycle). That EMG study also underlined the importance of stabilizing the right leg in the shot put because simultaneous activation of the biceps femoris and the rectus femoris was observed. However, in the current study, at the beginning of the delivery phase the right knee extensors, to which the rectus femoris belongs, generated the highest forces; yet the right knee flexors were not among the muscles that generated the highest forces. Even though Howard et al. (2017) indicate that the rectus femoris of the left leg is only active during the transition stage of the shot put, these results suggest that despite its short activation time, it is crucial for a successful throw. Considering all the athletes, the left knee extensors generated the highest forces in sub-phase II. Łysoń et al. (2016) presented the muscle forces of particular muscles for the delivery phase of the shot put. It was noted that the left vastus lateralis, as well as the left rectus femoris, were responsible for generating force in the knee extensors. Additionally, Terzis et al. (2007) found a correlation between vastus lateralis muscle activation during the delivery phase and shot put performance.
In the present study, a high force was generated by right ankle plantar flexors. Another study that investigated lower limb muscles used during the shot put (Łysoń et al., 2016) indicate that the right soleus was the muscle that generated the highest force, while the contribution of the gastrocnemius muscle was relatively small. Terzis et al. (2007) presented no significant correlation between gastrocnemius muscle activity and shot put performance, yet still it is possible that such a correlation could be found for the soleus muscle in future research. Nevertheless, an interesting finding is that Howard et al. (2017) observed high activity in the left leg gastrocnemius in their research, something which was not found in the present study. Some speculation can be offered as to the reasons for this inconsistency. The mean personal best in the Howard et al.’s study was nearly half that of the athletes described in the present research. Such a difference in the throwers’ performance may influence their pattern of muscle activation. Additionally, by collecting the EMG signal, a cross-talk effect may occur and contribute to higher muscle activity in the gastrocnemius thanks to the soleus muscle that runs underneath. It is also possible that the objective function, which is responsible for solving redundancy problems in musculoskeletal simulation, favors muscles that have a higher maximum isometric force, which is lower for both the lateral and the medial gastrocnemius heads compared to the soleus.
Yu et al. (2002), based on kinematic and kinetic data, provided information concerning the technique used in the discus throw. One of their conclusions concerns the requirement for right hip extension and internal rotation as well as left knee extension. Those authors suggested that the strength of the right knee extensors, right hip internal rotators, left knee and left hip extensors was critical in the delivery phase. With regard to the muscle groups analysed in this study, the highest forces were generated by right and left hip extensors. In addition, the right hip internal rotators and right knee extensors contributed greatly to the throw. However, the left knee extensors were not included in the muscle groups. Even though the muscles that generated the highest forces were similar for all the throwers, there were differences in how much each muscle contributed to the throw in a particular event.
In the shot put, SPA1 recorded high values for muscles responsible for external rotation, left bending and flexion of the lower back. At the same time, the right hip adductors and extensor force values were much lower compared to SPA2 and SPA3. Since SPA1 attained the greatest personal best, it could be suggested that the use of the above-mentioned muscles is highly beneficial. In the javelin throw, in sub-phases II and III JA2 used back muscles that were not used by an athlete with a better personal best, so this could be interpreted as him having an inferior technique. Similarly, by comparing DA1 and DA2 in the first phase of the discus throw, it could be concluded that DA2 should use left hip external rotators and back muscles less. By comparing athletes with similar performance levels, many differences in force generation patterns were also observed. This could suggest that there are multiple techniques which may lead to throwing a good distance. Analysis of the techniques employed by the best athletes suggests that there may be no single movement pattern which should be adopted (Calvin Morriss et al., 1997). Bartlett et al. (2007) prepared a literature review concerning movement variability in sports and as a result suggested that it made no sense to try to copy specific details of a successful athlete’s technique.
In each of the events, all athletes competing in the same throw had a similar force generation pattern, but for one athlete the recorded values were lower for all of the muscles. For the shot put in sub-phase II, when SPA1 shifted his weight from the right to the left leg, almost all muscle groups generated the highest forces compared to other athletes. However, knowing that he was over 10 kg heavier than the others, it could be hypothesised that he had more muscle mass and thus was capable of generating greater forces. Similarly, in the discus throw, it can be observed that DA1 and DA3 presented similar force generation patterns in sub-phases I and II. The difference was that in sub-phase II all muscle groups generated the highest forces for DA1. From the subjects’ personal characteristics, we know that DA1’s personal best was over 25 m further, but he was also almost 50 kg heavier than DA3. From such results it could be assumed that DA3’s technique was correct, however, he did not have enough muscle mass to throw the implement further. Judge et al. (2013) reported the correlation between athletes’ personal bests and 1RM (one repetition maximum) power cleans. Zaras et al. (2013) found that six weeks of strength and power training increased athletes’ performance. This could suggest that athletes with similar force generation patterns could increase the distance of the throw via specific power training.
Trajectories of the velocities of body segments have been analyzed by researchers in the past (Bartlett, 2000). Knowing that the velocity of release correlates with the range of the throw, it could be predicted that SPA1, JA1, and DA1 should show the highest values. The velocity of the wrist joint, as the most distal segment, was highest for JA1. On the other hand, the highest velocity in the shot put was also seen in the athlete with the best result, however, this value was reached in the elbow joint. Peak velocity and the time at which peak velocity occurs in the javelin throw indicate the sequential action of particular segments. For the discus throw, the velocity increased from the arm to the wrist, but peak velocity occurred simultaneously for both the elbow and the wrist. Even though the literature (Bartlett, 2000) indicates that the sequential action of segments should be observed in skillful throwers, Liu et al. (2014) argue that for short and long performance groups the same sequence is observed. This could suggest that it is hard to differentiate between the results according to the trajectories of the velocities of body segments. Shestakov (2005) analyzed the contribution of three bio-mechanisms in the discus throw and reported that the whipping biomechanism contributed only between 25 to 40%.
When analysing athletes’ techniques, apart from trying to establish what constitutes the foundation for improved performance, injury prevention should also be considered. Since an athlete repeats a certain pattern time after time with varying loads, some slight changes in technique may lead to overloads. In the shot put the element of SPA1’s technique which made him stand out from the other shot putters was the work of his back muscles. In another article discussing the results of this research (Figure 2, Athlete 3), an observation was made that a very high energy transfer occurred for this athlete compared to the others. Yet still, using the back muscles during an intense twisting motion may lead to lower-back pain (Bartlett, 2000). It is important to note that this athlete indeed had problems with his lumbar spine. The importance of left leg stabilization in the javelin throw has already been mentioned. However, this leg is the one most susceptible to injuries (Bartlett, 2000).
One of the limitations of this study is the small number of participants. However, the aim of this study was to discuss force generation patterns for elite throwers. Other competitive throwers demonstrated much lower performance levels at the time of data collection (altogether data from 30 athletes were collected). Another limitation was the study’s environment as the laboratory conditions might have had an influence on throwing technique. It was, however, important to collect data via the force plate, which could not be installed in an outdoor throwing circle. These data were required in order to create the musculoskeletal simulations. Studies that analyze motion recorded during competitions contain numerous groups of elite athletes, yet the main limitation of such measurements is that only kinematic data can be analyzed since a force platform and EMG electrodes cannot be used. Thus new methods developed by researchers, such as GRF prediction (Skals et al., 2017), could in the future allow musculoskeletal simulations to be performed on data recorded during top-level competitions.
Conclusions
For the first time, this study presents the process of estimating muscle forces generated during athletics throws using musculoskeletal simulation. The results show that the right plantar flexor and the left hip extensor muscles contribute significantly to limb movement in all of the analyzed events. Further studies that build on the present results are needed. The findings of this study demonstrate that musculoskeletal simulation may be successfully used to predict muscle forces in sport-related movements. This method can indicate athletes’ strengths and weaknesses, which in turn would allow a coach to plan better training programs and injury prevention protocols.