Introduction
Today, competitive swimmers undergo many different laboratory- and pool-based tests aiming to evaluate their physical development. Similar testing methods are used for talent identification and, thereafter, for athletes’ progression assessment (Mitchell et al., 2018; Tanner and Gore, 2013).
The level of strength or power generated by an athlete, or the total work performed in a given test are considered, as in other sports, predictors of swimming results (Inbar et al., 1996; Stager and Coyle, 2005). In practice, tests used to register these indicators vary. They can be divided into specific tests, performed in water with the use of swimming strokes, and general tests, conducted in dry-land conditions. Some of them, despite being carried out in dry-land conditions, may be indicative of generally favourable properties of a swimmer’s body, e.g., upper or lower limb ability to produce power. In fact, the general physiological ability of upper limb anaerobic power production tested in an arm cranking test showed a significant relationship with sprint front crawl swimming (Hawley and Williams, 1991; Hawley et al., 1992; Rohrs and Stager, 1991; Strzała and Tyka, 2009). Even less swimming-specific isometric tests of upper limbs revealed their impact on swimming results along with maturity; later, however, when the athlete achieves a higher level of skills, this effect disappears (Garrido et al., 2012; Strzała et al., 2019). Similar considerations can be made for dry-land lower limb testing with the use of countermovement jumps (Amaro et al., 2017; Cronin et al., 2007; Garrido et al., 2010; Keiner et al., 2015; Strzała et al., 2019; West et al., 2011).
It is believed, though, that to better explain the level of a swimmer’s preparation, the evaluation should primarily include an assessment of their abilities in water conditions. Benefits of specific measurements in water to evaluate, monitor, and adjust training programs were noticed by Christensen and Smith (1987) who mentioned that ‘in-water testing may be a valuable tool for coaching swimmers’. Sharp and Costill (1982) suggested the use of ‘measuring and training devices during a dynamic action that most closely resembles the movement of actual swimming’.
Nevertheless, the selection of assessment indicators measured in the water is at least partly related to the activities involved in swimming competitions. Therefore, these indicators refer to race analysis (Lipinska and Hopkins, 2017; Morais et al., 2019; Strzała et al., 2015; Veiga et al., 2016), spatial and temporal movement analysis (Mooney et al., 2017; Strzała et al., 2017; Wadrzyk et al., 2021; Washino et al., 2019), or somatic and physiological traits (Barbosa et al., 2019; Kalva-Filho et al., 2017; Morais et al., 2018; Strzała et al., 2019) as directly influencing a swimmer’s ability to produce power, propulsion force, and swimming speed (Barbosa et al., 2015; Loturco et al., 2016; Olstad et al., 2017). When looking for appropriate tests of the power producing ability, resulting in propulsion force generation, one can state that tests of the upper extremities (Dominguez-Castells et al., 2013; Morouço et al., 2011, 2015; Santos dos et al., 2012) or whole body swimming are often chosen. These measurements were usually performed in tethered (Amaro et al., 2014; Costill et al., 1986; Dopsaj et al., 2000; Morouço et al., 2014) or semi-tethered swimming conditions (Dominguez-Castells et al., 2013; Vorontsov et al., 1999). In turn, propulsion force generation with the use of lower limbs was rarely evaluated (Morouço et al., 2011, 2015; Vorontsov et al., 1999), although in sprint swimming, their participation in generating propulsion is significant (Gourgoulis et al., 2014; Morris et al., 2016); it seems even more important for the whole body stabilisation during intensive arms stroking (Gatta et al., 2012; Watkins and Gordon, 1982). In addition, leg strength can have a significant impact on the speed of locomotion besides clean full stroke swimming zones during a 50-m freestyle race, where the start time, defined as time to 15 m, has been reported as a critical component of the overall swimming performance (West et al., 2011). An influence of leg strength on turn zone speed was also observed (Cronin et al., 2007).
In the context of these arguments, the purpose of the present study was to examine the impact of selected indicators, related directly to the stroke and distance swim activity of 50-m sprint front crawl swimming: (a) propulsive indicators of arm stroking only, measured during front crawl tethered swimming in a water flume; (b) lower limb propulsion generated by flutter kicks while swimming on tethers in stagnant water in a swimming pool.
Following the experimental design of swimming test conditions (see the Methods section), we aimed to focus on the following issues: (a) standing water, in which the conditions for propulsive stroking of the arms are different than during free swimming; (b) avoidance of bumping the feet with the cable suspended just above them, or a problematic lifting of the lower body in order to increase the inclination angle of the tethering cable.
Bearing in mind the different impact of indicators obtained under distinct conditions (water vs. dry-land) on swimming performance, we wanted to investigate whether the dry-land indicators chosen for the study observation would constitute a good complement to the assessment of 50-m front crawl performance. Two holistic anaerobic work tests were selected: (a) use of upper extremities in arm cranking; and (b) a series of countermovement jumps.
We assumed that the results of the chosen specific water tests would be good predictors of sprint front crawl swimming performance. In addition, dry-land tests should well complement the assessment of the swimmers’ anaerobic and strength conditioning.
In order for the selected indicators to be considered more predictive, we assessed the development of sports talent rather than performed maturational development analyses with the age factor controlled for (Dormehl et al., 2016; Mitchell et al., 2018; Strzała et al., 2019).
Methods
Participants
Overall, 27 male swimmers were recruited from a sport swimming-oriented high school and two university swimming clubs. The basic demographic characteristics of the participants were as follows: age: 19.3 ± 2.67 years, body height: 184.0 ± 6.82 cm, body mass: 78.5 ± 12.06 kg. All participants had licenses from the Polish Swimming Federation and were healthy, as required by the inclusion criteria. The selected group competed at a regional (4 swimmers), national (19), or international level (4). Their personal best results in the 50-m freestyle short course amounted to 77.9%, 83.9%, and 90.8% of senior swimmers’ world record, respectively.
Participants trained twice a day, 6 days a week. Any injury that could affect the results of the study was considered an exclusion criterion. All swimmers (or their parents) signed informed consent to take part in the research. The study was approved by the University Bioethics Committee at the Jerzy Kukuczka Academy of Physical Education in Katowice (no. 8/2018).
Tethered Swimming
The upper extremity test, 20-s all-out front crawl stroking, was performed on a tether in a water flume. To ensure adequate buoyancy of the lower limbs, the swimmer was equipped with two buoys, placed between the thighs and ankles. Additionally, to prevent the buoy from falling out, the swimmer’s ankles were wrapped with adhesive tape. The swimmer was connected to a steel pole with a 5.65-m steel cable (with a waist belt) and a dynamometer (recording at 100 Hz) (Figure 1). The point of fixing the dynamometer to the pole was 0.49 m above the water surface. The flow velocity of water in the swimming flume was set to 0.9 m·s–1. The average stroke rate was calculated on the basis of stroke cycles recorded during the 20-s period by a camcorder (JVC GC-PX100BE, Japan), working at the sampling rate of 100 fps. The observed number of cycles during the 20 s was converted to cycles·min–1. For each participant, three main indices were calculated during the 20-s period: (a) maximum value of arm force – Fa max (N); (b) average value of arm force – Fa ave (N); and (c) average arm impulse per cycle – Ia (N·s) (calculated as the integral of force over a period of time containing all full cycles which appeared during the 20-s recording, divided by the number of these cycles n):
where: t0 – beginning of the first full cycle, t1 – ending of the last full cycle in the 20-s period.
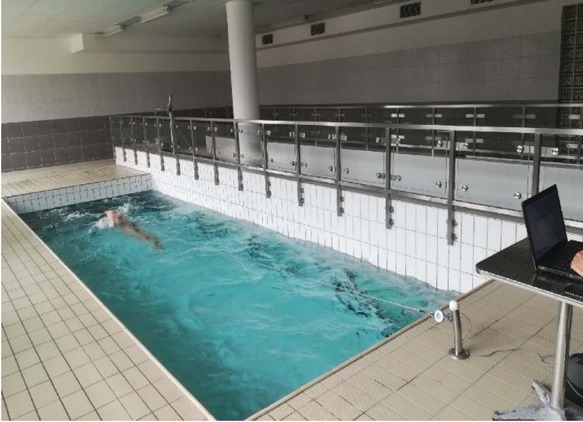
In the lower extremity test, towing force was measured during tethered flutter kicking (front crawl) in a pool over 20 s. The test was carried out with the support of a kickboard (Figure 2). The steel cable which the swimmer was attached to during the test formed two equal 3-m arms of a triangle. The cable end was attached to the start block, then passed through a grommet in the swimmer’s belt, and was attached to another starting block via a force transmitter. The distance between the fastening points on the starting blocks was 2.2 m.
Figure 2
Measurement of force during a 20-s all-out tethered flutter kicking test (FT – force transmitter).
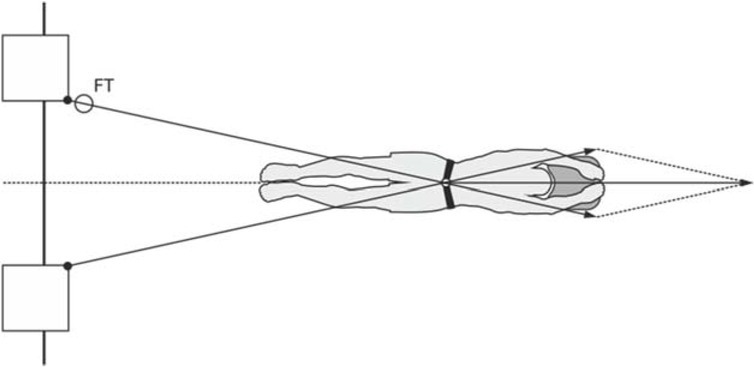
Swimmers were asked to swim towards the point visible in front of them, located in the axis of symmetry of the system. The geometry of the measuring system was the same for all swimmers, thus the proportion of force registered by the force transducer Fmes and the propulsion force generated by participants was also the same, in accordance with the formula:
In this test, two main indices were calculated during the 20-s period: (a) maximum value of leg force – Fl max (N); (b) average value of leg force – Fl ave (N).
Dry-Land Maximal Anaerobic Power
A 20-s upper extremity test, arm-cranking, was performed in a sitting position, with the use of a custom designed ergometer (834E-Ergomedic, Monark, Sweden). The ergometer braking force was set for each individual at 4.5% of body mass. Average work of arms: Wcra (J), as well as maximal power generated by arms: Pcra max (W) were measured during this test. Also, the values of these indices in relation to body mass were calculated and analysed: Wcra rel (J·kg–1) and Pcra rel max (W·kg–1). Prior to the test, swimmers underwent a 4-min warm-up, which consisted of continuous arm cranking (cadence: 90·min–1) at a minimal workload. In half of this time and close to the end of the 4 min, short sprints lasting 5 s were performed against heavier resistance that still allowed the participants to crank at the cadence of 90–100·min–1 (Inbar et al., 1996).
The lower extremity test consisted of a set of 10 countermovement jumps performed on a force plate (AMTI BP 400600, USA) rigidly fixed to the laboratory floor. The frequency of jumps was imposed using a metronome – one jump every 2 s. At the beginning of the test, the athlete stood upright on the force plate with their weight evenly distributed between both feet. Hands were placed on the hips throughout the whole test to eliminate their contribution to energy generation. Work generated in a single jump – WCMJ (J), averaged over the 10 jumps, was taken as an absolute indicator of anaerobic muscle system motor capabilities. Average elevation of the centre of mass – h (cm) – in the 10 jumps was considered an indicator of motor abilities relative to body mass. The test was performed after a 5-min dynamic warm-up, which included dynamic stretching, progressive intensity shuttle runs, and bodyweight squats (Mitchell et al., 2018).
Sprint Swimming Race
The all-out swimming 50-m front crawl race was conducted in a 25-m swimming pool which met the International Swimming Federation standards. Time measurement was performed using an automatic timing device (Omega, Switzerland). In this race, swimmers competed in pairs. Pairs were selected in accordance with similar personal best results. Participants were asked to perform in-the-water starts, which made it easier to shorten the underwater swimming phase after the start to 8 m.
The surface stroke rate – SRsurface (cycles·min–1) – was determined by 2 camcorders (JVC GC-PX100BE, Japan) working at the sampling rate of 100 fps. One camcorder for each swimmer recorded their movements from the side view. The SRsurface was taken as an average from 6 stroke cycles (3 consecutive cycles of the middle section of the first and second laps). The camcorders were placed close to the middle point (12.5 m) of the pool length and attached to tripods with a rotating head.
The stroke length (SL) calculation was based on the data gathered in 9-m sectors of the distance of 50 m, during both laps (between the 8th and 17th m for the first lap, and between the 33rd and 42nd m for the second lap). For the purpose of this measurement, two more JVC GC-PX100BE camcorders (sampling rate: 100 fps) were used. The camcorders were located on tripods standing on the pool deck. Recordings from these two cameras were synchronised with a flash light triggered by the Omega electronic starting device. The JVC camcorders filmed each swimmer’s head when it crossed the 8-, 17-, 33-, and 42-m lines of the distance.
The recordings allowed to calculate the average time needed to complete the 9-m sectors (Δt) and thus to establish the average 18-m surface swimming speed (Vsurface). SL was calculated as a quotient of the average speed for the 18-m and stroke rate (SRsurface) : SL = V/SRsurface (m). The sum of the duration of swimming in the 8-m zones of start, turn, and finish was used to determine the 32-m average swimming speed (VSTF). Then, the time achieved by swimmers in the entire 50-m race was taken to calculate the swimming speed (Vtotal50).
All participants underwent familiarisation with the tethered swimming during a warm-up session before both tethered tests. Validation of the novel tethered swimming procedures was conducted; the intra-class correlation coefficient (2,1) value equalled 0.997 (95% confidence interval: 0.988–0.999) for the upper extremity test and 0.997 (95% confidence interval: 0.988–0.999) for the lower extremity test. Relative reliability was investigated using intra-class correlation coefficients (model 2,1) with a 95% confidence interval. All recorded data were constantly displayed on a laptop screen and stored on a hard disk. The data were processed by signal processing software (Max 6.0; JBA, Poland) and filtered through a 4.5-Hz low-pass filter. The 50-m free front crawl race and tethered front crawl tests were preceded by a warm-up selected by each athlete, similar to the one carried out before a competition, including at least 1000-m swimming with front crawl and other techniques.
Statistical Analyses
The normality, homoscedasticity, and independency of the data assumptions were examined with the Kolmogorov-Smirnov, Levene, and Durbin-Watson tests, respectively. One-way repeated measures analysis of variance (ANOVA) and Tukey honestly significant difference (HSD) post-hoc tests were used to describe the comparison of average speeds (Vtotal50, Vsurface, VSTF). To exclude individual swimmers’ features of maturity, partial correlations (controlled for age) between particular speeds (Vtotal50, Vsurface, VSTF) and all indices were calculated.
To compare stroke rate data (SR of 50-m free front crawl swimming and SR of tethered swimming), the Student’s t-test was applied for normally distributed data and equal variances. To further evaluate mean differences, Cohen’s effect size (d) was calculated to express differences relative to the pooled standard deviation. The magnitude of differences between groups was expressed as standardised mean differences (Cohen’s d, effect sizes). The criteria to interpret the effect size magnitude were as follows: trivial (0.00–0.19), small (0.20–0.59), moderate (0.60–1.20), and large (>1.20) (Hopkins, 2002). Additionally, the Pearson linear relationship was computed between the speeds (Vtotal50, Vsurface, VSTF) of the 50-m race and between maximal and average force results of tethered swimming.
Statistical significance was set as p ≤ 0.05. All tests were performed with the Statistica ver. 12 software (StatSoft, Inc.).
Results
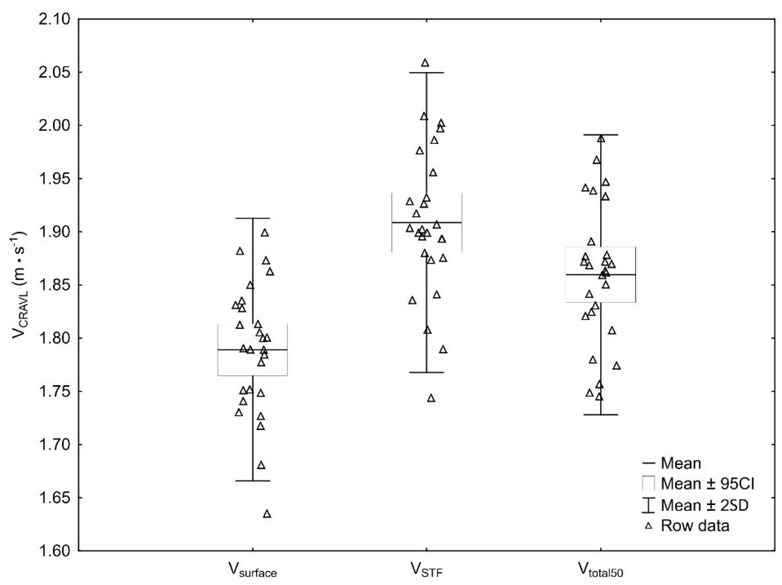
The all-out 50-m sprint performance results are presented as average speeds for the whole distance – Vtotal50 (1.86 ± 0.07 m · s–1), surface front crawl swimming zones – Vsurface (1.79 ± 0.06 m·s–1), and the remaining zones of the race (start, turn, and finish zones) – VSTF (1.91 ± 0.07 m·s–1). The calculated repeated measures ANOVA for these speeds showed a significant difference between them: F (2,52) = 124.34; p < 0.001. Moreover, the Tukey HSD test revealed significant differences (p < 0.001) across the compared averages (Vtotal50, Vsurface, VSTF) (Figure 3). Both Vsurface and VSTF presented a strong relationship with Vtotal50, as indicated by the Pearson correlation coefficient: r = 0.90, p < 0.001 and r = 0.91, p < 0.001, respectively.
In the group of functional indices nonspecific for swimming, measured during a set of countermovement jumps, only the average value of absolute work in the 10 jumps – WCMJ (J) – was significantly correlated with VSTF (Table 1). The relationships of this index with other speeds revealed significance for Vtotal50 and lack of significance for Vsurface (Table 1). The h (cm), relative to the body mass index, did not correlate with the speed values obtained in the swimming test.
Table 1
Functional indices of the 10 countermovement jump test and their partial correlations (with age control) with Vsurface, Vtotal50, and VSTF
| Partial correlations | h (cm) 37.8 ± 3.64 | WCMJ (J) 282.1 ± 48.92 |
|---|---|---|
| Vsurface | 0.08 | 0.28 |
| VSTF | 0.03 | 0.40* |
| Vtotal50 | 0.06 | 0.37 (p = 0.06) |
The non-specific work and power indices obtained in the anaerobic arm cranking test presented slightly greater dependence with each distinguished speed than the functional leg indices. The same refers to absolute work – Wcra (J) – and maximal power – Pcra max (W). When these indices were expressed per kilogram of body mass, the partial correlation with speeds turned out low or negative and non-significant (Table 2).
Table 2
Work and power indices of the 20-s arm cranking testand their partial correlation (with age control) with Vsurface, Vtotal50, and VSTF
The maximal force generated by the arms during flume tethered swimming (Fa max) significantly influenced Vsurface and Vtotal50. Its relationship with VSTF was on the edge of significance. Similarly, only a moderate relationship was found between Fa ave and Vsurface (Table 3). The strongest predictor of sprint swimming aptitude in the study was force (Fl max and Fl ave) generated by legs in tethered swimming, which correlated strongly with Vtotal50 and VSTF, and moderately with Vsurface (Table 3).
Table 3
Indices of tethered swimming with arm stroking only: maximal force (Fa max), average force (Fa ave), average impulse (Ia); and with leg kicking only: maximal force (Fl max) and average force (Fl ave). Partial correlations with age control between forces obtained for tethered swimming and Vsurface, Vtotal50, and VSTF
The value of the stroke rate kinematic index was also calculated for flume tethered arm stroking: SRflume = 57.02 ± 6.62. This result was significantly higher (paired t-test: t(26) = 2.13, p = 0.04) in comparison with SRsurface of the surface swimming zone: 54.8 ± 5.93 (Figure 4). The magnitude of these SR indices difference was additionally checked using Cohen’s effect size, and a small effect was noted (d = 0.425). The kinematic SL index did not correlate with Vsurface (1.98 ± 0.21), while SRsurface correlated significantly with Vsurface (r = 0.50, p = 0.02).
The correlation between Fa max and Fa ave was 0.61 (p < 0.01). It should be emphasised that the dependence between Fl max and Fl ave turned out very high: 0.80 (p < 0.001).
Discussion
In the present study, the strongest predictor of the sprint swimming aptitude was force (Fl max and Fl ave) generated by legs in tethered swimming. Logically, this relationship was strongest when the body was moving partly under the surface of the water, with greater participation of the legs, i.e., in the STF zones. The influence of both Fl max and Fl ave indices on Vtotal50 was still high and significant, although the relationship between them and Vsurface decreased to a moderate one. Swimming on a tether with the use of the flutter kick is rarely implemented in in-water strength testing in swimmers. This is because of the defects which may occur during testing, e.g., bumping the feet with the cable suspended just above them or problematic lifting of the lower body owing to the need to increase the tethering cable inclination angle. In our measurements, we avoided these problems using the triangular geometry of the cable lead, which was an innovative solution for the tethered test stand. Another advantage was that the swimmer adopted the body position routinely applied in training with continuous contact with the subject through the emerging head. Furthermore, in our opinion, the very high relationship between Fl max and Fl ave (0.80, p < 0.001) in this test increases its potential to be used to assess sprint swimming abilities. This results from the fact that the performance time of 20 s requires not only instantaneous strength, but also the ability to maintain high average propulsion generation (Stager and Coyle, 2005). The average and maximum force values obtained in this work turned out to be slightly higher than those observed by Morouço et al. (2015), i.e., 35.1 N and 100.1 N, respectively, or than the average force of 33.6 N measured in another study by Morouço et al. (2011). These differences are most likely related to the higher average age of the athletes in the present study and shorter duration of the test. In a study conducted by Vorontsov et al. (1999), during a kicking tethered test, subjects were instructed to exert maximal effort for 5–7 s. The force generated by legs among 18-year-olds in that measurement was 118.6 N and turned out slightly lower than the one registered in the present study in the strongest single kicks.
A lower level of dependence with Vsurface (close to significance) was obtained by analysing the impact of the propulsion by the arms (Fa ave) measured in the swimming test in the water flume. Despite the higher dependence of Fa max on Vsurface and Vtotal50, we can state that this measurement of strength, limited by the lack of support for the legs, does not provide a full opportunity to explore specific sprinting abilities. The interpretation of the need for higher influence of Fa ave on Vsurface may be reinforced by the reported high dependence of the SRsurface index on Vsurface (r = 0.50, p = 0.02), i.e., the ability to perform even cyclic motions. Perhaps an additional difficulty in the sufficient generation of body propulsion by the upper limbs was caused by attaching tethers to the waist, flowing water and lack of the flutter kick support. These conditions probably led to a significant increase in SRflume (57.02 cycles·min–1) compared with SRsurface (54.8 cycles·min–1), and propulsion phases of both arms overlapping to a greater extent compared with whole body tether swimming, observed in other studies (Dominguez-Castells et al., 2013; Strzała et al., 2019). Less favourable conditions for generating propulsion force, occurring when swimming using only the arms, have already been found by other researchers as a result of an unstable trunk position (Watkins and Gordon, 1982), unfavourable changes in the wrist trajectory (Deschodt et al., 1999), reduction in the propulsive forces of the upper limbs (Morouço et al., 2015), and lesser swimming economy (Morris et al., 2016). It has already been suggested that a kick while front crawl swimming is a body stabiliser. The action of legs neutralises the reaction of the rest of the body to the arm action; as a result, it keeps the position of the trunk quite stable, which results in a more effective arm action (Lawrence, 1969; Prins and Murata, 2008).
We mentioned in the introduction that our tests of the force generated by the arms only in tethered conditions might be similar to those previously carried out (Dominguez-Castells et al., 2013; Morouço et al., 2011, 2015; Santos dos et al., 2012; Strzała et al., 2019; Vorontsov et al., 1999). However, these results could not be compared owing to different test conditions as we focused on stroking arms only in flowing water.
Nevertheless, this study noted a significant relationship between the indices of the anaerobic arm cranking test and swimming results, less expected than that of specific indices. This refers to the relationship of Wcra with Vtotal50 and VSTF, and Pcra max with Vtotal50 and VSTF. However, these results coincide with those obtained by other researches (Hawley and Williams, 1991; Hawley et al., 1992; Rohrs and Stager, 1991; Strzała and Tyka, 2009). Probably, as we assumed, in order to assess athletes’ progress in their holistic anaerobic properties, tests showing a physiological ability to generate power can be selected.
Functional indices measured during the set of countermovement jumps showed that the average absolute value of work obtained in the 10 jumps – WCMJ (J) – was significantly correlated with VSTF and its correlation with Vtotal50 was close to significant. Therefore, this test can be considered as a sufficient complement to the assessment of the general abilities in relation to the involvement of lower limbs during sprinting, especially in the zones of their increased propulsion. These observations corroborate previous reports (Cronin et al., 2007; Mitchell et al., 2018; Strzała and Tyka, 2009).
The aim of this study was to examine whether newly prepared specific water and dryland tests effectively distinguished between high and low performers in a group of swimmers of different ages. The measurements carried out indicate that the test of specific abilities of the lower limbs during the execution of the flutter kick propulsion movement was the best predictor of the aptitude to sprint front crawl swimming. Our research on sprint front crawl stroking of the arms refers to previous observations (Deschodt et al., 1999; Dominguez-Castells et al., 2013; Strzała et al., 2020; Watkins and Gordon, 1982) which indicate that the separation of arm movements during feet immobilisation, with the lack of support for leg muscles and torso, may not be sufficient to reveal their full effectiveness.
Bearing in mind the present results and a scarce number of similar studies, one can state that to identify talents, cyclically monitor progress of swimming skills and improve them, the specific swimming skills test performed with the lower limbs can be used in the manner proposed in this study. Performing the flutter-kick test, partly redesigned, allowed an uncomplicated and reliable measurement of force, which facilitated a full focus on the task, i.e., generating force, without limiting the range of leg movement. This test should be applied alongside whole body tether swimming.
Selected dry-land tests, the arm cranking test and a set of 10 countermovement jumps, can be a good complement to the overall fitness assessment of upper and lower limbs in conditioning for sprint front crawl swimming.