Introduction
During the last few years post-activation potentiation (PAP) has been used to acutely improve power output and muscular function (Maloney et al., 2014). PAP is commonly used during the warm-up through complex training, which refers to a training method where heavy resistance exercises are used prior to a biomechanically similar ballistic movement (Poulos et al., 2018).
PAP acts through skeletal muscle contractile history, where the muscle is preactivated with a higher load using a conditioning activity before performing a training session or a competition. Two mechanisms have been suggested: (i) the phosphorylation of myosin regulatory light chains and (ii) improved -motoneuron excitability (Gołas et al., 2016). Additionally, according to the vector theory (Morin et al., 2010), biomechanical similarities between the conditioning and the effective activity (the competition, training bout or test) play a crucial role in potentiation. Four main variables are thought to act over the conditioning activity: (i) intensity to activate the working mechanisms (Gołas et al., 2016), (ii) volume, which is inversely proportional to intensity, (iii) resting time, which is directly conditioned by intensity and volume (Kilduff et al., 2008), and (iv) movement similarity (Dello Iacono et al., 2018).
To date, very different protocols have been used trying to achieve optimal potentiation with opposing results (Dello Iacono et al., 2018; Gołas et al., 2017; Kobal et al., 2019). Thus, the aim of this review was to compare different protocols and to clarify the importance of the aforementioned variables on the conditioning activity. We hypothesized that the volume load would be the main conditioning factor to achieve an optimal potentiation, followed by intensity.
Methods
Experimental Approach to the Problem
A literature search was conducted on October 23, 2020. The following databases were searched: PubMed and Scopus. The previously named databases were searched from inception to October 2020, with language limitations: only peer reviewed articles in English were selected. Citations from scientific conferences were excluded.
Literature Search
In the database, the title and abstracts were searched. The following MeSH terms and key words, combined with the Boolean operators (AND, OR), were used: “athletic performance”, “resistance training”, “post activation potentiation”, “PPA”, “PAP”, “post-activation potentiation”, “potentiation post activation”, “potentiation post-activation”, “performance”, “strength performance”, “strength training”, “strength” and “powerlifting”. No additional filters or search limitations were used.
Inclusion Criteria
Studies were eligible for further analysis if the following inclusion criteria were met; a) subjects´ age ranged between 18-30 years; b) studies analysed experienced lifters; c) postactivation potentiation was studied in sports with high requirements of the rate of force development; d) the potentiation protocol was conducted with barbell exercises; e) pre- and postevaluation was done with a resistance exercise, vertical jump or similar (i.e. squat jump, counter movement jump or drop jump). In the studies where volume was not directly reported, it was calculated as follows: volume = sets x repetitions x kilograms.
Quality assessment
Oxford’s level of evidence (OCEBM Levels of Evidence Working Group, 2011) and the Physiotherapy Evidence Database (PEDro) scale (Maher et al., 2003; de Morton, 2009) were used in order to assess the methodological quality of the studies included in the review. Oxford’s level of evidence ranges from 1a to 5, with 1a being systematic reviews of high-quality randomized controlled trials (RCT) and 5 being expert opinions. The PEDro scale consists of 11 different items related to the scientific rigor. Given that assessors are rarely blinded and that blinding participants is almost impossible, items 5-7 (which are specific to blinding) were removed from the scale (Baz-Valle et al., 2018). With the removal of these items, the maximum result on the modified PEDro scale was 7 (the first item is not included in the final score) and the lowest, 0. Zero points are awarded to a study that fails to satisfy any of the included items and 7 points to a study that satisfies all the included items.
Results
Studies Selected
The search strategy yielded 202 total citations as presented in Figure 1. From those 202 articles, 17 met the inclusion criteria. Excluded studies had at least one of the following characteristics: the potentiation protocol included strategies different from resistance training (e.g. electrostimulation or vibration), participants were not experienced lifters (had less than 2 years of resistance training experience or less than 2 x bodyweight squat 1-RM) or the evaluation protocol was done with sprinting bouts (Table 1).
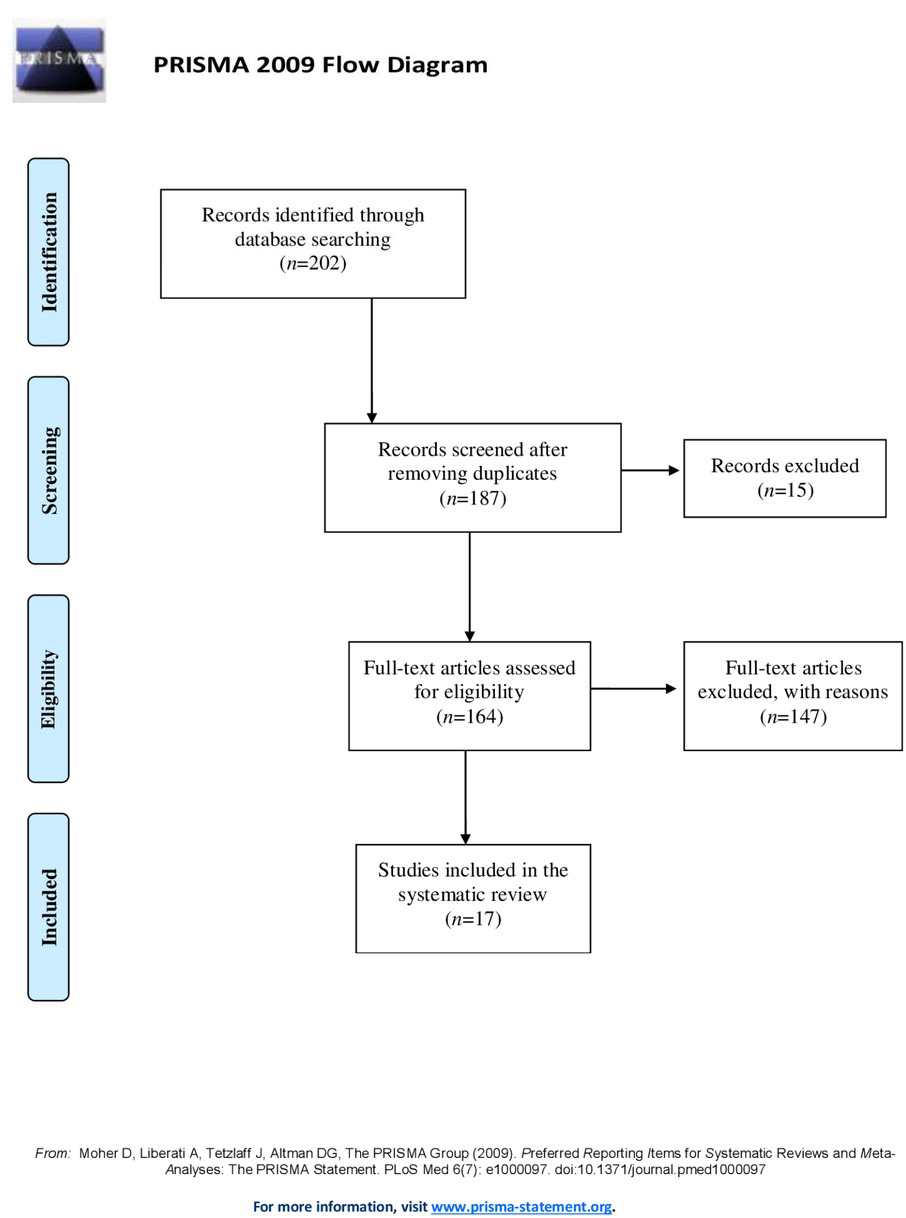
Table 1
Physiotherapy Evidence Database (PEDro) ratings and Oxford evidence levels of the included studies.
| Study | 1 | 2 | 3 | 4 | 5 | 6 | 7 | 8 | Total | Evidence level |
|---|---|---|---|---|---|---|---|---|---|---|
| Andrews et al. (2016) | Yes | 1 | 1 | 1 | 1 | 1 | 1 | 1 | 7 | 1b |
| Comyns et al. (2007) | Yes | 1 | 1 | 1 | 1 | 1 | 1 | 1 | 7 | 1b |
| Dello Iacono et al. (2019) | Yes | 1 | 1 | 1 | 1 | 1 | 1 | 1 | 7 | 1b |
| Do Carmo et al. (2018) | Yes | 1 | 1 | 1 | 1 | 1 | 1 | 1 | 7 | 2b |
| Gilbert & Lees (2007) | Yes | 1 | 1 | 1 | 1 | 1 | 1 | 1 | 7 | 1b |
| Golas et al. (2017) | Yes | 1 | 1 | 1 | 1 | 1 | 1 | 1 | 5 | 2b |
| Kilduff et al. (2008) | Yes | 0 | 0 | 1 | 1 | 1 | 1 | 1 | 5 | 2b |
| Kobal et al. (2019) | Yes | 0 | 0 | 1 | 1 | 1 | 1 | 1 | 5 | 2b |
| Krzysztofik et al. (2020a) | Yes | 1 | 1 | 1 | 1 | 1 | 1 | 1 | 7 | 1b |
| Krzysztofik et al. (2020b) | Yes | 1 | 1 | 1 | 1 | 1 | 1 | 1 | 7 | 1b |
| Krzysztofik et al. (2020c) | Yes | 1 | 1 | 1 | 1 | 1 | 1 | 1 | 7 | 1b |
| Krzysztofik and Wilk (2020) | Yes | 1 | 1 | 1 | 1 | 1 | 1 | 1 | 7 | 1b |
| Lowery et al. (2012) | Yes | 1 | 1 | 1 | 1 | 1 | 1 | 1 | 7 | 2b |
| Mina et al. (2019) | Yes | 1 | 1 | 1 | 0 | 1 | 1 | 1 | 6 | 1b |
| Poulos et al. (2018) | Yes | 1 | 1 | 1 | 1 | 1 | 1 | 1 | 7 | 1b |
| Reardon et al. (2014) | Yes | 1 | 1 | 1 | 1 | 1 | 1 | 1 | 7 | 2b |
| Thomas et al. (2015) | Yes | 1 | 0 | 0 | 1 | 1 | 1 | 1 | 5 | 2b |
[i] Items in the PEDro scale: 1 = eligibility criteria were specified; 2 = subjects were randomly allocated to groups; 3 = allocation was concealed; 4 = the groups were similar at baseline regarding the most important prognostic indicators; 5 = measures of 1 key outcome were obtained from 85% of subjects initially allocated to groups; 6 = all subjects for whom outcome measures were available received the treatment or control condition as allocated or, where this was not the case, data for at least 1 key outcome were analysed by “intention to treat”; 7 = the results of between-group statistical comparisons are reported for at least 1 key outcome; 8= the study provides both point measures and measures of variability for at least 1 key outcome
Level of Evidence and Quality of the Studies
Ten of the seventeen included studies had a level of evidence 1b (good quality randomized control trials). The 7 remaining studies had a level of evidence of 2b (individual cohort studies). Also, the mean score in the PEDro scale was 6.47 ± 0.87, with values ranging from 5 to 7 (Table 1).
Characteristics of the Participants
Participants were characterized as experienced or well-trained athletes due to their training experience or their one repetition maximum (the maximum amount of weight that a person is able to lift for one repetition). A summary of participants´ characteristics is presented in Table 2. The total number of participants was 279 (253 men, 6 women and 20 unknown).
Table 2
Included studies
| Study | Number (M/F) | Age (years) | RT experience (years) | Main Outcome |
|---|---|---|---|---|
| Andrews et al. (2016) | 14 (8/6) | M 21.3 21.2 ± ± 1.8 0.4 / F | ≥ 2 | Unilateral PAP and fatigue |
| Comyns et al. (2007) | 12 (12/0) | 23.3 ± 2.5 | 1RM ≥ 2x bodyweight | Optimal resistive load and PAP |
| Dello Iacono (2019) et al. | 26 (26/0) | 23.2 ± 5.1 | ≥ 2 | Traditional sets sets PAP PAP vs cluster |
| Do Carmo et al. (2018) | 12 (12/0) | 25.4 ± 3.6 | ≥ 3 | PAP rest interval |
| Gilbert and Lees (2007) | 15 (15/0) | 24.3 ±3.3 | unknown | Changes in force development |
| Golas et al. (2017) | 16 (16/0) | 18-35 | ≥ 5 | Used PAP load magnitude |
| Kilduff et al. (2008) | 20 (Unknown) | 25.4 ± 4.8 | 3.1 ± 1.6 | Recovery time and PAP |
| Kobal et al. (2019) | 18 (18/0) | 25.42 ± 3.58 | 3 | Different volume and PAP |
| Krzysztofik et al. (2020a) | 12 (12/0) | 25.2 ± 2.1 | 3 | PAPE and training volume |
| Krzysztofik et al. (2020b) | 32 (32/0) | 28.4 ± 4.5 | 3 | Eccentric and concentric PAP |
| Krzysztofik et al. (2020c) | 13 (13/0) | 25.7 ±1.9 | 6.5 ± 2.2 | Eccentric PAP |
| Krzysztofik and Wilk (2020) | 24 (24/0) | 24.5 ± 2.6 | 6.3 ± 2.5 | Plyometric PAP protocol |
| Lowery et al. (2012) | 13 (13/0) | 21 ± 3 | 3 | PAP stimuli and recovery time |
| Mina et al. (2019) | 15 (15/0) | 21.7 ± 1.1 | ≥ 5 | PAP: free resistance weight vs variable |
| Poulos et al. (2018) | 15 (15/0) | 24.3 ± 2.6 | ≥ 2 | Back Squat intensity and PAP |
| Reardon (2014) | 11 (11/0) | 25.18 ± 3.60 | 1RM ≥ 2x bodyweight | Muscle architecture and PAP |
| Thomas et al. (2015) | 11 (11/0) | 23 ± 4 | ≥ 2 | PAP and neuromuscular function |
Studies matching volume load
Five of the included 17 studies matched the volume load in the protocols used. From these five studies, three compared different intensity protocols (Dello Iacono et al., 2019; Lowery et al., 2012; Mina et al., 2019) and two the optimal rest interval (do Carmo et al., 2018; Kilduff et al., 2008).
Mina et al. (2019) performed a study comparing free weight back squats and variable resistance back squats (elastic bands were used to generate the 35% of the total load at the upper part of the squat). Under the free weight condition, no significant changes were found in jump height, peak power or a normalized (to body weight) rate of force development (RFD) compared to pre-intervention performance. On the other hand, under the variable resistance condition, statistically significant increases (p < 0.05) in CMJ height were observed at 30 s (5.9 ± 1.2%), 4 min (5.6 ± 1.8%), 8 min (6.5 ± 2.6%) and 12 min (5.3 ± 2.5%) compared to pre-intervention. In addition, statistically significant increases (p < 0.05) were evident in peak power at 30 s (4.7 ± 1.2%), 4 min (5.9 ± 1.3%), 8 min (4.4 ± 1.7%) and 12 min (4.8 ± 1.7%) time points. These changes in CMJ height and peak power were also significantly different from the free weight condition group (p < 0.05).
Dello Iacono et al. (2019) compared the effect of two protocols using the individualized optimal power load with traditional and clusterset configuration in a randomized cross-over design. Although both protocols increased jump height 4 and 8 min post-intervention, the cluster set configuration reached significantly better results by 1.33 cm (95% CI, 1.02 to 1.65 cm) and 1.64 cm (95% CI, 1.41 to 1.88 cm), respectively. Additionally, cluster set configuration was able to maintain 10% higher power output (95% CI, 8 to 12%) relative to their relative mean propulsive power.
Lowery et al. (2012) studied the effects of three different loads (light, 56% 1RM; medium, 70% 1RM; and heavy, 93% 1RM) on vertical jump height. Vertical jumps after the light load protocol did not reach statistically significant differences. Moderate and high load protocols decreased vertical jump performance right after the conditioning activity (p < 0.05; ESmedium loaded = -2.45, large; ESheavy loaded = -2.87, large). Additionally, a medium loaded protocol reached a significant performance increase at 4 min in the post activation training protocol (p < 0.05; ES = 1.46, large) and a high loaded protocol reached statistically significant improvements at both 4 and 8 min post protocol (p < 0.05; ES4min = 1.34, large; ES8min = 1.48, large).
Kilduff et al. (2008) attempted to set the optimal recovery time for a complex training session. Participants performed 3 sets of 3 repetitions at 87% 1RM back squats before an explosive activity. They reported a statistically significant (p < 0.05) decrease at 15 s post conditioning activity and a statistically significant (p < 0.05) increase at 8 min post conditioning activity for power output and for jump height. A statistically significant (p < 0.05) increase in the RFD 8 min post conditioning activity was also reported. Additionally, Do Carmo et al. (2018) suggested that self-selected rest intervals were better than a fixed rest interval in order to dissipate the fatigue created by the conditioning activity. They conducted a study and no significant changes were observed after the conditioning activity in the fixed rest interval group (38.0 ± 5 cm vs. 37.7 ± 5.1 cm; p = 0.4; ES = 0.04) nor in the self-selected rest interval group from pre- to post-test (38.2 ± 4.6 cm vs. 40.5 ± 4.4 cm).
Studies not matching volume load
The remaining twelve of the included 17 studies did not match the volume load in the protocols used. Four of these studies (Comyns et al., 2007; Gilbert and Lees, 2005; Krzysztofik et al., 2020b, 2020c) support the relationship between a higher volume load and potentiation stimuli. Of the remaining 8 studies, one analysed the neuromuscular function (Thomas et al., 2017), compared PAP in exercised and contralateral legs (Andrews et al., 2016), compared the relationship between PAP and time under tension (Krzysztofik et al., 2020a) and another studied the effects of plyometric PAP in bench press throw (Krzysztofik and Wilk, 2020). The remaining 4 reported contradictory results (Golas et al., 2017; Kobal et al., 2019; Poulos et al., 2018; Reardon et al., 2014).
Four studies (Comyns et al., 2007; Gilbert and Lees, 2005; Krzysztofik et al., 2020b, 2020c) support the notion of higher volume loads as better potentiation stimuli. These three studies compared different intensities and volumes ranging from 65% 1 RM to 130% 1 RM. Gilbert and Lees (2005) found statistically significant increases in the isometric RFD in the 1RM group at 15 min (p = 0.021) and 20 min (p = 0.006), with a peak increase of 11.8%. In the optimal power load group, a statistically significant increase (p = 0.038) in the isometric RFD was found at 2 min, with a peak increase of 6.7%. Comyns et al. (2007) found that contact time showed a statistically significant reduction (p < 0.05) and vertical leg spring stiffness indicated a significant increase (p < 0.05) for the heavy loaded protocol (93% 1RM). However, there were significantly (p < 0.01) shorter flight times for all the protocols. Krzysztofik et al. (2020b) compared the differences between a classic PAP protocol (2 sets of 2 repetitions of the concentric bench press at 90% 1-RM) and eccentric protocols (2 sets of 2 repetitions of either only eccentric 90% 1-RM, only eccentric 110% 1-RM or only eccentric 130% 1-RM bench press). The study reported better potentiation results with eccentric only protocols, achieving greater peak velocity (η2 = 0.441; p = 0.019) and greater mean velocity (η2 = 0.011; p = 0.041) after the 110% 1-RM eccentric only protocol and greater peak velocity after the 130% 1-RM eccentric only protocol (η2 = 0.323; p = 0.037). In another study by Krzysztofik et al. (2020c) with the same eccentric protocols, the bench press throw with a load of 30% 1-RM improved peak power by 10.5 ± 6.0% ( effect size = 0.34) and by 9.9 ± 8.1% (effect size = 0.33) for the 110 and 130% 1-RM conditions, respectively. Peak velocity increased by 5.9 ± 5.5% (effect size = 0.4) and by 6.1 ± 6.1% (effect size 0.43) for the 100 and 130% 1-RM protocols, respectively. Since sets and repetitions remained the same through protocols, the differences in volume load were a result of the different intensities.
Four studies (Golas et al., 2017; Kobal et al., 2019; Poulos et al., 2018; Reardon et al., 2014) showed conflicting results. In the study by Poulos et al. (2018) both protocols (10 sets of 3 or 5 repetitions with 87% 1RM vs. 65% 1RM respectively) enhanced jump height (65% 1RM: +3.3 ± 2.2% [CI: 1.0 to 5.6]; 87% 1RM +2.6% ± 1.9% [CI: 0.7 to 4.5]) after 10 sets. Nevertheless, there was a larger chance of jump height improvement when CMJs were performed across the 10 sets of squats in the protocol of 87% 1RM. Golas et al. (2017) compared five different protocols and they observed statistically significant (p = 0.01) differences in the RFD and the rate of power development (RPD) (p = 0.02) in the medium volume load group (80% 1RM) compared to the other conditions. Additionally, Kobal et al. (2019) found that a lower volume load with a higher intensity (100% 1RM) protocol induced similar results to a higher volume load and lighter load protocol (93% 1RM and 87% 1RM). Reardon et al. (2014) found no performance improvement in any of their protocols (3 sets of either 10 or 3 repetitions with 75% 1RM vs. 90% 1RM).
Thomas et al. (2017) analysed neuromuscular function using EMG during a PAP protocol. Countermovement jump height increased significantly (p = 0.008) from pre- to post-potentiation (from 41.0 ± 4.3 cm to 44.7 ± 4.1 cm). Neuromuscular function was measured before the first CMJ and after the last CMJ. A small and statistically non-significant decrease in the maximum voluntary contraction (MVC) (p = 0.142) and in voluntary activation (p = 0.06) was observed, but potentiated twitch force was significantly (p < 0.001) reduced after strength training (235 ± 65 N to 185 ± 51 N) in comparison to the control group.
Andrews et al. (2016) studied the effect of unilateral squats potentiation in the exercised leg and in the contralateral leg using a low fatigue protocol. The results showed no statistically significant differences at 1, 5 and 10 min in comparison to pre-test values for the drop jump contact time or the drop jump reactive strength index. Regarding the CMJ, a condition x time interaction indicated that the exercised leg exhibited significant but small to trivial magnitude jump height increases of 4.0% (p = 0.02; d = 0.36), 0.9% (p = 0.06; d = 0.08) and 1.6% (p = 0.04; d = 0.15) at 1, 5 and 10min post-intervention, respectively. The contralateral leg, on the other hand, had trivial CMJ deficits post intervention: 1.3% (p = 0.23; d = 0.12), 0.9% (p = 0.09; d = 0.10) and 1.7% (p = 0.03; d = 0.19) at 1, 5 and 10min postintervention, respectively.
Krzysztofik and Wilk (2020) showed that 3 sets of 5 repetitions of plyometric push ups with 1 min rest intervals improved bench press peak velocity (p < 0.01) and mean velocity (p < 0.01) compared to a control group. In addition, Krzysztofik et al. (2020a) also found that a PAP protocol consisting of 3 sets of 3 repetitions at 85% 1-RM achieved higher training volume based on time under tension at the end of the training session (p < 0.01) when compared to a control group, despite completing the same number of repetitions.
Discussion
The main finding of this systematic review is that the volume load plays an important role in performance enhancement after a conditioning activity. Four studies firmly support that the volume load is the main conditioning factor to achieve an optimal potentiation effect (Comyns et al., 2007; Gilbert and Lees, 2005; Krzysztofik et al., 2020b, 2020c), while four showed contradictory results (Gołas et al., 2017; Kobal et al., 2019; Poulos et al., 2018; Reardon et al., 2014). This systematic review also shows that when the total volume is low, intensity seems to be decisive (Andrews et al., 2016; Poulos et al., 2018).
Recruitment of type II fibers is needed to achieve potentiation, which is the result of combining volume and intensity (Bawa et al., 2014; Bompa and Haff, 2009; Henneman et al., 1974; Maloney et al., 2014). As stated by Schoenfeld (2010), in order to recruit high order motor units, light loads are not as effective as heavy loads. In the four studies (Comyns et al., 2007; Gilbert and Lees, 2005; Krzysztofik et al., 2020b, 2020c) firmly supporting our hypothesis, high intensities were used (up to 130% 1 RM) to achieve higher volume loads. However, potentiation can be achieved using lower volume loads as well (Gołas et al., 2017; Kobal et al., 2019). Gołas et al. (2017) and Kobal et al. (2019) performed between 3 and 5 sets with different loads ranging from 60% 1 RM to 100% 1-RM with a fixed rest interval. Considering that fatigue is especially evident when training is performed close to 1-RM or to failure (Dankel et al., 2017; Zajac et al., 2015), the better potentiation achieved in these studies with lower volume loads may rely on the rest-time between the conditioning activity and the re-test. Although according to Do Carmo et al. (2018) a self-selected rest may be sufficient to improve performance, other studies suggest that potentiation values peak after 8 min or longer resting periods (Gilbert and Lees, 2005; Kilduff et al., 2008).
The second finding is that a minimum effective intensity is needed to achieve potentiation. However, intensity should be understood as the amount of repetitions in reserve and not as the percentage of 1-RM. In order to achieve potentiation, we can either use light loads with high volumes or high intensities with low volumes (Bompa and Haff, 2009). Thus, when leaving at least 2 repetitions in reserve, performing multiple sets leads to potentiation without accumulating excessive fatigue (Andrews et al., 2016; Poulos et al., 2018). However, although lowering intensity during the conditioning activity may lead to lesser fatigue (Mina et al., 2019), leaving too many repetitions in reserve may not provide enough stimuli to elicit potentiation (Helms et al., 2016; Reardon et al., 2014). On the other hand, leaving too few repetitions in reserve (between 0 and 1) may lead to excessive fatigue and impaired performance after the conditioning activity (Helms et al., 2016; Reardon et al., 2014). In this way, the higher the intensity, the longer the rest interval the athlete needs to dissipate fatigue (do Carmo et al., 2018; Gilbert and Lees, 2005).
We also found different time-potentiation profiles for high- and medium-load protocols. In the study by Lowery et al. (2012), heavy and medium protocols peaked at the same time point, but potentiation achieved with the heavy loaded protocol was maintained for a longer time. These findings are in line with those of Gilber and Lees (2005), who reported different time-potentiation profiles; while the optimal power load group peaked earlier, the heavy loaded protocol group peaked later but with a higher potentiation effect (6.7% vs. 11.8%, respectively). These findings are in line with those by Krzysztofik and Wilk (2020) who observed the greater increase in peak velocity and mean velocity of the bench press in the first set after the plyometric push ups protocol. Thus, the time-potentiation profiles seem to be determined by the intensity of the stimuli and the resting time (fatigue-potentiation relationship). Fatigue in resistance training, as suggested by Zajac et al. (2015), is produced by post-exercise intramuscular perturbations (i.e., decrease in phosphocreatine, glycogen, ATP stores and augmentation of phosphate and hydrogen ions) and modulation of central motor drive during exercise by nociceptive afferent input (III and IV muscle afferents). These changes are especially evident when training sessions are close to 1-RM. During submaximal contractions, the closer to failure, the more motor units are recruited, but also the higher the metabolite accumulation, which contributes to fatigue (Dankel et al., 2017). This may partially explain the differences in the potentiation protocols leaving too many (Andrews et al., 2016) or too little (Reardon et al., 2014) repetitions in reserve during submaximal efforts.
We have to acknowledge several limitations. These include the lack of raw data for a deeper analysis. The main purpose of the review was to summarize the evidence so far and, if possible, to analyse differences in used protocols based on the volume load. While the most recent studies included raw data, the oldest ones did not. This limited our intention to compare the volume load of different protocols as we could not calculate it for 2 of the 13 studies. Another important limitation was related to the heterogeneity of the protocols used. Finally, the results of this review cannot be extrapolated to the general population as it only analysed trained subjects and almost all subjects were men. All these limitations imply that the conclusions of this review should be interpreted with caution.
Conclusions
Although different protocols can be used to achieve post-activation potentiation, it seems that higher intensities induce better performance enhancement. Our results indicate that potentiation effect exists as long as minimum intensity and sufficient rest intervals are provided. More precisely, the results of this study highlight the following:
Experienced athletes benefit more from a higher volume potentiation bout (1-3 sets), especially when the optimal power load is used.
Intensities of 65% 1RM are valid with high volumes, but higher potentiation effects can be achieved with 85% - 90% 1RM intensities. Higher intensities are useful, but they need longer rest intervals.
Repetitions to failure or almost to failure are not recommended because of the fatigue generated (2-3 repetitions in reserve).
Around 7-8 minutes of rest should be allowed in order to dissipate fatigue. Self-selected rest intervals are valid too, as they adjust quite precisely.
Due to major sensitivity of type II fibres to calcium concentration, athletes with a higher percentage of type II fibres will benefit more from heavy loads and longer rest intervals after PAP protocols (Blazevich and Babault, 2019).
Plyometric protocols combined with short or medium rest intervals are useful postactivation protocols for the bench press.