Introduction
An optimal hydration status (i.e. euhydration) influences athletes’ exercise performance and recovery (Chapelle et al., 2019). Starting a training session in a well hydrated status can ensure better functioning of the cardiovascular system as well as improved thermoregulation, metabolic and central nervous functions (Murray, 2007). Euhydration also leads to more efficient recovery and better physical preparation for the next training session or competition (Vanderlei et al., 2013).
To reach a euhydrated status athletes should follow a proper hydration strategy. For example, the American College of Sports Medicine (ACSM) advises to consume a fluid volume equivalent to 5–10 ml/kg body weight (i.e. 2–4 ml/lb) 2 to 4 hours before exercise. Afterwards, effective rehydration requires the intake of a greater volume of fluid (e.g. 125–150%) than the final fluid deficit (e.g. 1.25–1.5 L fluid for every 1 kg body weight lost). It is also demonstrated that the presence of dietary sodium/sodium chloride (from foods or fluids) helps retain ingested fluids (Thomas et al., 2016).
Euhydration thus refers to a wellbalanced body-water content, whereas hypohydration is the phenomenon where fluid loss of the body is not adequately compensated for by fluid intake. Dehydration, in turn, refers to the dynamic process of losing at least 2% of body weight due to body fluid loss (Armstrong, 2007). Athletic performance may be negatively affected by a hypohydrated as well as a dehydrated status (Fortes et al., 2018; Maughan, 2006). For example, it may increase the risk of injury and heat illness (Castro-Sepulveda et al., 2016), which is detrimental for both the athletes’ health and development as well as individual or team performances. In contrast, training in a euhydrated status is one of the prerequisites to optimally improve athletes’ aerobic and anaerobic power, attention, awareness, and heart rate recovery time as forms of training adaptation (Ayotte and Corcoran, 2018; Murray, 2007). Besides the above-mentioned negative consequences on athletic performance in general, it has been demonstrated that dehydration negatively affects soccer performance in particular. More specifically, dehydration leads to a reduction in passing decision-making performance (Fortes et al., 2018). A repeated measures cross-over study conducted by McGregor et al. (1999) also demonstrated 5% deterioration in performance of male university and semi-professional soccer players on a soccer dribbling skill test when fluid intake was prohibited, while this type of skill performance was preserved when fluid intake was allowed.
Although several papers on hydration in soccer exist, few have examined this phenomenon in female soccer players. A recent quantitative systematic review showed that only 5 of the 24 included studies examined pre-training/-game hydration status in women (Chapelle et al., 2019). However, substantial gender-related differences have been suggested concerning both the physical demands (e.g. distance covered on the pitch) and physiological responses (e.g. sweat rate and composition) in soccer alongside a different fluid balance which can be linked to the menstrual cycle in female players and the hormones involved in its regulation (Giersch et al., 2020; Maughan and Shirrefs, 2007; Shirreffs et al., 2006; Stachenfeld et al., 1999). Studies by Sepulveda et al. (2016), Gibson et al. (2012) and Mattausch et al. (2017), all indicated that the majority of female soccer players started their training session or competition game in a hypohydrated status. Since hypohydration is a common phenomenon, it seems valuable to educate soccer players about the importance of an optimal hydration status. In addition, the Fédération Internationale de Football Association (FIFA) indicates that individual requirements should be an essential part of a player’s hydration and nutrition strategy (Maughan, 2006). Chapelle et al. (2017) showed that an intervention involving individual player recommendations significantly improved the pretraining and pre-game hydration status in female soccer players. At baseline, only 33% of the participants in the Chapelle et al.’s (2017) study were found to be euhydrated, while this number increased to 89% after the intervention. Mattausch et al. (2017) also showed that after an intervention phase in which players received individual hydration recommendations based on recommended daily intake and fluid losses during exercise, the players’ pre-game hydration status improved from hypohydration to euhydration. Unfortunately, both of these previous studies did not include a control group, which makes it difficult to evaluate the true intervention effects.
Different methods exist to estimate an individual’s hydration status based on body fluids such as blood samples, urine, saliva and tears (Villiger et al., 2017). Up to date, however, a golden standard to determine one’s hydration status does not exist. Nevertheless, determining the Urine Specific Gravity (USG) by means of a refractometer is a frequently used technique to quickly, easily and accurately assess one’s hydration status under field conditions. Furthermore, the method is relatively cheap and does not require much expertise, making it an excellent field tool for both research and practice (Armstrong, 2007; Cheuvront et al., 2013; Villiger et al., 2017; Williams and Blackwell, 2012). However, despite USG is a common biochemical marker in order to screen fluid balance in athletes, USG cut-off values are not clearly determined in scientific literature. The only existing consensus at the moment consists of the cut-off value of 1.020 g/mL, meaning that the individual is hypohydrated when this value is attained or exceeded. Although some authors define USG-values below 1.020 g/mL as euhydrated, ample literature classifies USG-values below 1.010 g/mL as euhydrated and values between 1.010 g/mL and 1.019 g/mL as minimally hypohydrated (Casa et al., 2000; Chapelle et al., 2017).
The purpose of the present quasiexperimental study was to examine whether and to what extent an individually tailored intervention, focusing on the benefits of being optimally hydrated, may improve the hydration status (based on USG-measurements) of young female soccer players. Based on the existing literature it was hypothesized that receiving an individually tailored intervention would lead to an improved hydration status, whereas the hydration status would remain unaffected for the control group.
Methods
Participants
Using convenient cluster sampling, a total of 37 female soccer players (21.0 ± 4.0 years) were recruited from two different Belgian teams. Players of one team, playing in the Super League (i.e. highest division in female soccer), were assigned to the intervention group (n = 22; 19.8 ± 3.0 years; 62.2 ± 7.6 kg). Players of the other team, playing in the first division (i.e. second highest division in female soccer), were assigned to the control group (n = 15; 22.8 ± 4.0 years; 62.2 ± 7.1 kg). All participants included in the present study were non-professional (amateur) female soccer players.
Design and Procedures
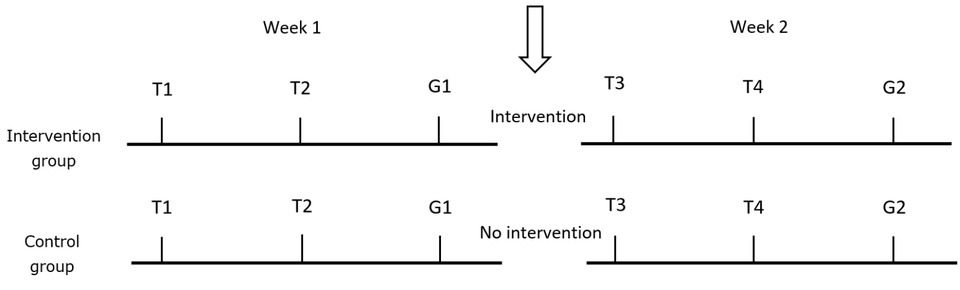
During this quasi-experimental trial, players of both the intervention and the control group were followed during two typical training weeks in autumn/winter 2018. Each of those weeks consisted of two training sessions and one competition game (Figure 1). The instructional and individually tailored intervention was planned in between the two training weeks and was based on the players’ hydration status as assessed during the first week of the trial. Players in the control group did not receive any intervention during the trial but they were informed that the collected urine sample was used to examine their hydration status.
Intervention
After the first week, all players assigned to the intervention group received general information about the importance of being euhydrated at the start of a training session or a competition game. Furthermore, each player in the intervention group received individually tailored information based on her own USG-values and the corresponding hydration category as measured during the first week of the trial combined with some personal feedback, comments and questions according to the relevant hydration categories (Table 1). For example, players were asked whether they prepared themselves differently (in terms of hydration) according to training or match play, whether they often experienced cramps or injuries, etc. A complete overview can be found in Appendix 1. Subsequently, each player was asked if she thought she was drinking enough before a training session or a competition game. If they were not sufficiently hydrated based on their test results of the first week, players were asked for potential reasons. Given that the intervention was aimed to improve the pre-training/-game hydration status, the reported USG-values are to be associated with fluid intake (which was not measured in this study) before and not during a training session or a competition game.
Table 1
Hydration categories determining the intervention tailoring.
Urine Specific Gravity (USG)
To determine the players pretraining/pre-game hydration status, a urine sample of at least 0.3 mL was required before each training session and competition game on site. To this end, a clinical refractometer (Atago, Pal-USG-CAT-10S, Tokyo, Japan) was used to determine the Urine Specific Gravity-values of the players immediately after collecting the urine sample. By analogy of Casa et al. (2000) and Chapelle et al. (2017), we used the following cut-off values for the categorization of hydration based on USG. An USG-value below 1.010 g/mL indicated euhydration. Values between 1.010 and 1.019 mg/L was considered as being minimally hypohydrated, a value equal to or over 1.020 mg/L as hypohydrated and when equal or exceeding 1.030 mg/L, the player was considered as severely hypohydrated.
Statistical analyses
SPSS (version 25) and R (RStudio version 1.2.5001) were used for data analyses, with pvalues < 0.05 being considered statistically significant. All variables were tested for normality of distribution with the Kolmogorov-Smirnov test. Mixed modelling was performed to assess within and between differences in hydration status over time and according to the group, respectively. The model included one level, namely the individual level, which was included as a random factor. Time (i.e. Training 1, Training 2, Game 1, Training 3, Training 4, and Game 2), group (i.e. intervention vs. control group) and the interaction term time x group were included as fixed factors. The maximum-likelihood (ML) method was used, as this approach produces more accurate estimates of fixed regression variables (which were of main interest in this study) compared to the ‘default’ restricted maximum-likelihood (REML) method (Field et al., 2012; Twisk, 2006). Mixed modelling is particularly well fitted to analyze repeated measures over time including missing values (Field et al., 2012).
Results
A minority (31.6%) of female soccer players in the intervention group and 45.5% of those in the control group started T1 in a euhydrated status. At T2, 44.4% of the intervention and 40.0% of the control group started their training euhydrated, while at G1, this was 50.0% and 42.9%, respectively. After the individually tailored intervention, at T3 and T4, 60.0% and 64.7% of players in the intervention group started their training euhydrated compared to 40.0% and 33.3% of players in the control group, respectively. At the last measurement (G2) of the trial, 66.7% of players in the intervention group started their game euhydrated, whereas only 16.7% of those in the control group attended their game (G2) in a euhydrated status.
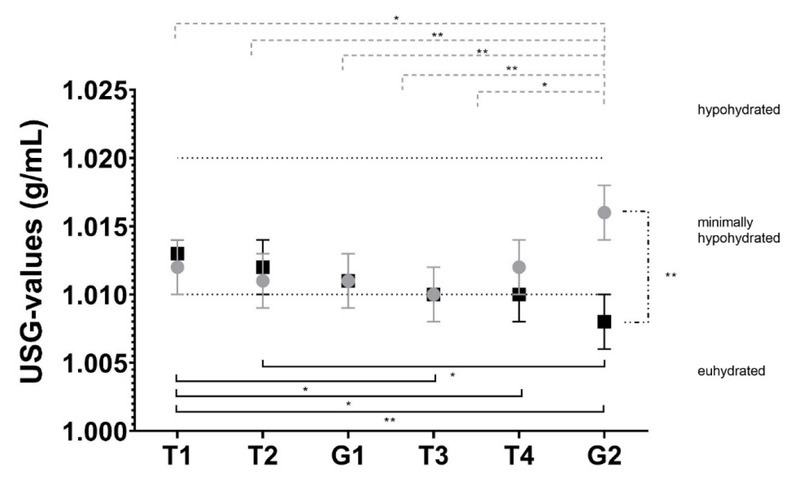
At baseline (i.e. the first week of the trial, before the intervention), no significant differences were found in mean USG-values between the intervention and the control group at T1 (t = 0.356, p = 0.724), T2 (t = 0.484, p = 0.632) and G1 (t = - 0.001, p = 0.999) (Figure 2).
Figure 2
Hydration status of the female soccer players in the intervention group (n = 22)
versus those in the control group (n = 15);
Intervention group
Control group
* p < 0.05
** p < 0.01
T1 = Training 1; T2 = Training 2; G1= Game 1; T3 = Training 3; T4 = Training 4; G2 = Game 2
A significant time x group interaction was found for USG-values across all measurements (t = -3.619, p < 0.001), indicating different time effects for each group.
Both groups showed a significant difference between the first and the last measurement (T1 vs. G2). The intervention group showed an improvement in their mean USG-value from 1.013 ± 0.001 g/mL at T1 to 1.008 ± 0.002 g/mL at G2 (t = -2.890, p = 0.005), while the control group showed deterioration in their mean USG-value from 1.012 ± 0.002 g/mL at T1 to 1.016 ± 0.002 g/mL at G2 (t = 2.298, p = 0.023). Players of the intervention group were thus better hydrated at the start of G2 than at the start of T1, while the opposite was found for the control group.
In the intervention group, hydration status in week 2 (i.e. T3, T4 and G2; after the intervention) was significantly better than at T1 (T1 vs. T3: 1.013 ± 0.001 g/mL vs. 1.010 ± 0.002 g/mL, t = 2.092, p = 0.039; T1 vs. T4: 1.013 ± 0.001 g/mL vs. 1.010 ± 0.002 g/mL, t = 1.997, p = 0.048; T1 vs G2: 1.013 ± 0.001 g/mL vs 1.008 ± 0.002 g/mL, t = -2.890, p = 0.005). Besides a significant improvement between T2 and G2 (T2 vs. G2: 1.012 ± 0.002 g/mL vs. 1.008 ± 0.002 g/mL, t = -2.255, p = 0.026), no significant differences were found between the other time points.
In the control group, hydration status at G2 (1.016 ± 0.002 g/mL) was significantly higher and thus worse compared to every other measurement (T1: 1.012 ± 0.002 g/mL, t = 2.298, p = 0.023; T2: 1.011 ± 0.002 g/mL, t = 3.185, p = 0.002; G1: 1.011 ± 0.002 g/mL, t = 3.263, p = 0.001; T3: 1.010 ± 0.002 g/mL, t = 3.121, p = 0.002; T4: 1.012 ± 0.002 g/mL, t = 2.206, p = 0.029). No significant differences were found between the other time points.
Comparing the intervention and the control group, a significant difference was found at G2 where the hydration status of the intervention group was significantly better than that of the control group (intervention vs. control: 1.008 ± 0.002 g/mL vs. 1.016 ± 0.002 g/mL, t = -3.180, p = 0.003).
Discussion
In the present quasi-experimental study, two female soccer teams were followed during two weeks, each comprising two training sessions and a competition game. Players’ USG-values were assessed before each training and competition to determine their pre-training/-game hydration status. In contrast with the control group, an individually tailored intervention took place after the first week of the trial for the players of the team assigned to the intervention group. To the best of our knowledge, the present study is the first con-trolled study investigating the effects of an individually tailored intervention targeting hydration in female soccer players.
In the present study, almost all players showed USG-values between 1.010 and 1.020 g/mL at baseline, which means that they were only minimally hypohydrated. Only 20 out of a total of 172 measurements performed in this study resulted in USG-values above this cut-off value for hypohydration per se. The mean pretraining/-game hydration statuses reported in the studies by Sepulveda et al. (2016) (1.029 ± 0.009 g/mL) and Mattausch et al. (2017) (1.023 ± 0.008 g/mL) were remarkably worse than in the present study. Thus, while previous studies indicated that the majority of female soccer players attended their training session or competition game in a hypohydrated status, the vast majority of players was only minimally hypohydrated at the start of the present study. This baseline difference between studies might be explained by the timing of evaluation. The present study was conducted during autumn/ winter, whereas the two latter studies were performed during summer. Higher temperatures related to that time of the year may result in more sweating, which in turn causes hydration status to deteriorate when there is insufficient fluid intake (Oliveira et al., 2017).
An improved pre-training/-game hydration status was noticed in the intervention group after players received the individually tailored intervention. Furthermore, the percentage of euhydrated players increased by 35.1% due to the intervention at the end of the trial (G2). In the study of Chapelle et al. (2017), an increase in euhydrated players of 56% was reported on the day after the information session, while on the final tournament day (three days after the information session) none of the players were considered euhydrated. It should be mentioned that, in contrast with the present study, the final measurement (on the final day of the tournament) in the study of Chapelle et al. (2017) was a rest day, which possibly explains the above mentioned deterioration as players might be less motivated to hydrate sufficiently.
It is quite striking that, at the end of the present quasi-experimental trial, the hydration status of the control group deteriorated compared to the initial measurement. Although, based on our collected data, we cannot explain this sudden increase in USG-values, this may indicate a certain (random) variability of hydration across measurements. Nevertheless, USG-samples were consistently collected at the same time, under comparable conditions with the same amount of time between the previous effort, which enhances reliability. However, it should be noticed that the observed effect is not only provoked by the intervention itself but also by the deterioration of USG-values in the control group. Therefore, our results should be interpreted with caution. In contrast with previous findings of Chapelle et al. (2017), players in the intervention group were not better hydrated before a competition game than before a training session. Players in the control group on the other hand, were better hydrated before the training sessions compared to the game, but only during the second week. Again, this was due to the remarkable deterioration in hydration status during G2.
Similar to Mattausch et al. (2017), an individually tailored intervention was implemented in the present study. While Mattausch et al. (2017) provided a 4-week intervention, we applied a one-off intervention as proposed by Chapelle et al. (2017) ), and we also included a control group. During our intervention, information was given to the players based on their hydration status measured at baseline. An educational approach was used, which turned out to be necessary since the majority of players in the present study mentioned that they had little knowledge concerning consequences of starting a training session or competition in a hypohydrated status. In light of future studies, other methods such as self-monitoring and continuous feedback can also be applied to monitor (a further increase in) the effect of the intervention (Michie et al., 2013). In practice, this can easily be done by providing players a urine color scale based on which they can individually control and optimize their pretraining/-game hydration status (Lievens et al., 2017). When it is possible, keeping a drinking diary the hours before training sessions and games can also be a part of the self-monitoring. In addition, it is recommended to analyze players over a longer period of time to gain more insight in the long-term effects of the proposed individually tailored intervention.
The first strength of the present study is the inclusion of a control group. Compared to previous uncontrolled studies, the addition of such a control group increases the internal validity of study findings. Second, to increase external validity, all data were collected under natural field conditions in the players’ natural environment. Thirdly, we tailored the intervention to the needs of each individual female soccer player, based on the respective baseline USG-values. One of the limitations of this study, however, is that players were not randomly allocated at the individual level to either the intervention or the control group, especially considering the fact that both teams did not play at the same competition level. Although no significant differences in hydration status between players of both teams were found at baseline, it is possible that the team playing at the higher level made greater efforts and thus lost more fluid than those playing at the lower level. Second, all data were collected under roughly the same weather conditions during autumn/winter, which implies that the results may not be generalized to other seasons because of interseason variations in both sweating and fluid intake (Edelenyi et al., 2016). Thirdly, we only evaluated the short-term effect of the intervention, precluding conclusions in the long-term. Next, the type of fluid intake used to hydrate athletes was not taken into account although previous studies have indicated that some fluids such as alkaline water or oral rehydration solution (ORS) drinks are more effective in hydrating athletes than plain bottled water (Chycki et al., 2017; Maughan et al., 2016). In addition, it should be noted that volume and timing of fluid intake were not monitored in this study. Finally, information concerning participants’ menstrual cycle was not collected in our sample of female soccer players. Although it is known that hormones, such as estrogen and progesterone, can play a significant role in changes in thirst and volume control (Giersch et al., 2020; Stachenfeld et al., 1999), obtaining this more sensitive and subjective information was omitted from the protocol to ensure study participation as well as sufficient statistical power.
Overall, it can be concluded from this quasi-experimental study that the hydration status of female soccer players is better when compared to those in other studies since the average USG-values were consistently below 1.020 g/mL (i.e. minimally hypohydrated). The individually tailored intervention as provided in our study was effective since it caused significant improvements in players’ hydration status (i.e. lower USG-values), a finding which was absent in the control group. In contrast, the control group’s hydration status even deteriorated during the experiment. These study results show that it is advisable to inform female soccer players about the importance of being euhydrated at the start of a training session or competition game and that it is possible to improve their pre-training/-game hydration status.