Introduction
Basketball is a globally popular sport in which improved performance depends on training a combination of skills. Although basketball requires good aerobic recovery from high-intensity activity, there is agreement that good basketball performance depends on anaerobic capacity (Canovas-Lopez et al., 2014; Delextrat and Cohen, 2009), hence it is very important for players to follow a good conditioning program. For example, jumping, sprinting and dribbling are of great importance for basketball players and depend on strength, speed, and coordination (Komi and Bosco, 1978).
Three different kinds of training were used in this investigation: plyometric training, strength training, and change of direction (COD) training. The plyometric exercises combined eccentric and concentric muscle actions in what is termed the stretch-shortening cycle (SSC) (Saez de Villarreal et al., 2009). The SSC improves the ability of the muscle-tendon unit to produce maximal force in minimum time (Komi, 2000). The strength training program comprised traditional resistance training techniques, including selfloading exercises and exercises with additional weight (Harrison, 2010). Finally, the COD training program consisted of circuits performed with a basketball that involved rapid, whole-body movements involving changes of velocity and direction (Sanchez-Sanchez et al., 2018).
Plyometric training has been shown as an effective method to improve performance of explosive actions (e.g., jump, sprint, and COD) (Sáez de Villarreal et al., 2015; Slimani et al., 2016). Several authors concluded how the magnitude of adaptive responses to plyometric training could be different depending on participants’ characteristics (e.g., training level, sex, and especially maturity status) (Moran et al., 2017a, 2017b). In this regard, recent studies have reported that maturation may play a crucial role in training adaptations (Meylan et al., 2014; Moran et al., 2017b). Thus, previous studies have revealed the importance of trainability associated with natural accelerated maturity of specific athletic skills (e.g., COD, sprint, or jump) (Meylan et al., 2014; Moran et al., 2017a).
A recent meta-analysis regarding the age-related variation and adaptive responses to plyometric training in youth athletes (Moran et al., 2017a) has found that, categorized into three maturity groups, a greater adaptive response was observed in individuals in the PRE-peak height velocity (PHV) (10-12.9 years) group and in individuals in the POST-PHV (16-18 years) group compared to those in the MID-PHV (13-15.9 years) group. However, another previous review has shown that sprint performance gains due to training are associated with the age of participants (Moran et al., 2017c). Therefore, responses to training are age and maturation dependent in the youth (Moran et al., 2017a, 2017b).
Plyometric and strength training programs are the most commonly used method to improve basketball-specific performance indicators such as jump height. It has been shown that plyometric (Andrejic, 2012; Asadi et al., 2017; Khlifa et al., 2010; Maćkała and Fostiak, 2015; Santos and Janeira, 2011; Zribi et al., 2014) and strength (Santos and Janeira, 2012) training programs, performed separately or in combination (Chappell and Limpisvasti, 2008; Santos and Janeira, 2008), enhance vertical and horizontal jump performance in basketball players. A few studies have described the transfer of the training effects from different plyometric or strength training methods to other skills that are nevertheless critical to young basketball players’ performance, such as COD (Kilinç, 2008; Maćkała and Fostiak, 2015). It appears that plyometric training can improve ability to COD when not dribbling a basketball (Asadi et al., 2016), but it is not known whether it also improves COD with a basketball. Plyometric training may be an effective method to improve sprint and agility (Asadi et al., 2017; Banda et al., 2019) performance in youth basketball players and recent research has shown that strength training can also have a positive effect on youth basketball players’ sprint performance (Gonzalo-Skok et al., 2016; Alemdaroğlu, 2012).
To the authors’ knowledge, no study has examined the effects of a short (7 weeks) period of plyometric training, strength training, and COD training with a ball on vertical jump, flexibility, a zig-zag sprint with a ball and a maximal sprint with a ball in high-school basketball players. The purpose of this study was to compare the effects of plyometric, strength, and COD training on basketball-specific performance measures (jump, sprint, COD, and flexibility). We hypothesized that plyometric training would enhance players’ vertical jump, sprinting, COD, and flexibility more than strength or COD training. We believed that a good combined training program and commitment from the players would have positive effects.
Methods
Participants
Forty male pubertal (U-15) basketball players from two different teams (age: 14.2 ± 1.3 years; body height: 1.68 ± 0.17 m; body mass: 52.5 ± 4.2 kg; body fat content: 18.6 ± 2.2%; playing experience: 4 ± 1.6 years) volunteered to participate in the study (Table 1).
Participants included in this study were analyzed by the maturation equation described by Mirwald et al. (2002). Briefly, to estimate participants maturity status, anthropometric measurements were taken and entered into an equation to predict maturity offset, where maturity offset = -29.769 + 0.0003007· Leg Length and Sitting Height interaction -0.01177·age and Leg Length interaction + 0.01639·age and Sitting Height interaction + 0.445·Leg by Height ratio, where R = 0.96, R2 = 0.915 and SEE = 0.490. Based on the peak height velocity (PHV) offset, participants ranged from -0.4 to +0.4 years.
All players competed in a national league, playing one match a week and training twice a week. Players were excluded from the investigation if they met any of the following criteria: a) injured less three than months prior to the study; b) failure to recover or complete rehabilitation of a previous injury; c) suffering from a condition that would prevent them from participating in the technical and tactical basketball training, and/or the experimental training programs; d) missed two or more experimental training sessions, or two or more technical and tactical basketball training sessions. No participant was excluded from the study after recruitment. All participants were in good health and able to participate in the training interventions. Before participating in this project, which was approved by the Institutional Ethics Review Committee of the University, all participants were fully informed about the protocol and their parents or guardians provided written consent to their participation in accordance with current national and international laws and regulations governing the use of human participants in research (Declaration of Helsinki II).
Design and Procedures
We examined how four different 7 week training interventions affected a number of basketball performance variables: vertical jumping ability, hamstring and lumbar extensibility, and sprinting with a ball. The study was conducted during 7 weeks (14-session) of the basketball season with high-school players. Participating players were randomly assigned to one of the four training groups in a counterbalanced manner. All participants were tested before and after the 7 week training period to determine the effects of the 3 training interventions. The tests performed were a counter movement jump (CMJ), Abalakov jump (ABKJ), sit and reach flexibility test (SRFT), 10 m zig-zag sprint with the ball, and 20 m sprint with the ball. After the baseline assessment all participants were assigned to one of the four following groups: plyometric training (PG, n = 10); strength training (SG, n = 10); COD training with the ball (CODG, n = 10); and a control group (CG, n = 10). All training sessions were supervised by a physical and athletic performance specialist, and participants were instructed in the proper execution of all exercises. All players had experience with these training approaches and were familiarized with the exercise technique. Participants were also instructed to avoid any strenuous physical activity not related to the training intervention and to maintain their usual diet (they were not allowed to drink caffeinebased beverages) for the duration of the study.
All participants were familiarised with the test procedures one week before the baseline assessment. In addition, several warm-up sets were recorded before the actual maximal and explosive tests during each testing session to ensure stability of each measure. Both the baseline and post-training assessments were completed in a single session that took place between 17:00 and 21:00. The baseline assessment was carried out one week before the experimental training programs started and the post-training assessment was performed one week after they had finished. The tests were completed in the following order: CMJ, ABKJ, 10 m zig-zag sprint with the ball, 20 m sprint with the ball, and SRFT. Before testing all participants completed a warmup consisting of 10 min of sub-maximal running and a basketball-specific warm-up that involved vertical jumps, sprints, and joint mobility. Ten minute rest intervals between tests were given to limit the effects of fatigue on subsequent tests. All tests were conducted indoors.
Counter Movement Vertical Jump and Abalakov Jump
The CMJ consists of a jump starting from an upright position, with hands on hips and with counter-movement. The hands are placed on the hips at the start of the test and remain there throughout. The athlete squats until the knees are bent at 90 degrees, then jumps vertically as high as possible, landing on both feet at the same time. In the ABKJ the athlete squats until the knees are bent at 90 degrees while swinging the arms back behind the body. Then the arms are immediately swung forwards and the athlete jumps as high as possible, landing on both feet at the same time. Both jumps were used to assess explosive strength of the lower limbs. The tests were performed using an optical measurement system (Optojump; Microgate, Milan, Italy) that quantified flight and contact times. Each participant completed 3 trials with 5 s of rest between trials for each kind of the jump. Three trials were completed, and the best performance was used for the subsequent statistical analysis (Sáez de Villarreal et al., 2008). Participants were instructed to land in an uptight position and to bend the knees after landing.
10 m Zig-zag Sprint Test
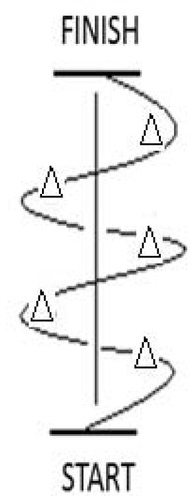
Participants sprinted 10 m with a change of direction. They started from behind the baseline with their left foot forward when they were ready and dribbled with their left hand when moving to the left and their right hand when moving to the right. The course was defined by five cones set in the center of the testing area 1.5 m apart to each other and 1.5 m from the centerline (Figure 1). Photocells (Microgate, Milan, Italy) were positioned at the beginning and at the end to measure the time taken to complete the course. Two trials were completed and the best was used for further statistical analyses. Two minutes of rest were permitted between trials.
20 m Sprint Test
A 20 m sprint test was selected because it is a common test used in the evaluation of basketball players’ sprinting ability. After the completion of a specific warm-up (i.e. 3-5 submaximal running in the 20 m line) all participants performed two maximal 20 m sprints, each separated by two min of rest. Participants initiated the sprint from a standardized starting position that was 0.5 m behind the start line. Photocells (Microgate, Milan, Italy) were positioned at the beginning, at the 10th and the 20th m, to measure the time taken for the first and second halves of the course and the total time. Two trials were completed and the best result was used for further analyses.
Sit and Reach Flexibility Test
This test was used to assess lumbar and hamstring flexibility. The participant sat on the floor with legs together, knees extended and the soles of the feet placed against the edge of a box. The thumbs were clasped so that hands were together, palms facing downwards. The participant then extended his arms as far forwards as possible. A sit and reach box was used to measure the distance reached (ACCUFLEX I Flexibility Tester, height: 32 cm; PSYMTEC, Madrid, Spain). Two trials were completed, with a pause of 30 s between trials and the best result was used for analyses.
Training program
The three experimental groups followed the appropriate experimental training protocol twice a week (Monday and Wednesday) during 7 weeks of the intervention (14 sessions), before basketball-specific training. The CG only performed standard basketball training. All 40 players completed all training sessions using appropriate boots and clothes for basketball. All sessions lasted 90 min and consisted of the following components: 10 min of a standard warm-up, 20 min of experimental training (plyometric training, strength training or COD training with the ball; experimental groups only), 55 min of standard basketball training, and 5 min of cool-down, including stretching exercises. In the experimental training protocols the rest interval between each set was 1 min. The three experimental training programs are outlined in Tables 2, 3, and 4. The plyometric training program was based on the guidelines drawn up by Radcliffe and Farentinos (1999). All training sessions for all groups were fully supervised to ensure that players used the correct technique for each exercise. All participants were carefully instructed on how to perform the experimental exercises. They observed a practical demonstration and performed familiarisation trials. No acute injuries occurred during the training sessions.
Table 1
Descriptive data of the sample by groups
PG: plyometric group; SG: strength group; CODG: change of direction group; CG: control group; PHV: peak height velocity; Y: years.
Table 2
Plyometric training program
Table 3
Strength training program
Table 4
Change of direction training program with the ball
Statistical analysis
The values are expressed as mean ± standard deviation (SD). Test-retest absolute reliability was assessed using the coefficient of variation (CV), whereas relative reliability was calculated using the intraclass correlation coefficient (ICC) with a 95% confidence interval (CI), using the one-way random effects model. Homogeneity of variance across groups was verified using the Levene’s test, whereas the normality of distribution of the data was examined with the Kolmogorov-Smirnov test. A 4 (group) × 2 (time) repeated measures analysis of variances (ANOVA) was calculated for each variable. Bonferroni post-hoc tests were used when the interaction was significant. Effect sizes (ESs) were calculated with Hedges and Olkin’s g (Hedges and Olkin, 1985), using the following formula: g = (Mpost – Mpre)/SDpooled, where Mpost is the post-test mean, Mpre is the pre-test mean, and SDpooled is the pooled SD of the measurements. The magnitude of the effect size statistics was considered trivial <0.20; small, 0.20-0.50; moderate, 0.5-0.80; large, 0.8-1.30; very large >1.30 (Ramírez-Campillo et al., 2014). The ES aws reported in conjunction with the 95% confidence interval (CI) for all analyzed measures. The level of significance was set at p ≤ .05. All statistical analyses were performed with the statistical software package (SPSS 20.0 version, Chicago, Illinois, USA).
Results
Analyses of variance (ANOVAs) revealed that at baseline, there were no differences between-groups in any of the strength, flexibility, agility, anthropometric and performance variables tested. The results are outlined in Table 5.
Table 5
CMJ (cm), ABKJ (cm), 10-m zig-zag test (s), 20-m sprint test (s) and SRFT (cm) performance of the experimental groups before and after 7 weeks of training
[i] CMJ: counter movement jump; ABKJ: Abalakov jump; SRFT: sit and reach flexibility test; PG: plyometric group; SG: strength group; CODG: change of direction group; CG: control group; S: seconds; M: meters; CM: centimeters; ES: effect size Values are reported as mean ± standard deviation. † Significant differences (time) between pretraining and posttraining values (p < .05). $ Significant differences (groups x time) from plyometric group (PG) and strength group (SG) with change of direction group (CODG) (p = .025). # Significant differences (groups x time) from control group (CG) with plyometric group (PG) (p = .015), strength group (SG) (p = .008) and change of direction group (CODG) (p = .001). a, b, c, d and e denotes trivial, small, moderate, large and very large ES, respectively
Height in the Counter Movement Jump (CMJ)
After 7 weeks of training (post-test), significant improvements were found in the PG (4.44 cm; 16.87%; p = 0.02), SG (3.16 cm; 11.39%; p = 0.004), and CG (0.93 cm; 3.31%; p = 0.013) in the CMJ test. Post hoc analyses revealed no betweengroup differences in CMJ height. The coefficient of variation (CV) for test-retest reliability was 2.1% and the intraclass correlation coefficient (ICC) was 0.95 (95% CI: 0.92-0.97).
Height in THE Abalakov Jump (ABKJ)
After the 7 week intervention, significant improvements were observed in the PG (3.96 cm; 13.45%; p = 0.009) and SG (2.42 cm; 7.8%; p = 0.019) in the ABK test, although post hoc analyses showed no between-group differences in ABK height. The coefficient of variation (CV) for test-retest reliability was 2.3% and the intraclass correlation coefficient (ICC) was 0.92 (95% CI: 0.90-0.94).
10 m Zig-zag Sprint Test
Significant improvements were also found in the CODG (0.62 s; 9.02%; p = 0.012) in the 10 m zig-zag sprint test. Post hoc analyses revealed between-group differences (p = 0.001) in times for the 10 m zig-zag sprint test. The CG was significantly slower (-0.04 s, 0.63%, ES = 0.07) than the PG (-0.47 s; 6.79%; p 0.015) and CODG (-0.62 s, 9.02%; p = 0.001). The coefficient of variation (CV) for test-retest reliability was 2.6% and the intraclass correlation coefficient (ICC) was 0.86 (95% CI: 0.84-0.88).
20 m in line Sprint Test
Following 7 week training, significant improvements were found in the SG (0.08 s; 4.78%; p = 0.015) and CODG (0.20; 8.49%; p = 0.005) in the 20 m in line sprint test. There were between-group differences (p = 0.004) in times for the 20 m sprint. In the first half of the sprint (0-10 m) the CG was significantly slower (-0.04 s, 1.33%) than the SG (-0.11 s, 4.78%; p = 0.008) and CODG (0.20 s, 8.49%; p = 0.011). The coefficient of variation (CV) for test-retest reliability was 2.5% and the intraclass correlation coefficient (ICC) was 0.88 (95% CI: 0.86-0.90).
Sit and Reach Flexibility Test (SRFT)
All the groups i.e., PG, SG, CODG, and CG showed a significant improvement in the SRFT (3.64 cm, 412.6%, ES = 2.04; 2.94 cm, 425%, ES = 1.4; 2.35 cm, 201.2%, ES = 0.96, and 1.27 cm, 101.58%, ES = 1.83, respectively). Post hoc analyses revealed between-group differences (p = 0.036) in SRFT performance. Post hoc tests confirmed that the PG and SG achieved a greater distance (3.64 cm, 412.6%; 2.94 cm, 425%, respectively) than the CODG (2.35 cm, 201.2%; p = 0.025). The coefficient of variation (CV) for testretest reliability was 2.5% and the intraclass correlation coefficient (ICC) was 0.88 (95% CI: 0.86-0.90).
Discussion
The results of this experiment add knowledge to previous studies on different performance adaptations through the use of traditional strength, plyometric, and COD training with ball approaches in high-school basketball players on a set of basketball-related physical skills, namely jumping, sprinting with a ball and lumbar and hamstring flexibility. Our findings illustrate that a 7 week plyometric training approach results in a greater improvement in vertical jump and COD performance than strength and COD training. The results also show that a COD training program produces a more powerful stimulus in improving COD and sprint performance than the strength training program, and that all the training programs produce a significant improvement in the flexibility conditions.
The PG showed improvements in CMJ and ABKJ height (ES = 0.49 and ES = 0.37, respectively). These results are consistent with earlier research (Chappell and Limpisvasti, 2008; Khlifa et al., 2010; Santos and Janeira, 2011; Zribi et al., 2014) in which plyometric training of the lower limbs improved vertical jump performance. Also consistent with previous research (Tansel et al., 2008), we observed improvements in CMJ height (ES = 0.56) and ABKJ height (ES = 0.31) in the SG. Earlier research found that combined strength and plyometric training had greater effects on vertical jumping than strength training alone (Andrejic, 2012; Santos and Janeira, 2008). The CG also achieved improvements in CMJ height (ES = 0.19) and in ABKJ height (ES = 0.27) due to technical and tactical basketball training. Although the improvements in vertical jumping in the CG were trivial, they nevertheless suggest that technical and tactical basketball training can help to maintain or improve youth basketball players’ jumping (Gonzalez et al., 2012). The only group whose jumping performance did not improve was the CODG, which suggests that the COD program used in this study does not improve vertical jumping. This result contrasts with earlier research in which CMJ height improved after 10 weeks of strength training, sprint training, endurance training, and technical and tactical basketball training (Kilinç, 2008). This suggests that combining COD training with strength training, sprint training, endurance training, and technical and tactical basketball training might improve vertical jumping.
Both the SG and CODG showed improvements in time for the first half of the 20 m sprint (ES = 0.42 and ES = 0.71, respectively), but these decreases were not accompanied by improvements in total time for the 20 m sprint. There were no improvements in the second half of the 20 m sprint performance; this result is in conflict with other research (Maćkała and Fostiak, 2015; Ramírez-Campillo et al., 2015a, 2015b; Söhnlein et al., 2014) which found that running speed for a 20 m sprint was improved after a plyometric training program. Ramírez-Campillo et al. (2015b) reported that 6 weeks of plyometric training induced meaningful changes in the 20 m sprint (ES = -0.5) in 14-y players. The reason of discrepancy in the rate of training effect might be due to different individual adaptive responses to plyometric training (Ramírez-Campillo et al., 2018). It is well known that sprint-running performance is the product of the stride rate and stride length with numerous components influencing this apparently simple task. Since both elements are clearly influenced by anthropometric characteristics, one of the main possible explanation for no improvement in sprint performance could be the anthropometric variable. This is especially important for youth athletes in the early stages of development where the technical abilities still have a great window for improvement. During maturation the natural development of sprint performance occurs due to greater muscle size, increased limb length, changes in musculotendinous tissue, enhanced neural and motor development, and better movement quality and coordination (Oliver and Rumpf, 2014).
Our results are consistent with studies (Monteiro et al., 2008; Ferrete et al., 2014) showing that a stretching program can increase flexibility in young people and adults who have followed a strength training program. All the groups in our study performed passive stretching exercises after their technical and tactical basketball training. It should be noted that all our participants were going through puberty, which may have influenced the results. In descriptive terms the PG, SG, CODG, and CG showed increased flexibility after the 7 week study period. Both the PG and SG showed differences compared with the CODG. These results suggest that it may be worth incorporating stretching exercises into strength training, and technical and tactical basketball training.
Basketball requires athletes to execute complex skills, not only on their preferred side using their dominant hands, but also on their nonpreferred side. Flexible use of the dominant and non-dominant hand is crucial, especially in competitive play, when athletes face pressure from opponents and have to select an appropriate action rapidly (Stöckel et al., 2011). It is relevant to this that only the CODG showed an improvement in performance on the 10 m zig-zag sprint test (ES = 0.91). The structure of COD training with the ball is much more complex than without the ball. In addition, the basic skills without the ball have much stronger relation among speed, agility, and quickness than the skills with the ball (Sporiš et al., 2011). This may be why the other groups did not show improvement in this test.
Finally, throughout the 7 weeks of training none of the players suffered a lower limb injury during training or match play. Neuromuscular training, resistance training, and plyometric training seem to improve the hamstring-quadriceps neuromuscular properties (Pettitt and Bryson, 2002), thus reducing the risk of injury.
In conclusion, the current study demonstrates that 7 weeks of different training programs (plyometric, strength, and COD) significantly improve vertical jump, sprint, COD, and flexibility performance in high-school basketball players. The estimated improvements in the vertical jump, sprint, and COD as a result of plyometric and strength training could be considered as practically relevant and of high importance for athletes in basketball.
Finally, the current study was focused on young male participants. As young males and females clearly experience different effects from plyometric training according to sex specific maturational development, future studies should take a similar approach for female participants. Considering that biological maturity may affect adaptations to strength and conditioning practices in general, and resistance training and plyometric training in particular, future plyometric training studies should strive to include youth athletes’ biological maturity as a moderator in the analyses. Despite these limitations, the current study makes an original and significant contribution to the literature and clearly shows the merits on including plyometric training as part of a wellrounded athletic development program to enhance jumping, sprinting and COD performance in young basketball players.