Introduction
Ground reaction forces (GRF) are very important for quantifying and evaluating jump performance and have been determined in previous investigations (Claudino et al., 2017; Jensen et al., 2013; McErlain-Naylor et al., 2014). A counter-movement jump (CMJ) is a vertical jump that is very often used to evaluate the ability of explosive force production, in order to identify athletes’ strengths and weaknesses as well as to measure training progress (Claudino et al., 2017; Gathercole et al., 2015).
Feature identification and pattern recognition of kinetic waveforms are both important tasks in the field of biomechanics. Features are commonly extracted based on two main domain features: time domain and frequency domain. The time domain has mathematical functions used to extract continuous or discrete information from the signals. The frequency domain has mathematical functions that capture repetitive patterns of signals and are often related to the natural periodicity of the activities.
Features from the time domain previously used to quantify jump performance include: the rate of force development (RFD), peak rate of force development (PRFD), normalized peak force, impulse and peak power (PP). Researchers (Jensen et al., 2013; Laffaye and Wagner, 2013; McLellan et al., 2011; Moura et al., 2015; Pupo et al., 2012; Tillin et al., 2010) discovered that the RFD and PRFD were determined by motor unit activation and were highly correlated with athletes’ explosive force production and CMJ performance. When forces were integrated over time, net and relative net impulse were able to be used to evaluate CMJ performance (Kirby et al., 2014). In addition, PP from CMJ was one of the most important variables for jump performance, and showed significant correlation with weightlifting ability and sprint performance (Harman et al., 1990; Ozbar et al., 2014). Moreover, several statistical methods were developed and used to interpret the clinical meaning of GRF (Jensen et al., 2013; Labanca et al., 2016; Parker et al., 2018).
In addition to the analyses of the forcetime waveform in a time domain, the waveform can be transformed into a frequency domain. Wu et al. (2014) suggested that frequency domain analyses can describe a periodic movement and reveal the characteristics of anatomical components governing the pattern. GRF is the kinetic manifestation of the summation of many oscillatory anatomical components, such as joints, muscles, and nerves used when walking. Each anatomical component has its own frequency, and a frequency domain analysis of the GRF reveals the frequency spectrum of these components.
There are several frequency domain analysis methods, but Fourier analysis is often used to evaluate biological signals. Previous studies indicated Fourier analysis makes numerical comparisons of patterns convenient, reliable, and simplifies the averaging process. Moreover, frequency domain analysis was sensitive enough to detect differences between individuals (Alexandral and Jayes, 1980; Schneider, 1983), and was a reliable surrogate to detect landing mechanics during running studies (Blackmore et al., 2016). Rapid changes in the pattern of biological signals were reflected in highfrequency content as it was transformed into frequency domains (Giakas et al., 1999; Stergiou et al., 2002; Tsepis et al., 2004). Tsepis et al. (2004) found that the frequency content was different when comparing ACL-deficient and healthy participants. Other studies (Lauer et al., 2005; Patterson and Brown, 1987; White et al., 2005) determined that patients with diseases had higherfrequency components in the mediolateral direction compared with healthy participants during walking tasks. Alexandral and Jayers (1980) observed that using Fourier analysis was sensitive enough to detect individual differences between healthy participants during walking tasks.
Due to neuromuscular, mechanical, and training factors, GRF waveforms from the CMJ have different patterns: non-modal, unimodal or bimodal (Jensen et al., 2008; Richer et al., 2012). These patterns may influence the reliability of several variables, such as RFD or PRFD (McLellan et al., 2011), but frequency domain analyses will not be influenced by pattern changes. As frequency analyses may detect frequency characteristics and the components of biological signals independent of the waveform, it remains unknown how Fourier analyses may assist CMJ signal evaluation. Thus, there is a need to determine frequency characteristics from GRF waveforms for researchers to evaluate jump performance.
Therefore, the purpose of this study was to identify frequency domain variables and their relationship with jump performance. The second purpose of the study was to compare the sensitivity of time and frequency domain variables of CMJ performance. It was hypothesized that kinetic variables calculated in both time and frequency domains would be significantly correlated with jump performance.
Methods
Participants
Forty-four Division I American football players (body mass 101 ± 18.96 kg, 21 ± 2 years old) participated in the study. An individual was excluded if he (1) was not a collegiate athlete or (2) he had experienced any lower extremity injuries within the last three months. Athletes read and signed university-approved informed consent documents. All athletes wore training shoes, 30 of whom wore the same type. Prior to testing, each athlete participated in 10 minutes of self-paced jogging and three sets of five jumping jacks.
Measures
During the experiment, each participant performed three maximum effort trials of a CMJ. Each participant stood still and waited for the subsequent verbal instruction of ‘3, 2, 1, jump’ and then performed a self-selected preparatory downward movement to approximately 90 degrees of knee flexion. The leg extensor muscles were stretched (eccentric contraction), followed by maximal explosive extension in the opposite direction (concentric contraction). Sixty to ninety seconds of rest was given between two jumps, allowing for an appropriate recovery. Arm movements were not restricted in order to maintain a natural movement pattern (Gutiérrez-Dávila et al., 2014). Kinetic variables were collected from dominant (determined by the kicking leg) and non-dominant legs using two force plates (AMTI 600 x 400 mm) at a frequency of 1,000 Hz. Trials were considered valid when both feet jumped and landed on the force plates.
Design and Procedures
All signals were filtered with a 40 Hz low pass Butterworth filter to remove noise. A Fourier transform of the signals showed that the frequency components above 40 Hz were negligible; therefore, 40 Hz was selected as the cut-off frequency of the low-pass filter. Higher cut-off frequencies were examined, but provided no difference. Jump performance variables were extracted from the force-time curve. The beginning of the CMJ was defined as a force magnitude 15 N lower than the body weight. The end of the CMJ phase was defined as when the force magnitude was lower than 15 N. The net impulse was calculated from both downward and upward phases. The Trapezoidal Rule was used to approximate the integral of the force-time curve.
The net impulse was then divided by body weight to produce the normalized net impulse. JH was calculated based on take-off velocity, using the impulse and momentum theorem.
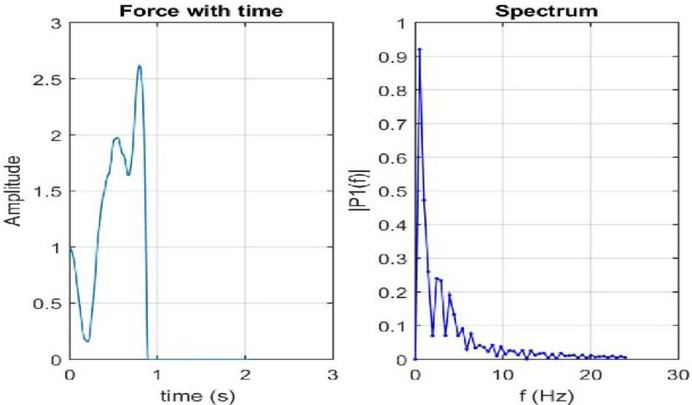
Next, PP from the CMJ was calculated from the force and velocity values. PP and PRFD were normalized to body weight. For frequency analyses, the direct current component was eliminated from the signal. The single-sided spectrum of the vertical force during the jumping phase was calculated by the Fourier transform function in MATLAB, defined as:
In addition, 99% of the signal power was reconstructed from the inverse Fourier transform of the first several significant components to verify the validity of the Fourier transform. The process was as follows:
The summations were evaluated with all the significant coefficients. The mean frequency of the force signal was defined as the power-weighted summation of all significant frequency components:
where P was the total power of the signal, fi and pi were the ith harmonic component and its power, and N was the harmonic number that accounted for 99% of the total energy. The median frequency of the force signal was defined as the frequency component that accounted for 50% of the total energy.
Statistical analysis
Pearson’s product correlations were performed between normalized peak force (Fpeak), the normalized net impulse, normalized PP, the normalized rate of peak force development (RPFD), mean frequency, median frequency, and JH. Coefficients of variation were calculated for each variable. The intra- and inter-subject variability was determined by calculating the coefficient of variation from the three trials of each participant and the total number of participants, respectively. The level of significance was set at p ≤ .05 for all statistical analyses. Based on Hopkins’ qualitative description, strength of the relationship was defined as: minor correlation (.10 < r ≤ .30); moderate correlation (.30 < r ≤ .50); large correlation (.50 < r ≤ .70); very large correlation (.70 < r ≤ .90); and perfect correlation (.90 < r ≤ 1) (Kotrlik et al., 2011). All statistical analyses were completed using SPSS software 21.0.
Results
The mean (±SD) values of normalized Fpeak, the RPFD, the net impulse, PP, mean frequency, median frequency and JH are presented in Table 1. Intra- and inter-subject variability for normalized Fpeak, net impulse, PP, RPFD, mean frequency, median frequency and JH are shown in Table 2. The correlations of kinetic variables and JH are presented in Table 3. Large to perfect significant correlations were found between JH and normalized Fpeak, the net impulse, and PP (r = .725, r = .998, r = .630, respectively, p < .05). Moderate positive correlations between mean frequency components with JH performance were observed (r = .355, p < 0.05). Median frequency did not correlate significantly with JH.
Table 1
Group performance data: mean ± SD values
Table 2
Coefficient of variance for CMJ variables
Discussion
This was the first study using the frequency domain to investigate CMJ performance. The advantages of frequency domain analyses are the inclusion of the bandwidth properties of the signal. Frequency domain analyses can identify multiple frequency components. Frequencies of movements only change based on the number of oscillations that occur per second and they are independent of the time required to perform a task (Wurdeman et al., 2012). In general, better performers showed greater values for both mean and median frequency components, while lower performers had lower mean frequency magnitude with minimal higher frequency components (Figure 2). The relative high frequency comprises quick changes associated with the rapid acceleration from the beginning of the downward movement to the end of the pushoff phase. Frequency analyses determine the range of frequencies relative to interactions between the bones, muscles, nerves, and connective tissue during movements (McGrath et al., 2012; Wu et al., 2014). Coordination also plays a significant role in force production and energy transmission. Previous studies (Gheller et al., 2015; Kopper et al., 2012; McErlain-Naylor et al., 2014) showed that better timing of shoulder flexion, trunk movement, knee flexion, and ankle plantar flexion during the propulsion phase could differentiate good performers from the others. Thus, good CMJ performance requires not only coordinated energy transition from proximal to distal joints within a certain time frame, but also a faster transferring rate (Bobbert et al.,1996; Jensen et al., 2013; Luhtanen and Komi, 1978; McErlain-Naylor et al., 2014).
A positive and significant relationship was observed between the mean frequencies and CMJ performance, but the relationship was relatively weak compared with time domain variables such as a normalized impulse, PP, and peak force. One reason that frequency variables did not show strong correlations with jump performance was that the waveform did not include features that were sensitive to jump height. Certain differences from time domains were apparent and identifiable, but the majority of participants shared similar frequency contents in the current study. Better performers did show certain higher frequency components, but the percentage of high frequency components only comprised a small percentage of the GRF signals. Consistent with previous studies (Blackmore et al., 2016; Giaskas et al., 1999), components from the frequency domain analysis were reliable, while the mean frequency was more reliable than the median frequency and most other time domain variables. Overall, variables from frequency domain analysis showed less variability within a single participant.
Consistent with previous studies (Floria and Harrison, 2013; Kennedy et al., 2018; Nuzzo et al., 2008; Ritcher et al., 2012;), time domain features such as normalized peak force, impulse, peak power, and PRFD correlated with JH. Participants who had larger normalized impulse demonstrated better vertical jump performance (r = .9981). According to Newton’s second law, greater JH requires a significantly larger relative impulse, allowing a player to achieve a greater vertical velocity throughout the concentric phase of the jump. One of the most important factors is the integration of the force and time curve (Balster et al., 2016; Ruddock et al., 2015). Thus, the ability to produce greater force and to further activate the muscle at a higher force level is important (Maffiuletti et al., 2016). Factors such as skeletal muscle fiber composition could determine performance in a multi-joint movement, due to the differences in the mechanical characteristics of the motor units muscle fibers (Bosco and Komi, 1979). Exercise involving dynamic and explosive muscle contractions is the most effective training modality to lead to neural adaptations and an increase in type II muscle fiber size. The current study recruited 44 college football players, with several years of training experience. Good performers showed larger net impulse magnitude, supporting the fact that the normalized net impulse is correlated with CMJ performance (Carlock et al., 2004; Claudino et al., 2017; Harman et al., 1990; Rudock and Winter, 2015).
The current study was consistent with previous studies (Carlock et al., 2004; Marques et al., 2011; Ozbar et al., 2014; Pazin et al., 2013), in that PP and PRFD were statistically significant with CMJ performance. The magnitude of PP output depends on the association of force and velocity with muscle contraction (Carlock et al., 2004). PRFD played an important role for PP. PRFD capacity was primarily determined by motor unit discharge rates, muscular properties and training specificity (Maffiuletti et al., 2016). One previous study (Aagaard et al., 2002) indicated that the maximal motor unit discharge rate determined the capacity of force production at the onset of contraction. McLellan et al. (2011) determined that the RFD at 100 ms and 200 ms correlated with CMJ performance, which confirmed the importance of the PRFD for PP and superior acceleration capacity during sports (Sha et al., 2014; Tillin et al., 2013). However, previous studies (Costley et al., 2018; McLellan, et al., 2011) suggested that, as an indicator of jump performance, the rate of force development had relatively low reliability, especially during a drop-jump task. Similarly, intra-subject CV values of the RPFD from the current study ranged from 5 to 30%. Thus, the PRFD should be used with caution for data analyses.
One of the limitations of the current crosssectional study was that only the relationship between CMJ performance and time/frequency variables was explored, and the causes were not identified. The effects of training upon frequency components still need to be determined in future studies. The second limitation of the current study was that participants were all male American football athletes. The outcome of frequency domain analysis for participants from different sports and training backgrounds may need to be confirmed. Lastly, frequency analyses can determine differences in frequencies that occur from these different interactions, but it cannot specifically indicate which interaction was problematic (McGrath et al., 2012; Wu et al., 2014; Wurdeman et al., 2012).
Conclusions
The current study analyzed CMJ performance within both the time and the frequency domain. Time domain analyses are more sensitive to pattern changes and better prediction for jump performance, while frequency domain analyses are sensitive to signal component detection. Combining both time and frequency domain analysis may provide a more detailed assessments and evaluation of CMJ performance.