Introduction
During high intensity short duration efforts (30 to 180 s), the maximum amount of adenosine triphosphate resynthesized (ATP) by non-oxidative metabolic pathways is responsible for a substantial energetic contribution (~70 to 35%, respectively) (Medbø and Tabata, 1993), playing a fundamental role in sprint running (100 to 400 m) and cycling mechanical performance (500 to 1500 m) (Foster et al., 2003, 2004; Spencer and Gastin, 2001), and during the end spurt of distance cycling trials (3000 m) (Foster et al., 2003). Considering the importance of the non-oxidative pathways for high intensity efforts, several studies have proposed methods to estimate maximum non-oxidative energy release during different high intensity efforts (i.e., anaerobic capacity) through metabolic evaluations (Medbø et al., 1988; Miyagi et al., 2017; Zagatto et al., 2018), using techniques such as muscle biopsy (Medbø et al., 1988) or through the relationship between metabolic values and mechanical power output (Bertuzzi et al., 2015; Scott et al., 1991; Zagatto et al., 2017).
Among these methods, a recent possibility proposes estimation of anaerobic capacity using classic findings from Margaria et al. (1933) and Di Prampero and Ferretti (1999) about energetic estimation, considering the curve decay analysis of excess post-exercise oxygen uptake to estimate the oxygen equivalent from the phosphagen pathway (EPCr) and net blood lactate concentration corresponding to the oxygen equivalent from the glycolytic pathway (E[La-]), and thus assuming anaerobic capacity as the sum of E[La-] and EPCr (AC[Epcr + La-]) during a single exhaustive supramaximal continuous effort (Bertuzzi et al., 2010). This method was validated (compared with the most accepted method; maximal accumulated oxygen deficit) to estimate anaerobic capacity at intensities between 100 and 150% of intensity corresponding to maximal oxygen uptake, suggesting that anaerobic capacity can be estimated even in a short duration effort (i.e., ~53 s), although the 115% supramaximal intensity presented higher correlations and agreement values (Zagatto et al., 2016).
In addition, AC[Epcr + La-] is a valid method to estimate anaerobic capacity, and a comparison with other anaerobic procedures could strengthen the protocol, due to the similar energy resynthesis through non-oxidative metabolism in these efforts, such as the 30 s Wingate Anaerobic Test (30sWAnT) (Scott et al., 1991). The 30sWAnT is a widely used test to estimate mechanical work associated with non-oxidative pathway performance and has also been used to validate other anaerobic methods (Bertuzzi et al., 2015; Scott et al., 1991; Zagatto et al., 2009). Recent studies investigated the relationship between AC[Epcr + La-] and anaerobic procedures, such as the 30sWAnT and adaptation to running (i.e., 30-s all-out tethered running test) (Bertuzzi et al., 2015; Zagatto et al., 2017). These authors found a significant correlation between AC[Epcr + La-] and peak power (PP) and mean power (MP) for the 30sWAnT (r = 0.78 and 0.79, respectively) and between MP, total work (TW), and mean force (MF) (r = 0.58; 0.57 and 0.79, respectively) for the tethered running test, indicating that AC[Epcr + La-] seems to present a relationship with anaerobic indices. However, these studies only compared AC[Epcr + La-] with anaerobic work during the 30sWAnT and a tethered running test, they did not measure the metabolic contribution of the 30sWAnT and the tethered running test, which could strengthen the findings, since the concepts of AC and anaerobic work are different (Green, 1995; Minahan et al., 2007).
Therefore, the purpose of the current study was to investigate the relationship between anaerobic energy contribution measured during a supramaximal constant effort (i.e., better intensity for AC[Epcr + La-] measurement) with mechanical and anaerobic contribution during the 30sWAnT. Based on the concept of Bertuzzi et al. (2015) and Zagatto et al. (2017), we hypothesized that AC[Epcr + La-] would be significantly correlated with 30sWAnT mechanical performance (i.e., PP, MP, and TW). In addition, considering the high contribution of anaerobic metabolism to the 30sWAnT (Beneke et al., 2002), the anaerobic contribution during the 30sWAnT may be related with anaerobic energy contribution in a supramaximal continuous effort at 115% of intensity corresponding to maximal oxygen uptake.
Methods
Participants
Fifteen male mountain biking practitioners (Mean ± SD: age: 30 ± 4 yrs; body mass: 76.5 ± 13.4 kg; body height: 178.6 ± 7.9 cm; weekly training volume: 237.1 ± 127.0 km·week-1) participated in the current study. Participants were considered recreational cyclists following the Pauwn et al. (2013) guidelines. Before beginning the procedures, participants were informed about the potential risks and benefits of the study, and then signed informed written consent. All procedures were approved by the Local Ethics Committee (Protocol 645.784 / 2014) and were conducted according to the Declaration of Helsinki. In addition, participants were instructed to avoid any substance that could interfere with mechanical performance, such as caffeine and alcohol, and not to perform exhaustive exercises, for at least 24 hours before each session.
Experimental design
Participants visited the laboratory four times, interspersed with at least 48 h and all procedures were applied in a maximum period of two weeks. On the first visit, participants performed a familiarization session with a supramaximal effort and a Wingate test. On the second visit, they performed a graded exercise test (GXT) to determine maximal oxygen uptake
All physical fitness tests were performed on an electromagnetic braked cycle ergometer (Lode-Excalibur Sport, Lode BV, Groningen, The Netherlands), in an environment with a controlled temperature and humidity (20 ± 1ºC and 63 ± 10% respectively). The GXT and the supramaximal test were conducted with a predefined cadence between 70 and 100 rpm (± 5 rpm of a chosen cadence during all efforts). Saddle settings and crank distance from the handlebars were also previously defined, recorded, and used in all efforts. In all tests the warm-up was standardized at 100 W and five minute duration, however, for the 30sWAnT, two sprints of 2-3 s were performed in the 3rd and 4th min of the warm-up (Beneke et al., 2002).
Physiological analysis
During all tests, respiratory gas exchange was measured breath-by-breath using a stationary gas analyzer (Quark PFT, COSMED, Rome, Italy), while the heart rate was monitored with a heart rate transmitter belt (Wireless HR 138 Monitor, COSMED, Rome, Italy). The equipment was calibrated immediately before each procedure, according to the manufacturer's recommendations. The respiratory gas exchange values obtained were smoothed every five points and then interpolated every second using OriginPro 8.0 software (OriginLab Corporation, Microcal, Massachusetts, USA) to reduce the “noise”.
Blood samples were collected from the ear-lobe (25 μL) at rest (before the supramaximal test and the 30sWAnT) to measure baseline blood lactate concentration ([La-baseline]) and at minutes 3, 5, and 7 after all efforts to measure the peak of blood lactate concentration ([La-peak]). The samples were stored at -20ºC in Eppendorf® tubes containing 50 μL of 1% sodium fluoride and subsequently analyzed using an electrochemical lactate analyzer (YSI 2900, Yellow Springs Instruments, Ohio, USA) with a standard error of ± 2 %.
Graded exercise test (GXT)
The graded exercise test was designed to lead to exhaustion in ~8-12 min (Howley et al., 1995). Thus, the initial intensity corresponded to 100-125 W, which was increased by 25 W every 2 min until voluntary exhaustion or the inability to continue the effort at the pre-established cadence (Miyagi et al., 2017).
The oxygen uptake for each completed stage was measured during the final 30 s of every stage.
Completed power and increment power were expressed in watts (W); time of uncompleted stage and time of the full stage were expressed in seconds (s).
Supramaximal exhaustive effort at 115% of i V ˙ O 2 m a x
Before the warm-up participants remained quietly seated for 10 min for measurement of the baseline oxygen uptake and collection of resting blood lactate. After the warm-up, participants performed a supramaximal effort at 115% of
30-s Wingate Anaerobic Test (30sWAnT)
Before the warm-up and immediately after the test, participants remained quietly seated for 10 min to measure the same variables reported in the supramaximal effort. The 30-s Wingate Anaerobic Test (30sWAnT) corresponded to an all-out effort of 30 s with fixed resistance (0.7
N·m·kg-1), following the manufacturer's recommendations (Standard Wingate test - Wingate, Lode Manager 10.0, Lode, Netherlands) (Outlaw et al., 2014). Power and pedaling frequency were measured with acquisition data of 50 Hz throughout the test. The peak power (PP) was considered the highest value of power achieved during the test. The mean power (MP), fatigue index (FI) [(PP – Lower power) x 100)/PP], and total work (TW) were also measured.
Energetic pathways and anaerobic capacity measurements
The energetic contribution from the phosphagen pathway (EPCr), glycolytic pathway (E[La-]), and anaerobic capacity (AC[Epcr + La-]) were measured in the supramaximal exhaustive effort at 115% of
The energy delivered from EPCr was estimated as the product between amplitude 1 (A1) and time constant 1 (τ1), calculated using a bi-exponential fit (equation 2) in the post-exercise oxygen uptake slope, using software OriginPro 8.0 (Origin Lab Corporation, Microcal, MA, USA) (Bertuzzi et al., 2010; Miyagi et al., 2017; Zagatto et al., 2016). The energy delivered from E[La-]was estimated by the difference between the peak and rest blood lactate concentration, assuming an oxygen equivalent of 3 mL·kg-1 for each 1.0 mmol·L-1net lactate (Di Prampero and Ferretti, 1999). Finally the AC[Epcr + La-] was assumed as the sum of energetics from EPCr and E[La-] for the supramaximal exhaustive effort at 115% of
Statistical analysis
The data are presented as mean ± standard deviation (SD) and 95% confidence intervals (CI95%). Initially, the data were submitted to the Shapiro-Wilk test to verify normality. In addition the Pearson correlation test was used to verify the associations between AC[Epcr + La-], mechanical performance variables from the 30-WAnT, and non-oxidative energetic contributions during the 30-WAnT. Correlations were interpreted according to the value of the correlation coefficient, classified as very weak (0.0 to 0.2), weak (0.2 to 0.4), moderate (0.4 to 0.7), strong (0.7 to 0.9), and very strong (0.9 to 1.0) (Rowntree, 1991). Additionally, comparative analysis between the energetics during the supramaximal test and the 30sWAnT was performed using Bland–Altman plots and the intra-class correlation test (ICC) (model: two-way mixed model; type: single measurement; definition: absolute agreement). To verify possible differences, a paired Student t test was used. In all cases, the significance level was ≤ 5% (p ≤ 0.05).
Results
The exercise duration during the GXT was 14.12 ± 3.23 min (CI95% = 12.32 to 15.91 min). Only 3 participants reached the oxygen uptake plateau during the GXT, while all participants reached the secondary criteria to confirm V̇O2max,
The time to exhaustion in the 115% of
Table 1 shows the values of mechanical outcomes from the 30sWAnT, corresponding to PP, MP, fatigue index (FI), and time to PP and TW.
Table 1
The 30sWAnT mechanical variables.
Regarding the energetics estimation during the 30sWAnT, A1 (n = 13) was 1.34 ± 0.25 L (CI95% = 1.18 to 1.49 L) and τ1 (n = 13) was 1.11 ± 0.21 min (CI95% = 0.98 to 1.24 min), thus the 30sWAnT-EPCr (n = 13) was 1.47 ± 0.36 L (CI95% = 1.26 to 1.69 L). For the measurement of the glycolytic pathway, [La-baseline] was 0.99 ± 0.19 mmol·L-1 (CI95% = 0.88 to 1.09 mmol·L-1) and [La-peak] was 11.73 ± 2.20 mmol·L-1, therefore the 30sWAnT-E[La-] was 2.44 ± 0.69 L (CI95% = 2.02 to 2.85 L). The 30sWAnT-AC[Epcr + La-] (n = 13) was 3.91 ± 0.89 L (CI95% = 3.38 to 4.45 L), while the 30-WAnT-AC[Epcr + La-] relativized by the 30sWAnT was 0.130 ± 0.030 L per s (CI95% = 0.113 to 0.148 L per s). During the 30sWAnT, two participants felt nausea caused by acidosis, preventing the post-exercise oxygen uptake measurement, for this reason, only 13 participants were analyzed for 30sWAnT-EPCr and for 30sWAnT-AC[Epcr + La-].
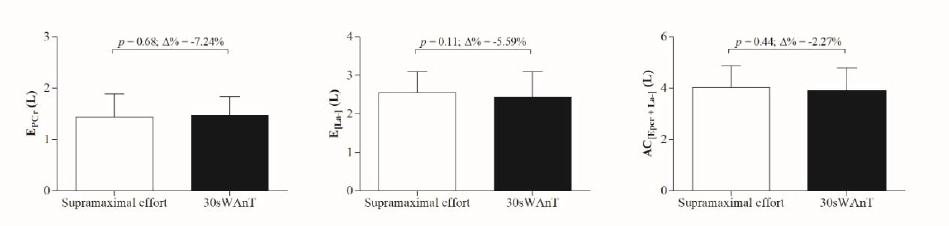
No difference was observed between non-oxidative energetic contribution measured during the 115% of
Figure 1
Comparison and percentage of variation (Δ%) in non-oxidative energetics measured during the 115% of
In addition, the coefficients of correlation between energetics measured during the 115% of
Table 2
Coefficient of correlation between energetics measured during the supramaximal effort at 115% of
| Peak Power (W) | Mean Power (W) | Total Work (kJ) | Fatigue index (%) | |
|---|---|---|---|---|
| EPCr (L) | 0.57* | 0.69** | 0.69** | 0.17 |
| E[La-] (L) | 0.85** | 0.78** | 0.78** | 0.15 |
| AC[Epcr + La-] (L) | 0.88** | 0.89** | 0.89** | 0.19 |
Discussion
The main findings of the study reveal a good relationship between non-oxidative pathways measured during supramaximal exhaustive effort at 115% of
The significant correlations between the phosphagen pathway and PP are in accordance with a previous investigation which also reported a significant correlation between these metabolic and mechanical variables in cycling (r = 0.71) (Bertuzzi et al., 2015). The possible explanation for this association between EPCr and PP may be related to the energetic aspect of the 30sWAnT, as this effort can deplete phosphocreatine stores by ~83% (Bogdanis et al., 1996), mainly during the initial three seconds of effort (Serresse et al., 1988), which also corroborates the time to PP observed in the present investigation (2.47 ± 0.84 s). In addition, EPCr was also correlated with MP and TW, suggesting that EPCr, besides playing an important role during the first seconds of the effort, also plays a significant role during all efforts lasting around 30 s. These findings corroborate the findings from Milioni et al. (2017), which reported a significant correlation between mean power during a repeated 35-m sprint test (i.e., 30sWAnT adaptation to track running) and the phosphagen pathway (r = 0.65). In addition, energy contribution of the phosphagen pathway during the 30sWAnT is relevant (~31%) (Beneke et al., 2002), a fact that may strengthen the importance of this metabolic pathway for power output during the 30sWAnT.
As well as EPCr, the glycolic pathway measured during the supramaximal test was also significantly associated with PP, MP, and TW. The blood lactate concentration is related to non-oxidative work and mechanical performance (Fujitsuka et al., 1982), eventually exerting a direct influence on E[La-] (i.e., main indicator of E[La-]contribution). Bertuzzi et al. (2015) also reported a positive relationship between E[La-] and MP (r = 0.72); the authors did not report any correlation data between this energetic pathway and other mechanical performance variables during the 30sWAnT. The glycolytic pathway can provide around 50% of total energy (i.e., non-oxidative plus oxidative phosphorylation contributions) of the 30sWAnT, explaining 83% and 81% of the variance in PP and MP, respectively (Beneke et al., 2002). Furthermore, the 30sWAnT can deplete glycogen content by ~30%, which accounts for 97% by glycolytic intermediates (i.e., pyruvate and lactate) (Bogdanis et al., 1996). Together, this evidence probably explains the relationship between E[La-] and mechanical performance during the 30sWAnT.
Considering the importance of glycolytic and phosphagen contribution to the 30sWAnT energetics (i.e., 81.4% of total energy contribution) (Beneke et al., 2002) and, consequently, to mechanical performance (Bertuzzi et al., 2015; Bogdanis et al., 1996; Milioni et al., 2017), our results (i.e., significant correlation between AC[Epcr + La-] and PP, MP, and TW) are expected, since anaerobic capacity is the sum of phosphagen and glycolytic contributions. These results are also in accordance with the findings of Scott et al. (1991), as those authors reported a significant correlation between anaerobic capacity measured by maximal accumulated oxygen deficit with both PP and TW (r = 0.69 and 0.64, respectively) for a group of heterogeneous runners (n = 12). Another study has demonstrated a non-significant correlation between anaerobic capacity measured by maximal accumulated oxygen deficit and mechanical variables from the 30sWAnT (Minahan et al., 2007).
These contradictory results may be attributed to the evaluation method, since in those studies different numbers of submaximal efforts were used, and the intensity of the supramaximal effort was different. In fact, these differences can influence the reliability of the maximal accumulated oxygen deficit method (Doherty et al., 2000). On the other hand, the method used to estimate anaerobic capacity in the present study (i.e., AC[Epcr + La-]) presents higher reliability than the maximal accumulated oxygen deficit method (de Poli et al., 2019), and thus may be more robust to estimate anaerobic capacity. It is noteworthy that, besides mechanical performance during the 30sWAnT being more dependent and associated with mechanical power output, even when compared with oxidative mechanical variables (e.g.
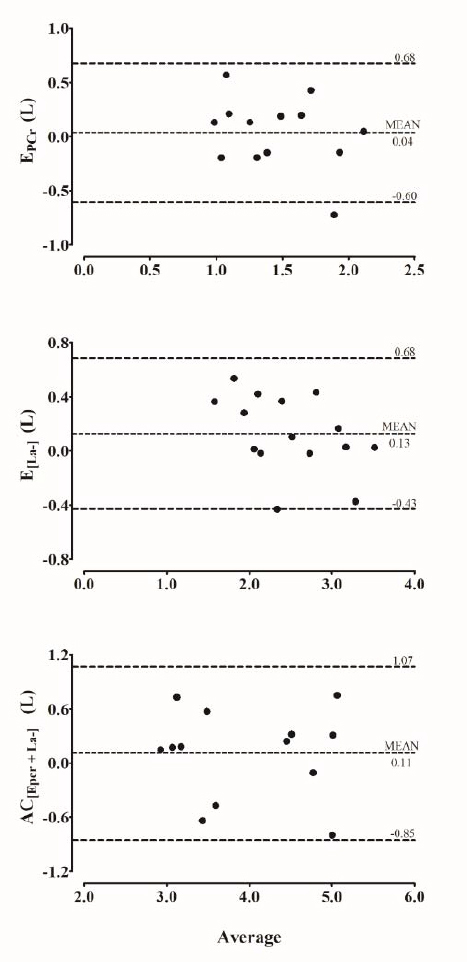
Another interesting finding in the current study is the possibility of estimating phosphagen and glycolytic pathway capacity, and consequently anaerobic capacity during the 30sWAnT. In general, anaerobic capacity (i.e., maximum ATP resynthesized by a non-oxidative source during a specific effort) is estimated during supramaximal efforts that lead to exhaustion between the 2nd and the 3rd minute (Medbø et al., 1988; Miyagi et al., 2017; Zagatto et al., 2016, 2018), regardless of the anaerobic training status (Zagatto et al., 2017), considering that this time to exhaustion is required for severe depletion of phosphocreatine and glycogen stores (Medbø and Tabata, 1993). Besides this, anaerobic capacity measured during the 30sWAnT was not different to that measured in the supramaximal constant effort (p = 0.44) and their absolute values are in line with those previously reported in cycling (Miyagi et al., 2017; Zagatto et al., 2018). In addition, the Bland-Altman concordance analysis (Figure 2) showed a mean difference close to zero between AC[Epcr + La-] measured in the 30sWAnT and supramaximal constant effort, with lower limits of agreement even when compared with previously reported results for a 2-3 min exhaustive effort (i.e., 3 minutes all-out) (-1.33 to 1.13) (Zagatto et al., 2018).
Despite these results, it is important to note that although AC[Epcr + La-] is considered a valid and reliable method for anaerobic capacity estimation and is commonly used for this purpose (Bertuzzi et al., 2010, 2015; Milioni et al., 2017; Miyagi et al., 2017; Zagatto et al., 2016), there are some limitations in the use of blood lactate to estimate the glycolytic metabolism pathway. Despite the fact that blood lactate mirrored muscle lactate concentration, part of lactate is oxidized in the muscle (Bangsbo et al., 1990), underestimating the glycolytic contribution. In addition, the oxygen equivalent blood lactate accumulation proposed by Di Prampero and Ferretti (1999) may not represent the exact stoichiometric ratio between lactate and the ATP resynthesized.
Even considering that the 30sWAnT is not an ideal effort for high depletion of phosphocreatine and mainly glycogen stores (Medbø and Tabata, 1993), similar results between anaerobic capacity measured during the supramaximal exhaustive effort at 115% of ("iV" ) ̇"O" _"2max" and the 30sWAnT can hypothetically be attributed to greater muscle activation during higher intensity efforts, with a consequently higher rate of glycolytic pathway activation (evidenced by higher concentration of blood lactate) (Thomas et al., 2016) and to severe depletion of phosphocreatine stores (Bogdanis et al., 1996). However, muscle activation and content of muscle glycogen and phosphocreatine were not measured in the present study, thus further studies are needed to test this hypothesis. In addition, the possibility of estimating anaerobic capacity during the 30sWAnT must be assumed only for recreational mountain bike trained individuals (i.e., endurance trial), as sprinters may have a higher rate of non-oxidative energy release (Schenau et al., 1992) and, consequently, different energy release during the 30sWAnT.
In summary, glycolytic and phosphagen capacity, as well as anaerobic capacity determined during a 115% of