Introduction
Handball is an Olympic team sport that was first introduced at the 1972 Summer Olympic Games in Munich, Germany. Handball is a fast-paced, team invasion game played indoors. It is characterized by a contest between two teams aiming to score more goals than their opponent, while also preventing them from scoring when they have possession of the ball (Lamas et al., 2014; Wagner et al., 2014). Due to the sport’s physically demanding nature, previous studies on performance in handball have largely focused on the biomechanical and physiological aspects of the sport (Cardinale et al., 2015; Chelly et al., 2011; Manchado et al., 2013; Saavedra, 2018). Given that a team’s success depends not only on the individual performances of each player, but also the team’s ability to effectively carry out tactical skills, some research has also been conducted using the dynamic complexity perspective (Gutiérrez and Ruiz, 2013; Prieto, 2015; Wagner et al., 2014).
The approach in this paper seeks to improve upon traditional performance indicators used in handball, such as scoring efficiency, player actions, and collective tactics by supplying them with a time-dependent match context. The context is especially important in the performance analysis of game sports like handball, because the outcome of a match is contingent on the interplay between the two teams rather than the unique performance of each teams’ skills and abilities (Lames and McGarry, 2007). This interaction effect is dynamic, as any change in a team’s behavior can elicit different responses from their opponent. The research area in performance analysis which assesses changes in intra-match performance, particularly by investigating momentary success rates, is called momentum analysis (Franks and Hughes, 2004; Hughes et al., 2013, 2015). There are some methodological suggestions for achieving this task, most of which rely on score lines or the results of a single ball possession or rally (O'Donoghue and Ponting, 2005). Lames (2006) introduced a method using a double moving average (DMA) for assessing dynamic strength over handball matches. This method has also been applied to table tennis (Fuchs et al., 2018; Liu et al., 2015).
In simple terms, a moving average is an average of the previous n number of data points and is used to establish trends to investigate these averages over time (moving average). Traditionally, a moving average has been used to analyze financial data like stock prices or to examine gross domestic product or the employment rate (Zakamulin, 2017). Mathematically, this technique smooths out short-term fluctuations in the data points and highlights longer term cycles, making it work like a filter. This moving average technique can also be used in the performance analysis of net games (tennis, table tennis) and invasion games (basketball, handball) involving rallies or ball possession where each rally/ball possession ends with a final stroke, point or error.
However, we must be careful not to confound momentum analysis in performance analysis with psychological momentum. Whereas the former is a method of descriptive modelling of a team’s momentary playing strength, the latter is used in sports psychology to assess cognition, the success-performance relationship, and the behaviors of athletes, coaches, and fans (Redwood-Brown et al., 2018).
In our study, we apply the concept of momentary strength to investigate the dynamic interaction between teams in handball matches during the World Championship in 2019. For this purpose, we applied a model which had been developed whereby momentary strength of a team was continuously calculated over time during a match. Momentary strength can be understood as the ratio between the number of a team’s ball possession and scored goals. By analyzing the relationship between the momentary strength of two competing teams, we are then able to assess the dynamic nature of a handball match. This method of momentum analysis furthers the existing work in the performance analysis of handball, precisely because it acknowledges the interaction effect and provides insight into a match context (Ferrari et al., 2019; Korte and Lames, 2019; Milanovic, 2018; Pic, 2018; Saavedra et al., 2018).
We were most interested in the dispersion of momentary strength throughout a match because large changes in momentary strength could influence the interpretation of classical summative performance indicators. Furthermore, we wanted to determine how often a team experienced weak and strong momentary strength phases during a match and whether the frequency at which a team spent in these phases differed between winning and losing teams.
Based on this, the present study aimed to describe the dynamic interaction in handball matches from theoretical and practical perspectives by applying a model of momentary strength that considered the interaction effect and provided insight into match dynamics for handball games. Empirically, the method was applied to a representative and up-to-date sample of world-class handball, analyzing matches from the 2019 International Handball Federation (IHF) Men’s World Championship.
Methods
Sample
The sample entities in this study were comprised of all matches (n = 96) during the 26th International Handball Federation (IHF) World Men’s Handball Championship in 2019 held in Denmark and Germany. Participants of this tournament included 24 national men’s handball teams from 5 different confederations. The sample included 10,417 situations of ball possession.
All matches were analyzed post-game using re-live video footage provided by a TV broadcasting company, SportDeutschland TV, which is run by the German Sports Federation and realizes free internet broadcasts of less popular sports events. The TV broadcaster provided links to all matches from the World Championship. The links were accessed directly by the observers to make the necessary game annotations (described in the data acquisition and observer agreement sections), thus the observational design of this study was nomothetic, one-time and multidimensional (Pic et al., 2019).
Variable: Momentary Strength
To analyze a handball game using this method, each ball possession of a team was assigned a result of 0 (= no goal scored) or 1 (= goal scored). For each possession, additional information needed to be recorded: the possession number, the current score, the team with ball possession, the time the possession started according to the official game clock, and comments about special events in the game such as a timeout or a 7 m penalty. As soon as one possession was terminated, the next possession began with the ball possession of the other team, meaning possession switches frequently from team to team. The only time ball possession might not be assigned a result was due to the half-time or full-time whistle, terminating the possession before a goal was attempted.
To calculate the double moving average, the ball possession first needed to be separated by the team. The moving average for each team was then calculated by averaging the result of four sequential situations of possession, using formula (1) with k = 4. The length of four has been previously determined as an acceptable “compromise between stability and flexibility” (Fuchs et al., 2018). This calculation was a forward moving average, meaning it took the successive results into account. The double moving average calculated via formula (2) and the average of the previous four moving averages (backward moving average) were calculated, making it a double moving average. This combination of forward and backward averages is common practice for double moving average calculations, as it synchronizes the match time with the corresponding analysis (Fuchs et al., 2018). This calculation was performed for each team to determine periods of strength and weakness throughout a match.
Formula (1) calculated the first forward moving average (MA), where n was the number of observed rallies, k was the length of the moving average meaning how many situations of possession were used, and Score(n) was the final result of possession n, so either 1 or 0 to indicated either scoring or not scoring, respectively.
Formula (2) was used to calculate the DMA shown here as a backward moving average of a series of forward moving averages. The double moving average calculation results in values between 0 and 1, with a value closer to 0 indicating a weak phase during a match, while a value closer to 1 determines a strong phase (Fuchs et al., 2018). The DMA can then be interpreted as the momentary scoring probability of the team with ball possession. As a match develops, the double moving average can reveal a team’s strong and weak phases, as well as the transitions between them, for the entire duration of the match. Additionally, it can also inform the momentary strength of each team and how it relates to their opponent, thus describing an important aspect of the interaction between the two teams.
Data Acquisition and Observer Agreement
The observers recorded the data into a predetermined table using Excel (Microsoft Office). Observer agreement was controlled by two independent observers analyzing a randomly chosen half of a match. A two-step procedure was conducted: first, the identification of situations of ball possession (the observational unit) was checked for agreement. Second, agreement was determined for the outcome of each ball possession (goal/no goal). The agreement in the first step (agreement in identifying the observational unit) was controlled with AC1 as Cohen’s Kappa cannot handle asymmetric marginal distributions of agreement data (Gwet, 2012) which are typically found in agreement matrices judging the occurrences of observational units (in our case: Cohen's Kappa = 0.000). There were 49 situations of ball possession identified by both observers, but one observer registered 4 more such situations (percent agreement: 92.5%; AC1: 0.919). The reason for the 4 additional ball possessions was related to short losses and recoveries of ball possession in the same play. As one might expect, there was no problem in recording the levels of goal/no goal of ball possession. There was a 100% agreement (Cohen’s Kappa: 1.000).
The values of momentary strength were divided into 10 bins of 0.1 ranging from 0 to 1 (i.e., bin1 from 0 to 0.1, bin2 from >0.1 to 0.2 and so on). The frequencies of these values were counted and used for comparison between teams.
Statistical Analysis
Descriptive statistics of a team’s momentary strength were calculated using the mean, minimum, maximum, 25-, 50- and 75-percentiles and interquartile intervals. Spearman’s rank correlations were calculated to determine the relationship between the teams’ final ranking at the tournament and their mean DMA. Normality of the data was checked using the Kolmogorov– Smirnov test (p < 0.05). Subsequently, the Wilcoxon test for non-parametric dependent samples (p < 0.05) was used to compare the DMA values between the winners and losers of each game during the tournament. The Kruskal-Wallis test was performed to compare the distribution of momentary strength (across the 10 bins) between the higher and lower ranked teams. Analyses were conducted using SPSS 26.0 (Statistical Package for the Social Sciences, SPSS Inc).
Results
Table 1 presents descriptive statistics for the 24 teams with their final ranking from the 2019 World Handball Championship and the values of momentary strength (DMA) represented as a mean, standard deviation, minimum, maximum, median, percentiles and the interquartile interval. The Kolmogorov-Smirnov test indicated that the values of momentary strength had non-normal distribution, D (9036) = 0.072, p < 0.005.
Table 1
Descriptive statistics of the 24 countries which participated in the 2019 World Championship, with their respective final ranking, mean, standard deviation, minimum, maximum, median, percentiles, interquartile interval and the number of matches played in the championship
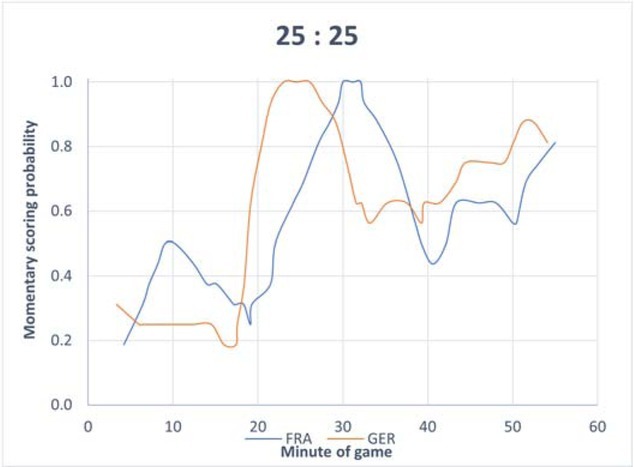
Plotting the course of the DMA for both teams over time did not only reveal the phases of strength and weakness for each team, but also the relationship between the two DMAs over time, which was our operational definition of the interaction between the teams. An example of this interaction is shown in Figure 1 during the match between Germany and France that ended in a tie (25–25). It is possible to observe changes during the match using momentary strength to represent important aspects of the dynamic interaction process between the two teams. There were phases where each consecutive ball possession led to a goal (momentum equal to 1), but also periods with momentary scoring probabilities lower than 0.20. In some phases, it could be qualitatively noted that the two teams performed at almost the same level throughout the entire match, with France shadowing Germany.
Figure 1
Example of the momentary strengths of both teams during the match between Germany and France, 25 x 25. Note that there are no DMA values for the first and last 3 situations of ball possessions for either team, because the averaging window is of length 4.
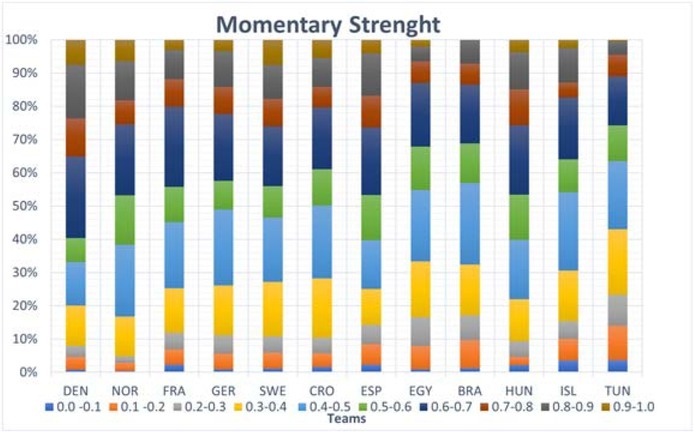
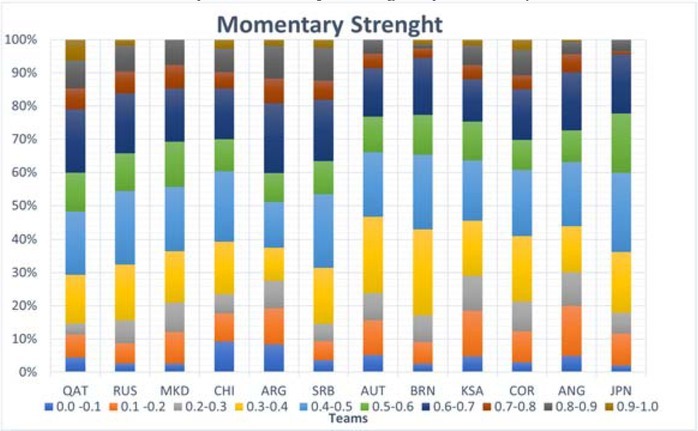
The distributions of momentary strength are shown in Figures 2 and 3 for the top 12 and bottom 12 ranked teams, respectively. The momentum strength distribution was divided into 10 bins, with values between 0 to 1 in 0.1 intervals, for better visualization of the momentum values throughout the match. Nearly all 24 teams had strong phases with momentary strength values > 0.9 (4 exceptions) and weak phases with momentary strength values < 0.1 (0 exceptions), suggesting that the dynamic interaction between teams leads to large variations in momentary strength across all bins, despite the team’s final ranking. The Kruskal-Wallis test showed that between the top and bottom 12 teams, there was no significant difference in bins 3 (H = 1.029 p = 0.310) and 4 (H = 0.271 p = 0.603); a significant difference (p < 0.05) was reported for all other bins.
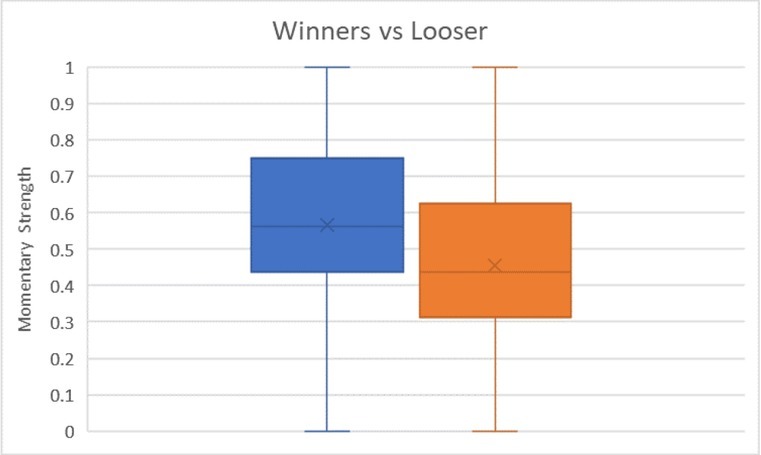
Regarding the comparison of winners and losers, a Wilcoxon test for dependent samples was performed to compare the mean momentum values between the winners and losers of every game during the tournament. The results show a significant difference (Z = -2.818, p < 0.005) between winners (mean DMA = 0.566, Rank = 4576.20) and losers (mean DMA = 0.455, Rank = 4293.06), with a small effect size of 0.029. In Figure 4, a boxplot shows the difference between winners and losers for the values of momentum.
Figure 4
Boxplot of the momentary strengths of all teams in the 96 matches played divided by winners (blue) and losers (orange). The line inside the box represents the median value and the X is the mean value.
The Spearman correlation between the teams’ final ranking and their median momentum was -0.830 (p < 0.01), indicating that momentum values increased as the teams’ rankings increased.
Discussion
The momentum analysis of within-match performance dynamics of handball teams was based on the 96 matches of the 2019 World Men’s Handball Championship, thus representing the actual state of international handball.
The combination of a forward and a backward moving average produced a double moving average (DMA) that calculated a weighted average of the outcomes of all situations of ball possession in a handball match. The decision to use a length of 4 for the averaging window was a compromise between smoothing and sensitivity to change, as was reported by Fuchs et al. (2018).
The momentary strengths presented in this study show that teams with higher DMA values were ranked higher at the end of the tournament, and a significant difference was observed between winners and losers (Ferrari et al., 2018). An interesting observation was that nearly each team showed values of momentary strength in all of the 10 bins from ≤ 0.1 to > 0.9 (four exceptions with no values higher than 0.9). This demonstrates that drastic changes in the values of momentary strength are inherent in handball, and teams are likely to face both weak and strong phases during a match. From a practical point of view, this may be interpreted in a way that it is not possible to avoid weak phases in a match, as even the strongest teams are susceptible to weak phases. Rather, it is advisable for practice to focus on their team’s ability to recover from weak phases, either by applying a consistent playing style even during weak phases or by including psychological training to improve traits like resilience.
In practical performance analysis, the evaluation of the momentary strength of a team can be a helpful tool for coaches and team staff to identify the phases of weakness and strength both during and after a match. Of outstanding interest for practice, though, are the reasons for either successful or unsuccessful phases that may be found for example in momentary player configuration or momentary tactics. These reasons may only be assessed by deep inspection, typically video-based and driven by principles of qualitative game analysis (Lames and Hansen, 2001).
From a theoretical perspective, the results of this study demonstrate how performance analysts can assess within-match dynamics of handball, which could also be transferred to other team game sports. As shown in our findings, teams experience both successful and unsuccessful phases, which could influence the interpretation of typical performance indicators in handball, for example a player’s conversion rate or a goalkeeper’s saving rate (Bilge, 2012; Ferrari et al., 2019). However, the representation of tactical behaviors using a single summative value cannot fully reflect the dynamics of an entire match, since the reality could be substantially higher or lower at different time points. Thus, the inclusion of momentary strength analysis to the performance analysis of handball could have consequences for the interpretation of performance indicators which aim to describe match behavior as a single static variable.
Additionally, there are other methods in performance analysis which attempt to evaluate the success of a team, such as the temporal analysis (Borrie et al., 2002; Noldus, 1999). This temporal pattern approach provides information about repetitive behavior patterns, which is different from momentary strength. None of these methods is related to the psychological momentum of the team, which is a term used in sport psychology that captures not only success rates, but also aspects related to cognition and behavior (Jones and Harwood, 2008; Perreault et al., 1998; Taylor and Demick, 1994).
Specifically in handball, Mortimer and Burt (2014) showed that momentum exists through a relationship between the peak level of momentum that a team generates and the probability of a particular match outcome, suggesting that the higher the level of momentum, the more likely they are to win the match. Likewise, the momentary strength presented in our study shows that teams with higher DMA values were ranked higher at the end of the tournament, even though they experienced both weak and strong phases of momentary strength.
Conclusions
The results found in this study provide a useful, theoretical and practical tool for handball. From the theoretical perspective, better insight into the dynamic interactions between teams can be obtained. From the practical perspective, the identification of strong and weak phases in the game is interesting for game analysis, especially as a starting point for in-depth qualitative analyses. Momentary strength can also be used during live matches to provide real-time information about the interactions between two teams, which could be valuable to sports broadcasting.
While this study focuses on handball, the approach to momentary strength can also be applied to other invasion games like basketball, or even net games like badminton and squash. The main limitations of the proposed method can be mitigated by specifying clear operational definitions and by using game footage which includes all of the necessary information about the situations of ball possession of both teams.