Introduction
The test of single-breath carbon monoxide diffusing capacity is one of the most valuable clinical tests for pulmonary function and is among the most widely used tests of pulmonary gas exchange. DLCO has been assessed in athletes (Galy et al., 2013), non-athletes (Baldi et al., 2014) and sick subjects (Kaminsky et al., 2007). A significant increase in pulmonary diffusing capacity (DLCO) has been observed during exercise (Baldi et al., 2014; Tedjasaputra et al., 2016). Other authors have reported a decrease in DLCO during the recovery period after laboratory trials (Galy et al., 2003; McKenzie et al., 2005; Taylor et al., 2014) and field events (Caillaud et al., 1995; Manier et al., 1991). This decrease varies according to several factors, particularly exercise duration and intensity (Johns et al., 2004; Manier et al., 1999), exercise modality (Hue et al., 1999), and training volume (Galy et al., 2013). Decreases between 9 and 15% have been observed after short and maximal exercise (Galy et al., 2013; McKenzie et al., 2005; Rasmussen et al., 1992), with the return to baseline values noted 2 hours (Rasmussen et al., 1992) and 24 hours (Sheel et al., 1998) post-exercise. In contrast, a decrease in DLCO after long and submaximal exercise was found to be between 10 and 12% (Manier et al., 1991; Miles et al., 1983), with the decrease remaining one day later (Miles et al., 1983).
The pathophysiological mechanisms of the post-exercise decrease in DLCO and DLCO/VA are the following: (1) pulmonary interstitial oedema and/or alveolar oedema (Zavorsky et al., 2014a, 2014b), (2) reduced pulmonary capillary blood volume (Vc) and membrane diffusion capacity (Dm) (Johns et al., 2004; Taylor et al., 2014), and (3) alterations in the blood-gas barrier (Zavorsky, 2007) and the increased permeability of the lungs to proteins and red blood cells into the interstitial space (Hopkins et al., 1997; Zavorsky et al., 2014a). Hanel et al. (2003) suggested two physiological mechanisms to explain this increased permeability after exercise in highly trained athletes: (1) increased tidal volumes and (2) elevated pulmonary arterial pressures. The same authors (Hanel et al., 2003) had athletes perform a 6-min all-out maximal rowing exercise. They then analysed the integrity of the alveolar epithelial membrane using the clearance rate of aerosolized 99mTc-DTPA acid as an index of the permeability of the lung blood-gas barrier of those athletes and concluded that the blood-gas barrier showed structural and functional alterations due to mechanical stress. Likewise, Hopkins et al. (1998a) found no blood-gas barrier alterations after sustained submaximal exercise consisting of 1 h of cycling at 75-80% of maximal oxygen uptake
Indeed, the Olympic distance triathlon consists of three successive events (i.e. swim, cycle and run) performed at high intensity, thereby generating cumulative effects. The effects particularly concern the cardiovascular system, the risk of injury (Sellés-Pérez et al., 2019) and thermal adjustments, which are not usually experienced in a single sport (Taylor et al., 2014). High blood lactate concentrations and a significantly higher heart rate (HR) have been reported during the three segments of the triathlon (Lopes et al., 2012), in contrast to the low blood lactate concentrations of a marathon (Chevrolet et al., 1993). Moreover, it has been assumed that cycling generates elevated capillary pulmonary pressure in relation to the respiratory pattern and the crouched position (Boussana et al., 2001; Galy et al., 2003). This high capillary pulmonary pressure may induce mechanical stress and alterations in the blood-gas barrier. Interestingly, Galy et al. (2003) and Hue et al. (1999) reported that DLCO was significantly reduced after 5 km of running preceded by 30 min of cycling, and a greater decrease was reported after 20 min of cycling preceded by 20 min of running, but not after 5 km of running preceded by 30 min of running. These observations suggested that the triathlon, which is certainly a single sport but composed of three combined disciplines, might thus exacerbate DLCO concomitant with changes in pulmonary function (Boussana et al., 2001) compared with a marathon.
The Olympic distance triathlon includes bouts of maximal intensity exercise, which may result in blood-gas barrier alterations. The aim of this study was to assess its effects on DLCO at the end of the race and 24 hours into recovery. We thus hypothesized that the Olympic distance triathlon would induce a greater decrease in DLCO that would not return to the baseline level 24 hours after the race.
Methods
Participants
Nine competitive male triathletes participated in this study (age: 24.25 ± 4.74 years, body height: 173.44 ± 6.11 cm, body mass: 63.08 ± 6.43 kg, oxygen uptake: 68.71 ± 1.70 ml∙kg-1∙min-1) (Table 1). The inclusion criteria were as follows: (1) to be an officially licensed triathlete with at least 2 years of experience, (2) to be part of a university training centre for triathletes of the University of Montpellier, and (3) to have a national and/or international sports level. All participants had normal pulmonary function and no known history of pulmonary or cardiovascular disease. They had been competing in the triathlon for 5.0 ± 2.3 years and were in the competitive period at the time of the study. They all trained regularly 16 h ± 2 h per week. Selected physical variables, training characteristics, finishing times and ranks in the present Olympic distance triathlon are provided in Table 1. All triathletes gave informed written consent before participating in the study, which was approved by the local laboratory ethics committee and in accordance with the requirements of the Declaration of Helsinki for human subjects.
Table 1
Selected physical and training characteristics, international short-distance triathlon performance, and rank of the nine male triathletes.
Training distances were averaged weekly during the study period.
Experimental design
All participants performed an incremental cycle test before entering a three-phase protocol which took place before the Olympic distance triathlon (1.5-km swim, 40-km bike, 10-km run), at the end of the race, and 24 hours later. The incremental cycle test was performed on an electromagnetic cycle ergometer (Monark 864, Monark-Crescent AB, Varburg, Sweden). After a 3-min warm-up at 30 W, the power was increased by 30 W every minute until the participant reached volitional fatigue. Maximal oxygen uptake
Instrumentation and data collection
Pulmonary diffusing capacity (DLCO)
DLCO (ml∙min-1∙mmHg-1) was evaluated during breath-holding using an automated transfer apparatus (Transfer Test, Morgan, Chathan, Kent, UK). VA was measured and DLCO/VA was simultaneously calculated. Participants performed the breath-holding operation in the sitting position. After a full exhalation, they inhaled a gas mixture (10% He, 21% O2, and 2,800 ppm CO, in N2), held their breath for 9 s, and finally executed a rapid exhalation to their residual volume. The predicted values were those of Cotes et al. (1993).
Spirometric measurements
Spirometric tests (Pulmonet III Gould, sensorMedics, the Netherlands) provided measures of forced vital capacity (FVC, l), forced expiratory volume in 1 s (FEV1, l.s-1), FEV1/FVC (%), the mean forced expiratory flow during the middle half of FVC (FEF25-75%, l.s-1), forced expiratory flow rates at 75, 50 and 25% of FVC (FEF75%, FEF50%, FEF25%, respectively, l.s-1), total lung capacity (TLC, l), and residual volume (RV, l). Lung volumes and expiratory flows were compared with the reference values of the American Thoracic Society (ATS, 1986) to ensure that triathletes had values within the normal range.
Statistical analysis
All values are expressed as mean ± standard deviations (SD). The data were assessed with the Shapiro-Wilk test and were found to be normally distributed. The predicted DLCO and DLCO/VA values of Cotes et al. (1993) were compared to the measured DLCO and DLCO/VA values using the comparison tests for theoretical and observed percentages. DLCO, DLCO/VA and spirometric variables were compared pre-T, post-T, and post-T-24 h using a one-way analysis of variance (ANOVA) with repeated measures. When significant results were obtained with ANOVA, the Scheffé’s post-hoc test was carried out. A priori sample size was determined by G * Power software version 3.1.9.2 (Faul et al., 2007), which links the statistical power of the test and the size of the sample. For this purpose, the software used a repeated measure ANOVA, with the effect size set to 0.75, the error probability α = 0.05 and a statistical power 1-β = 0.80. Therefore, the software displayed the value of the non-centrality parameter δ = 2.250, the critical value of t = 1.39682, the degree of freedom d = 8, and the estimated sample size n = 9, with a statistical power of 0.801. All data were analysed using IBM SPSS Statistics 23 for Windows (Surrey, UK). Statistical significance was accepted at the p < 0.05 level.
Results
DLCO
The measured DLCO and the DLCO/VA at pre-T, post-T and post-T-24 h met the ATS (1986) criteria for the absence of DLCO impairment, namely DLCO <80% of the reference values (Cotes et al., 1993). These predicted reference values ranged from 70.4 to 144.0% for DLCO and 74.7 to 176.0% for DLCO/VA. The measures predicted values in our athletes were not significantly different when compared with those of Cotes et al. (1993), with DLCO pre-T: 94.77 ± 7.08%, post-T: 87.55 ± 5.59%, and post-T-24 h: 92.22 ± 9.92%; and DLCO/VA pre-T: 97.44 ± 5.57%, and post-T: 92.55 ± 4.53% and post-T-24 h: 96.22 ± 6.28% (Table 2).
Table 2
Percentage of predicted values in pulmonary diffusing capacity of carbon monoxide (%DLCO) and % DLCO/VA and spirometric values observed at baseline (pre-T), after the triathlon (post-T) and 24 hours later (post-T-24 h).
Values are expressed as mean ± SEM.
[i] Abbreviations: Pre-T: before triathlon, Post-T: after the triathlon, Post-T-24 h: 24 hours after the triathlon, FVC: forced vital capacity, FEV1: forced expiratory volume in the first second, FEV1/FVC: ratio of FEV1 to FVC, RV: residual volume, TLC: total lung capacity, FEF25-75%: mean forced expiratory flow during the middle half of FVC, FEF50%: forced expiratory flow rate at 50% of FVC,
* significant difference, post-T vs. pre-T (p < 0.05), † significant difference pre-T vs. post-T-24 h.
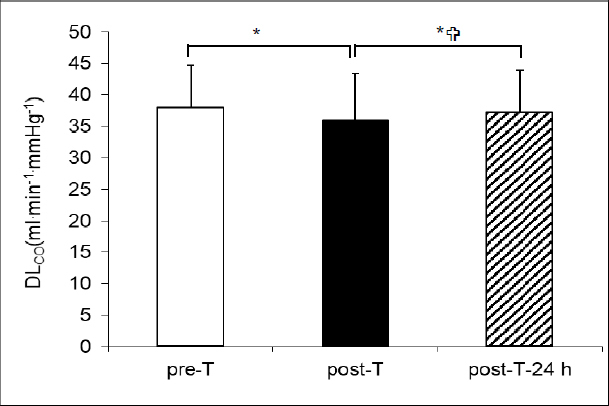
DLCO values showed a significant decrease between pre-T and post-T: 38.52 ± 5.44 vs. 35.92 ± 6.63 ml∙min-1∙mmHg-1 (p < 0.01), corresponding to a 6.7% decrease. DLCO then showed a significant increase between post-T and post-T-24 h: 35.92 ± 6.63 vs. 37.24 ± 6.76 ml∙min-1∙mmHg-1. In contrast, DLCO values for pre-T and post-T-24 h showed no significant difference: 38.52 ± 5.44 vs. 37.24 ± 6.76 ml∙min-1∙mmHg-1 (Figure 1A).
Figure 1A
Pulmonary diffusing capacity of carbon monoxide (DLCO) observed at baseline ( pre-T), after the triathlon  post-T) and 24 hours after the triathlon
  post-T- 24 h). * significant difference pre-T vs. post-T (*) (p < 0.01), *
 significant difference post-T vs. post-T-24 h (p < 0.01).
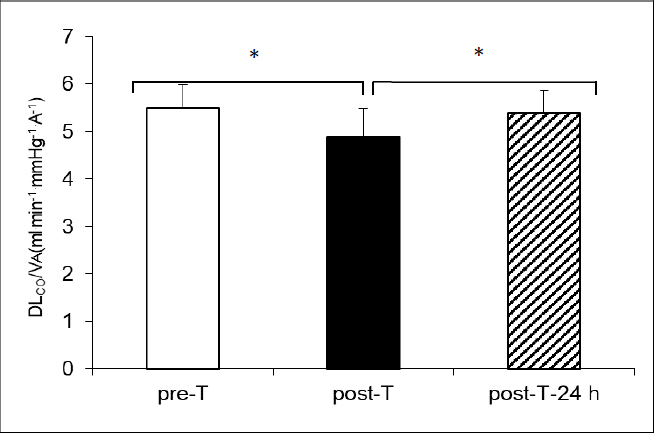
DLCO/VA values at pre-T (5.49 ± 0.49 ml∙min-1∙mmHg-1∙A-1), post-T (4.89 ± 0.59 ml∙min-1∙mmHg-1∙A-1), and post-T-24 h (5.38 ± 0.49 ml∙min-1∙mmHg-1∙A-1) were statistically similar to the pre-T, post-T, post-T-24 h DLCO values (p < 0.01) (Figure 1B).
Figure 1B
Pulmonary diffusing capacity of carbon monoxide to alveolar volume (DLCO/VA), observed at baseline ( pre-T), after the triathlon ( post-T) and 24 hours after the triathlon
  post-T- 24 h). * significant difference between pre-T vs. post-T (p < 0.01),
  significant difference between post-T vs. post-T-24 h (p < 0.01).
Spirometry
The predicted values of spirometric variables of triathletes at baseline: FVC (105.41 ± 11.92 %), FEV1 (103.88 ± 11.12 %), and TLC (106.58 ± 11.0 %), were greater than 80% of the predictive reference values of the ATS (1986) (Table 2).
Comparisons showed a significant decrease in FEV1 between pre-T and post-T (5.11 ± 0.47 l.s-1 vs. 3.96 ± 0.61 l.s-1) and between pre-T and post-T-24 h (5.11 ± 0.47 l.s-1 vs. 4.10 ± 0.62 l.s-1, p < 0.02). A significant decrease was also found in FEF25-75% between pre-T and post-T (6.09 ± 0.52 l.s-1 vs. 4.08 ± 0.41 l.s-1) and between pre-T and post-T-24 h (6.09 ± 0.52 l.s-1 vs. 4.75 ± 0.51 l.s-1, p < 0.02). No significant difference was found between pre-, post- and post-T-24 h in TLC (7.55 ± 1.38 l vs. 7.22 ± 0.90 l and 7.17 ± 1.33 l). A significant increase was found between pre- and post-T in RV (1.90 ± 0.51 l vs. 2.56 ± 0.41 l, p < 0.02), but no significant difference was found between pre- and post-T-24 h (Table 2).
Discussion
The main result of this study was the decrease in DLCO and DLCO/VA after an Olympic distance triathlon, as reported in previous studies. These decreases suggest interstitial oedema and/or an alteration in the alveolar-capillary membrane. In addition, DLCO returned to normal 24 hours after the race, indicating that the alteration was transient.
The lack of difference between the measured DLCO values and the reference values from the ATS (1986) and Cotes et al. (1993) (namely, measured DLCO > 80% of the reference values) indicated that DLCO of triathletes was always within the baseline physiological range. This was reinforced by the lack of significant difference between the resting predicted DLCO and the DLCO/VA values according to Cotes et al. (1993) and the measured pre-T, post-T and post-T-24 h values (Table 2).
The 6% DLCO and 10% DLCO/VA decrease (Figure 1A, Figure 1B) after an Olympic distance triathlon as observed in the present study confirmed the results of previous studies which reported 5% and 9-15% DLCO decreases after the same race (Caillaud et al., 1995) and after a cycle-run succession under laboratory conditions (Galy et al., 2013). According to the literature, DLCO is more reduced after high-intensity exercise than after long-duration exercise such as the marathon. We hypothesized that the Olympic distance triathlon, which includes bouts of maximal intensity exercise, would lead to greater decreases in DLCO. However, the decreases in DLCO observed in our triathletes after a race lasting 2 hours were lower than those reported after a marathon lasting 3 hours (Manier et al., 1991; Miles et al., 1983). This observation suggests that the marathon induces a greater decrease in DLCO than the triathlon. If so, it should not be surprising that DLCO decreased sharply after exercise in our athletes (Manier et al., 1999). Interestingly, McKenzie et al. (2005) observed a 12% decrease in DLCO (p < 0.001) in trained cyclists after intense and prolonged exercise of 45 minutes. Based on these considerations, we are convinced that the exercise performed in the present study was of sufficient duration to induce a significant drop in DLCO suggesting interstitial pulmonary oedema (Manier et al., 1999; Zavorsky et al., 2014b). The second factor involved in the decrease in DLCO with exercise is the intensity of the exercise, corresponding to the workload (Manier et al., 1999; Zavorsky, 2007). The Olympic triathlon is made up of three events with maximum intensity approaching 85% of the maximum heart rate (Lopes et al., 2012). Was the intensity in our study insufficient to induce physiological stress and thereby cause a greater significant drop in DLCO and an increase in permeability of the alveolar-capillary membrane? Several studies have reported marked significant decreases in DLCO after a high-intensity cycle test to exhaustion (Rasmussen et al., 1992) and after maximal arm cranking, treadmill running and ergometer rowing exercises (Sheel et al., 1998). Under these exercise conditions, the decrease in DLCO was mainly attributed to interstitial oedema concomitant with a decrease in Vc (Mckenzie et al., 2005; Zavorsky et al., 2006, 2014a). Despite the high intensity of the triathlon, the results from Caillaud et al. (1995) and the present study appear consistent with the assumption of a similar or smaller DLCO decrease after a triathlon than after a marathon. Another factor which may explain the discrepancy between our results and those of previous studies (Manier et al., 1991; Miles et al., 1983) is that the delay between the end of the competition and the measurement of DLCO may have influenced our results. It is likely that any DLCO measurement and DLCO/VA calculation made immediately after exercise will be significantly increased only due to the exercise-induced increase in cardiac output, Vc and HR, thus potentially masking any post-exercise reduction in DLCO induced by pulmonary interstitial oedema (Caillaud et al., 1995; Zavorsky et al., 2006). We evaluated DLCO and DLCO/VA 2 hours after the triathlon in order to allow the pulmonary blood flow, Vc and HR to return to rest values. Previous studies have shown that the DLCO decrease and pulmonary oedema remain for up to 15 min, 60 min and 1 h 13 min after exercise in trained men (Manier et al. al., 1991; McKenzie et al., 2005; Taylor et al., 2014). Conversely, Zavorsky et al. (2006) found mild interstitial oedema, but no significant drop in DLCO 98 min after the end of a marathon. Thus, it is possible that the decrease in DLCO was the result of the time elapsed between the end of the race and the DLCO assessment.
The smaller % DLCO decrease observed after the Olympic distance triathlon versus short and maximal exercise indicates that this race has DLCO effects similar to those of conventional submaximal exercise. It further suggests that the three successive events of the triathlon and maximal intensity bouts experienced during the swim-cycle and cycle-run transitions reported in the literature (Hue et al., 1999; Sellés-Pérez et al., 2019) have mild deleterious effects on the alveolar-capillary membrane and blood-gas barrier integrity.
DLCO of triathletes was normal 24 hours after the triathlon. This result is similar to the findings of Badi et al. (2014) and Rasmussen et al. (1992) and contrasts with the persistent DLCO decrease observed 24 hours after a marathon by Miles et al. (1983). One of the limitations of this study concerns the lack of evaluation of Vc and Dm. However, we can assume that the VC and Dm alterations experienced during the triathlon and the recovery period were normalized 24 hours later. But what about the potential alterations in membrane diffusion capacity, which depend on functional and/or structural alterations in the blood-gas barrier? Post-exercise functional alterations in the blood-gas barrier have been reported by numerous authors. Caillaud et al. (1995) performed computerized tomographies of the thorax after a short-distance triathlon and showed an increase in pulmonary extravascular fluid. Zavorsky et al. (2014a) obtained posterior/anterior (PA) chest radiographs and concluded that one of the potential causes of post-marathon interstitial oedema initially appeared to be high pulmonary pressure. It is likely that 24 hours after the triathlon, functional alterations in the blood-gas barrier were normalized due to a decrease in VC and lung capillary pressure and the fluid shift from the thorax to the peripheral vascular space. Another limitation of the study is the small sample size, as it included nine participants for a statistical power = 0.80. The results of our study are thus consistent, but would require a larger number of subjects. The DLCO tests 24 hours after the competition were performed with the addition of a triangular effort to measure oxygen uptake for all subjects over a day from 10 am to 4 pm. This dispersion might have led to a form of imprecision in the time limit of the DLCO measure compared to the end of the competition.
On the other hand, our data showed a decrease in pulmonary flows (FEV1 and FEF25-75%) 24 hours post-triathlon (Table 2). The result noted for FEV1 agrees with previous data collected after an endurance triathlon and a marathon (Zavorsky et al., 2014b) and suggests bronchoconstriction (i.e. reduced small airway calibre at low lung volume and peripheral airway constriction) persisting 24 hours after the race, similar to that observed in exercise-induced asthma.
To date, no study has focused on the time needed to repair the structural alterations in the blood-gas barrier following a maximal intensity exercise, as reported by Hopkins et al. (1997), or a marathon (Zavorsky et al., 2006, 2014a). Although the Olympic distance triathlon provoked structural blood-gas barrier alterations, the normal DLCO values noted 24 hours post-race suggested that: (1) these structural alterations were small enough to be normalized during the 24-hour recovery period, and (2) mild structural alterations remained 24 hours post-triathlon, but had no effect on the resting membrane diffusion capacity and did not affect performance.
Implications
Normal baseline DLCO at 24 hours post-race does not mean that phenomena like mild blood-gas barrier alterations or interstitial oedema did not remain. It would be interesting to measure DLCO during the triathlon and 24 hours later, in addition to the measurement at rest. Measuring DLCO under these conditions and evaluating the underlying phenomena is very important to investigations into the alterations which may be caused by exercise. Such monitoring would make it possible to assess the pulmonary function and interstitial oedema of triathletes and the corollary regarding their long-term health.
Conclusions
In conclusion, the present study showed reductions in DLCO and DLCO/VA after an Olympic distance triathlon, suggesting pulmonary interstitial oedema. The normal DLCO and DLCO/VA values observed 24 hours after the race suggest that mild and transient interstitial oedema occurred, although no radiological exams were performed and DLCO was not measured during the exercise. Nevertheless, these reversible phenomena require monitoring over time to ensure that they do not adversely affect the lung function and performance of triathletes.