Introduction
Sex differences in factors affecting ultraendurance performance have become a matter of debate of a growing number of studies (Temesi et al., 2015; Vest et al., 2018). Although there is no clear consensus, it seems that the performance gap between males and females is reduced in ultramarathons compared to shorter endurance events (Hoffman, 2008; Knechtle et al., 2016; Speechly et al., 1996). One of the reasons to explain this fact is that females usually adopt a better pacing strategy in ultraendurance events than males (Sandbakk et al., 2018).
Pacing can be defined as the pattern of power output or speed fluctuation during a competition (Abbiss and Laursen, 2008; Knechtle et al., 2019). An even-pacing pattern, maintaining a much constant submaximal exercise intensity throughout the race (Abbiss and Laursen, 2008), has been associated with best performances in flat ultramarathons (Bossi et al., 2017; Lambert et al., 2004; Renfree et al., 2016; Takayama et al., 2016; Tan et al., 2016). Yet, sustaining a consistent pace in a mountain ultramarathon (MUM) is rather challenging due to wide variations in slope and terrain conditions (Vernillo et al., 2017). Hoffman (2014) analyzed pacing of most successful runners of a 161-km MUM from 1985 through 2013 and confirmed that lower coefficients of variation (CV) in speed were associated with better performances. Similarly, Balducci et al. (2016) expressed the average race speed of each athlete as a percentage of their speed on the first race segment (i.e., initial 19.7 km) and found that this index was inversely correlated with finishing time in a 75-km MUM. However, using GPS-derived data, Kerherve et al. (2016) found no correlations between overall performance and variables of pacing in a 173-km MUM. In fact, the same authors reported an inverse relationship between finishing time and speed loss magnitude in a 106-km MUM (Kerherve et al., 2015). Nevertheless, no previous studies have focused on possible sex differences in pacing adopted during a MUM.
On the other hand, a recent review has shown that ultradistance events (i.e., Ironman triathlons) lead to a moderate state of dehydration (Sousa et al., 2019). However, little is known about how body weight (BW) changes across intermediate sections of ultramarathons. The steepest decrease in BW during a 24-h ultramarathon has been described to occur in the first four hours of the race (Kao et al., 2008). Similarly, Hoffman and Stuempfle (2014) showed that a greater BW loss in a 161-km MUM occurred at the initial 48 km. Moreover, in those studies finishing time was either uncorrelated (Hoffman and Stuempfle, 2014) or inversely correlated with the final BW loss (Kao et al., 2008). Unfortunately, those authors did not report whether serial BW changes were related to speed at the corresponding race segments. Meanwhile, Landman et al. (2012) measured BW at mid-race of a 160-km MUM and reported no relationship between BW loss and speed in this initial 80 km. No other study has assessed intracompetition BW changes during an ultramarathon and its relationship with pacing.
In light of the rising popularity of MUMs and considering the paucity of studies assessing pacing patterns based on relative speed (i.e., percentage of threshold speed obtained in a maximal incremental exercise test) and the objective quantification of sedentary time during the race (i.e., by means of accelerometry), the purpose of our study was three-fold. First, to contribute to existing literature regarding the assessment of possible relationships between pacing-related variables and performance in a MUM; second, we aimed to compare pacing adopted by males and females in a 107-km MUM; and third, we wanted to assess whether pacing-related variables were associated with body weight changes during the race. Our hypotheses were as follows: (1) despite contradictory results in previous studies (Balducci et al., 2016; Hoffman, 2008; Kerherve et al., 2015, 2016), lower variability in race speed might be associated with better finishing times; (2) females would be able to maintain a higher average speed relative to their threshold speed (Speechly et al., 1996); (3) females may show a more stable speed during the race (Sandbakk et al., 2018); (4) body weight loss during the race could be related to speed (Hoffman et al., 2013; Martinez-Navarro et al., 2018).
Methods
Participants
Forty seven recreational ultra-endurance athletes (29 males and 18 females; 41.13 ± 5.28 years) were recruited to participate in the study. Selected athletes were required to have previously completed at least one ultramarathon (>60 km). All participants were fully informed of the study procedures and gave their written consent to participate. They were also allowed to withdraw from the study at will. A questionnaire was used to collect demographic information as well as training and competition history (Martinez-Navarro et al., 2020). The investigation was conducted according to the Declaration of Helsinki and approval for the project was obtained from the research Ethics Committee of the University Jaume I of Castellon (Expedient Number CD/007/2019). This study was enrolled in the ClinicalTrails.gov database, with the code number NCT03990259 (www.clinicaltrials.gov).
Experimental design
This research was developed at the Penyagolosa Trails CSP race in 2019. The trail consisted of 107.4 km, starting at an altitude of 40 m and finishing at 1280 m above the sea level, with a total positive and negative elevation of 5604 and 4356 m, respectively. Temperature at the start was 17.2⍛C, and it ranged between 10.6 and 18.8⍛C at the midrace, and between 1.5 and 20.1⍛C in the finish line. Humidity at the start was 39%, and it ranged between 18 and 40% at the midrace, and between 29 and 54% in the finish line. Between 2 to 4 weeks prior to the race, participants were subjected to a cardiopulmonary exercise test (CPET). In addition, BW was measured within 1 h before the start of the race, at three midpoints (33, 66, and 84 km) and immediately after crossing the finishing line. Lastly, pacing was assessed through the analysis of absolute and relative running speed along with sedentary time measured by accelerometry throughout the race.
Cardiopulmonary exercise test
The CPET was performed on a treadmill (H/P/cosmos pulsar, H/P/cosmos sports & medical GmbH, Nussdorf-Traunstein, Germany). Participants were asked to attend the laboratory in a fasted state (>6 h) and maintain their habitual mixed macronutrient diet the day before the test. Vigorous exercise was not allowed for 48 h before and no training was permitted for 24 h before testing. Tests were performed under standard environmental conditions (room temperature between 20 and 22°C) within the same time frame (between 16 and 18 PM). Pulmonary VO2 and VCO2 were measured breath-by-breath using an automated online system (Oxycon Pro system, Jaeger, Würzburg, Germany). The gas analysis system was calibrated for ambient temperature and humidity, air flow and VO2 and VCO2 concentrations (with a 4.96% CO2 – 12.10% O2 gas mixture) before each testing session according to manufacturer instructions (Rietjens et al., 2001). After a four min warm up at 6 km.h-1, the CPET protocol started at 8 km.h-1 and speed was increased 1 km.h-1 every 2 min. When participants reached a respiratory exchange ratio (RER) > 1.0 increments of 1 km.h-1 were induced every minute until voluntary exhaustion. This CPET layout was employed to enable the calculation of fat oxidation rates as a part of another study. VO2max values were accepted when a plateau (an increase of <2ml/kg/min) or a decline in VO2 was reached despite increasing workloads and an RER above 1.15 was achieved. If this criterion was not met, VO2peak value was taken, defined as the highest VO2 measured over a 30 s period. First and second ventilatory thresholds (VT1 and VT2) were determined using Skinner and McLellan’s (1980) guidelines by two independent researchers.
Body weight measurements
BW measurements were made with calibrated electronic scales (Seca 813, Vogel and Halke; Hamburg, Germany) which were on firm surfaces. Prior to the event, the scales were examined for consistency. Following a previous study (Hoffman and Stuempfle, 2014), pre-race, in-race and post-race measurements were made with athletes wearing running gear and shoes, but other items such as waist packs and hydration vests were removed and nothing was permitted in the runner's hands.
Pacing analysis
The race was divided into four sections based on the three main aid stations established by the organizers (33rd km, 66th km and 84th km; 033 km, 33-66 km, 66-84 km and 84-107 km), partial times were obtained from race results (LiveTrail®, LiveTrail SARL, France) and flat-equivalent mean running speed was calculated according to the procedure established by Saugy et al. (2013). Absolute (SpeedABS) and relative values (i.e., the percentage of the velocity at VT2 reached at the CPET) (SpeedVT2) were retained for statistical analysis. Owing to the possible accumulation of long bouts of rest at the aid stations, thus affecting the race pace, flat-equivalent mean running speed was also computed excluding sedentary time at each race segment (SpeedNONSED). For that purpose, participants were equipped with a GENEActiv accelerometer (Activinsights, Ltd., Kimbolton, Cambridgeshire, United Kingdom) during the race and sedentary time (in min, SedTimeABS; and expressed as a percentage of total race time, SedTimeREL) was obtained according to the procedure described by Hernando et al. (2018). The index of Pacing (IP, race average speed divided by the average speed on the first 33 km) and the CV of speed along the four race segments were also considered (Balducci et al., 2016).
Statistical analysis
Statistical analyses were carried out using the Statistical Package for the Social Sciences software (IBM SPSS Statistics for Windows, version 22.0, IBM Corp., Armonk, NY). Baseline variables, BW loss and pacing-related variables (SpeedABS, SpeedVT2, SpeedNONSED, SedTimeABS, SedTimeREL, CV and IP) in males and females were compared using Student's t-tests. A two-factor repeated-measures ANOVA was conducted, with ‘Sex’ as a between-factor and ‘Race Section’ (1st, 2nd, 3rd and 4th race segment) as a within-factor, to assess the possible effect of both factors and their interaction on BW and pacing-related variables (SpeedABS, SpeedVT2, SpeedNONSED, SedTimeABS). For that purpose, BW values at the 1st, 2nd, 3rd and 4th race segment were expressed as a percentage of pre-race value for each participant. Whenever the Mauchly’s Sphericity test was violated, necessary technical corrections were performed using the Greenhouse-Geisser test; and for each ANOVA, if a significant main effect or interaction was identified, Bonferroni post-hoc comparisons were conducted. On the other hand, Pearson correlations were used: (1) to analyze possible relationships between BW and pacing-related variables (SpeedABS, SpeedVT2, SpeedNONSED, SedTimeABS) in the four race segments and the overall race; (2) to assess whether performance was associated with SedTimeABS, CV and IP.
The meaningfulness of the outcomes was estimated through the partial estimated effect size (η2 partial) for ANOVA and Cohen’s d effect size for pairwise comparisons. In the latter case, a Cohen’s d<0.5 was considered small; between 0.50.8, moderate; and greater than 0.8, large. Likewise, correlations >0.5 were considered strong, 0.3-0.5, moderate and <0.3, small. The level of significance was set at p-value <0.05 and data were presented as means and standard deviations (±SD).
Results
From the initial sample of 47 participants, 4 participants did not start the race due to injury and 32 athletes successfully completed the race, i.e., 19 males (59%) and 13 females (41%). The finishers/starters ratio for the participants of the present study (i.e. 74.4%) was similar to the ratio when all race participants were considered (73.8%), whereas the average finish time (21 h 23 min ± 3 h 28 min) was somewhat faster when all race participants were considered (20 h 24 min ± 3 h 11 min). Values of the CPET and training-related variables of finishers are displayed in Table 1. Males exhibited a higher BMI (23.59 ± 1.61 vs. 21.75 ± 2.04 kg/m2; p = 0.008; d = 1.05) and largely higher values of VO2peak (55.79 ± 4.47 vs. 51.53 ± 5.22 ml O2/kg/min; p = 0.019; d = 0.91), VMAX (16.89 ± 1.48 vs. 14.44 ± 1.35 km/h; p < 0.001; d = 1.75), VVT1 (11.77 ± 1.17 vs. 10.68 ± 0.97 km/h; p = 0.010; d = 1.01) and VVT2 (13.78 ± 1.21 vs. 12.51 ± 1.3 km/h; p = 0.008; d = 1.04). Conversely, any significant sex differences were identified neither in age nor in training-related variables, although weekly training volume was nearly significantly greater among males (76.21 ± 25.38 vs. 61.46 ± 13.26 km; p = 0.065; d = 0.70).
Table 1
CPET and training-related variables (mean ± SD)
[i] Abbreviations: BMI, Body Mass Index; VO2peak, peak oxygen uptake; Vpeak, peak speed reached at the Cardiopulmonary Exercise Test; VVT1, speed associated with the first ventilatory threshold in the Cardiopulmonary Exercise Test; VVT2, speed associated with the second ventilatory threshold in the Cardiopulmonary Exercise Test; Double sessions, percentage of participants who performed at least one weekly double training session in the previous 3 months; Strength training, percentage of participants who performed at least one weekly strength-training in the previous 3 months; Cycling cross-training, percentage of participants who performed cycling as endurance cross-training in the previous 3 months. * p < 0.05 ** p < 0.01
On the other hand, no significant sex differences were found in SPEEDABS (8.17 ± 1.66 vs. 7.38 ± 0.78 km/h; p = 0.122; d = 0.59) and SPEEDVT2 (59.01 ± 8.78 vs. 59.08 ± 4.25 %; p = 0.977; d = 0.01). Conversely, males developed a higher SPEEDNONSED (8.62 ± 1.51 vs. 7.57 ± 0.74 km/h; p = 0.028; d = 0.86) and their BW loss was greater (4.37 ± 1.77 vs. -3.01 ± 1.96%; p = 0.048; d = 0.77). The difference in SedTimeABS approached statistical significance (64.44 ± 48.20 vs. 36.38 ± 33.72 min; p = 0.082; d = 0.67) and the difference in SedTimeREL was indeed significant (4.72 ± 2.91 vs. 2.62 ± 2.14 %; p = 0.035; d = 0.83). On the contrary, no sex differences were observed in the IP (0.86 ± 0.09 vs. 0.87 ± 0.05; p = 0.765; d = 0.11) and CV (19.53 ± 5.50 vs. 19.69 ± 4.68; p = 0.930; d = 0.03).
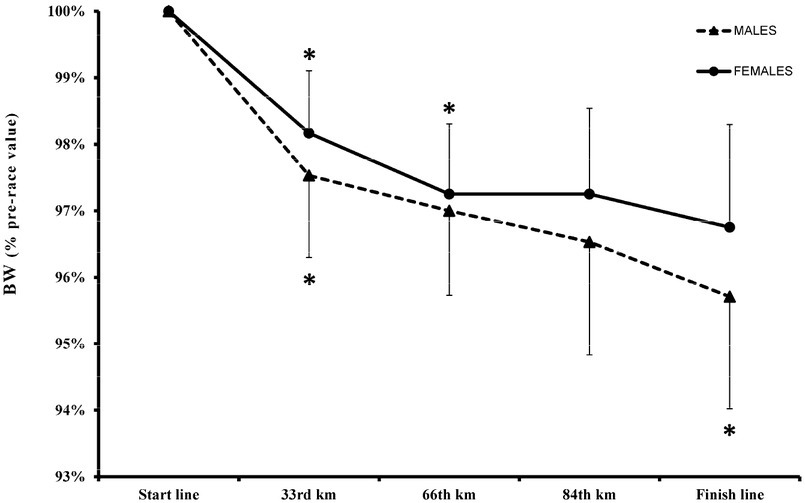
Univariate contrast analysis showed a significant effect for 'Race segment' on SpeedABS [F = 223.329; p < 0.01; η2 partial = 0.88], SpeedNONSED [F = 220.558; p < 0.01; η2 partial = 0.88], SpeedVT2 [F = 220.858; p < 0.01; η2 partial = 0.88], SedTimeABS [F = 15.443; p < 0.01; η2 partial = 0.35] and BW [F = 87.974; p < 0.01; η2 partial = 0.76]. On the other hand, ‘Sex’ factor significantly affected SpeedNONSED [F = 5.361; p = 0.028; η2 partial = 0.16] and their effect approached statistical significance on SedTimeABS [F = 3.243; p = 0.082; η2 partial = 0.10]. Meanwhile, 'Race segment x Sex’ interaction only significantly affected SedTimeABS [F = 2.901; p = 0.039; η2 partial = 0.09]. Bonferroni adjusted pairwise comparisons showed that males spent more SedTimeABS than females in the first (4.56 ± 2.97 vs. 1.46 ± 1.45 min; p = 0.002; d=1.29), second (31.67 ± 27.28 vs. 11.84 ± 10.71 min; p = 0.019; d = 0.92) and third segment (7.22 ± 6.07 vs. 2.31 ± 2.02; p = 0.009; d = 1.04) of the race (Figure 1). At the same time, males ran at a higher SpeedNONSED in the first (10.44 ± 1.62 vs. 9.27 ± 1.16 km/h; p = 0.034; d = 0.83), second (8.67 ± 1.48 vs. 7.63 ± 0.94 km/h; p = 0.034; d = 0.83), third (8.59 ± 1.62 vs. 7.54 ± 0.75 km/h; p = 0.040; d = 0.80), and fourth segment of the race (6.96 ± 1.51 vs. 6.01 ± 0.60 km/h; p = 0.039; d = 0.80) (Figure 2). Regarding SpeedABS, the difference between males and females only approached statistical significance in the first (10.22 ± 1.64 vs. 9.23 ± 1.15 km/h; p = 0.069; d = 0.70) and fourth segment of the race (6.54 ± 1.60 vs. 5.71 ± 0.75 km/h; p = 0.095; d = 0.64); whereas no sex differences were identified at any race section in SpeedVT2 (Figure 3) and BW (Figure 4).
Figure 1
Evolution of sedentary time
* Significantly different from the preceding race section (p < 0.05)
# Significantly different from females (p < 0.05)
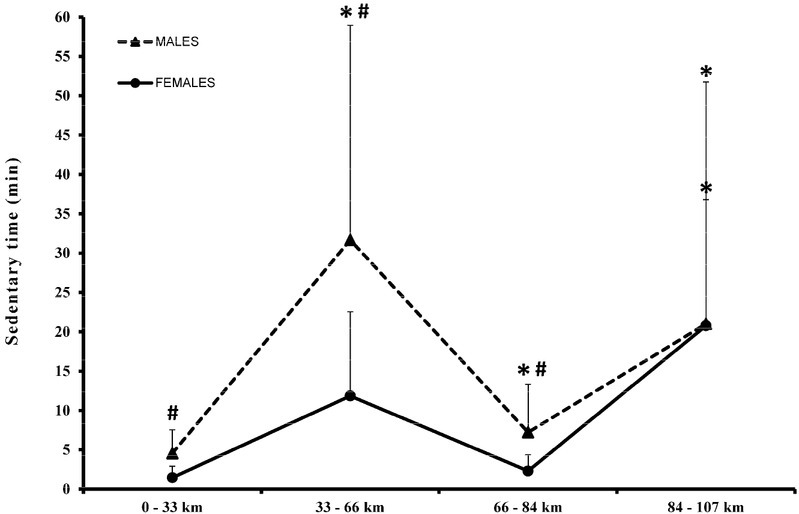
Figure 2
Evolution of race speed (excluding sedentary time)
* Significantly different from the preceding race section (p < 0.05)
# Significantly different from females (p < 0.05)
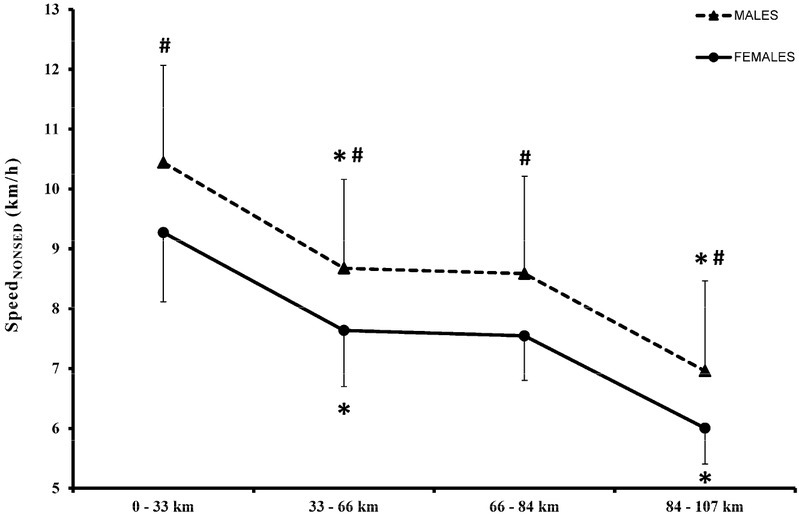
Figure 3
Evolution of relative speed
* Significantly different from the preceding race section (p < 0.05)
# Significantly different from females (p < 0.05)
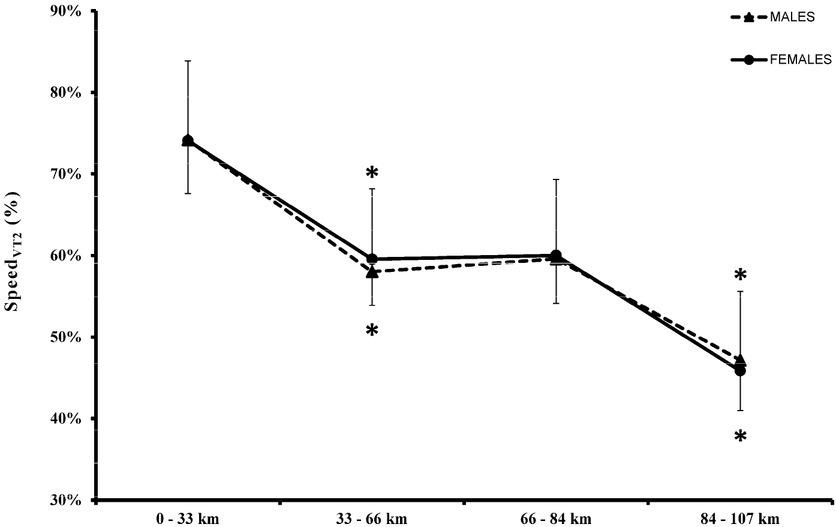
Figure 4
Evolution of body weight
* Significantly different from the preceding race section (p < 0.05)
# Significantly different from females (p < 0.05)
Results from the first subset of correlational analyses are presented in Table 2. BW significantly and moderately correlated in the first race segment with SPEEDABS (r = -0.43; p = 0.021), SPEEDVT2 (r = -0.46; p = 0.012) and SPEEDNONSED (r = -0.43; p = 0.020). Similarly, BW was significantly and moderately associated with SPEEDABS (r = - 0.46; p = 0.009), SPEEDVT2 (r = -0.50; p = 0.003) and SPEEDNONSED (r = -0.45; p = 0.010) in the fourth race section. However, no significant relationships were identified between BW and pacing-related variables in the second and third race segments. Considering the whole race, BW again correlated with SPEEDABS (r = -0.37; p = 0.034), SPEEDVT2 (r = - 0.35; p = 0.049) and SPEEDNONSED (r = -0.38; p = 0.034). Meanwhile, finishing time was associated with the CV (r = 0.45; p = 0.010), IP (r = -0.63; p < 0.001) and SedTimeABS (r = 0.64; p < 0.001).
Table 2
Correlation between BW and pacing-related variables
Discussion
The present study was aimed at comparing pacing adopted by males and females in a 107-km MUM and assessing whether pacing-related variables were associated with intracompetition BW changes and performance. Our results showed that lower variability in race speed and less sedentary time were related with better finishing times, and BW loss in the initial and final sections of the race was correlated with absolute and relative speed, thus confirming our first and fourth hypothesis. However, contrary to our expectations, females were not able to complete the MUM at a higher average speed relative to their threshold speed and no sex differences were found either in the pacing pattern adopted or among the speed variability indexes (IP and CV). Nevertheless, females took advantage of spending less sedentary time during the race than males.
Previous studies have displayed contrasting results regarding a possible relationship between speed variability and performance in the MUM, with some investigations demonstrating a positive association (Balducci et al., 2016; Hoffman, 2014), while others showing no correlation or even an inverse relationship (Kerherve et al., 2015, 2016). The correlation we found between the CV and IP with finishing time thus contribute to the existing literature and adds further evidence supporting the thesis that a more regular pacing pattern with a lesser difference in speed between the initial and the final stage of the race is related to better performance in MUMs, as it has been largely proved for flat ultramarathons (Bossi et al., 2017; Lambert et al., 2004; Renfree et al., 2016; Takayama et al., 2016; Tan et al., 2016).
On the other hand, the positive relationship between average SPEEDABS and SPEEDVT2 with BW loss confirmed the results of several previous studies on flat ultramarathons and MUMs (Hoffman et al., 2013; Kao et al., 2008; Martinez-Navarro et al., 2018). Indeed, it has been recently argued that BW losses between 1.9-5% seem advisable to sustain body water balance and maintain euhydration during ultramarathons lasting for approximately 25-30 h (Hoffman et al., 2018). In that line, Mueller et al. (2013) demonstrated that BW loss following an Ironman was due to a 28% loss in fat mass and a 72% loss in lean body mass, the latter being attributable to a loss of glycogen, as fuel for energy production, and the corresponding loss of body water. Therefore, considering the results from Mueller et al. (2013) and the positive correlations found between SPEEDABS and SPEEDVT2 with relative BW at those race segments where BW loss was greater (i.e., the first and the last section of the race, Figure 4), it seems that intracompetition BW loss during MUMs mainly reflect energy expenditure and it is indicative of superior performance (Landman et al., 2012; Martinez-Navarro et al., 2018; Mueller et al., 2013).
The absence of sex differences in the IP and CV, along with the similar pacing pattern adopted by males and females (Figure 2 and 3), suggest that females did not take advantage of performing a more even pacing strategy during the race. Neither females ran at a higher SpeedVT2 than males. This disagrees with the study of Speechly et al. (1996), in which female runners were able to sustain a greater fraction of their VO2max during a marathon and a 90-km race compared to their male counterparts. Further studies are warranted to ascertain why the performance gap between males and females is reduced in MUMs compared to shorter endurance events. Regarding sex differences in pacing, Renfree et al. (2016) reported that females showed less speed variability than males during a 100-km race. Likewise, it was consistently demonstrated that females maintained a more regular pace in road marathons, even when controlling for training experience and the performance level (Deaner et al., 2015). Conversely, Bossi et al. (2017) revealed no sex differences in the pacing pattern adopted in a 24-h running race. Therefore, it could be that the longer and the more uneven the race is (i.e., 24-h vs. 100-km and MUMs vs. flat ultramarathons), the lesser the sex differences in the pacing pattern adopted.
Our results also showed that females spent less sedentary time during the MUM than males (Figure 1). At the same time, the amount of sedentary time correlated with finishing time. Hence, despite the absence of sex differences in classic pacing-related variables, our results suggest that females probably benefited from stopping less time at aid stations, and this could be also considered to constitute a better pacing strategy. In fact, SpeedABS was not significantly different between male and female runners, whereas SpeedNONSED was. Besides, males reached significantly larger values of VO2peak, VMAX, VVT1 and VVT2 at the CPET, while the difference in finishing times was not significant. In former studies, total time stopped (measured with a GPS) was found to be inversely correlated with performance in a 106-km MUM (Kerherve et al., 2015), although not in a 173-km MUM (Kerherve et al., 2016). Then, we could assume that reducing time at aid stations is of greater importance in MUMs of about 100-km length, but not so much in longer races. Meanwhile, Knechtle et al. (2019) reported that females spent less time than males on Ironman transitions. Nonetheless, transition times in Ironman events usually represent about 1% of the total race time (Knechtle et al., 2019), whereas in our race sedentary time was 3.85 ± 2.85% of the total race time.
In summary, spending less time at aid stations seems to constitute a good pacing strategy in MUMs of about 100-km length. At the same time, we reinforced the notion that smaller speed variability in MUMs was associated with better performance, as this has been largely proved for flat ultramarathons. Lastly, our results suggest that BW changes during ultraendurance events should be analyzed in conjunction with running speed fluctuations. Thus, greater BW losses could be expected among faster runners and during the faster sections of those races. Notwithstanding, there are some limitations in our study which should be acknowledged. We failed to record fluid and food ingested by runners at the aid stations and during the race. In addition, we could only collect HR data from a reduced number of participants so HR-based energy expenditure estimations could not be performed. Therefore, further studies overcoming these limitations are necessary to confirm our findings.