Introduction
Drop landing is not only an integral part of many sport activities (McNitt-Gray, 1993), but is also utilized to assess the level of conditioning among athletes primarily in the lower limbs (Nordin et al., 2017). This is mainly due to the complexity of the movement patterns involved in an effective performance of a drop landing, as well as the involvement of high impact forces during landing (Chappell et al., 2005). Impact forces during drop landing are commonly quantified using ground reaction force (GRF). GRF could easily reach several times individual’s body weight and therefore places high impact on the human body (Niu et al., 2014). In order to effectively absorb GRF generated during drop landing, highly coordinated force production from the lower extremity musculature needs to be complemented with a well-balanced whole-body posture (Nagano et al., 2007). Here, a deterioration in these variables could change GRF, and therefore affect performance of athletes during drop landing.
In real-match scenarios, one aspect leading to deterioration in performance is neuromuscular fatigue, which is commonly built up in the final stages of a game or a match (Mohr et al., 2003). Neuromuscular fatigue negatively affects neuromuscular pathways (Gandevia, 2001;
James et al., 2010; Taylor and Gandevia, 2008), reduces muscle force production (Biglandritchie and Woods, 1984), negatively affects movement coordination (Sparto et al., 1997), increases muscle reaction times (Hakkinen and Komi, 1986), reduces proprioceptive capabilities (Hiemstra et al., 2001), and consequently impairs the ability to control body posture and absorb external loads during landing tasks (Orishimo and Kremenic, 2006; Wong et al., 2020; Yaggie and McGregor, 2002). Previous studies have demonstrated that individuals change their landing strategies, such as increasing the range of motion (ROM) at the knee joint or adjusting the stiffness at the hip and ankle joints, in order to adapt the effects of fatigue during drop landing (Coventry et al., 2006; Kernozek et al., 2008; Madigan and Pidcoe, 2003). They have also reported that GRF decreased after fatigue, which could be viewed as a result of self-protection with fatigue progression. Nevertheless, other studies have also reported a lack of such adaptation strategy while performing a drop landing following fatigue (Chappell et al., 2005; Patrek et al., 2011). An important reason for the discrepancy may be the heterogeneity in the time points of testing during fatigue progression. Since there was no standardized fatigue level in previous studies, pre/post comparison could be no fatigue/moderate fatigue (Dickin et al., 2015) or no fatigue/severe fatigue (Malmir et al., 2019). Those studies are also limited in their ability to provide the nature of the ongoing deterioration with meaningful details (Schmitz et al., 2014). Protocols with multiple levels of fatigue would provide great insights into the associations between fatigue-induced performance modifications and adapted neuromuscular strategies by enabling the progressive change of performance variables to be studied.
Another reason behind the inconsistency among previous studies is that different activities were chosen as the fatigue protocols (Gehring et al., 2009; Malmir et al., 2015; McLean and Samorezov, 2009; Xia et al., 2017). A single athletic task, such as plyometric jumps (McLean et al., 2007), cannot entirely replicate the multifaceted nature of movement patterns (e.g., decelerations, accelerations, and changes in the direction of movement) that athletes undertake during match play (Cortes et al., 2013), and therefore may be limited in its applicability towards providing an understanding of the effect of fatigue while performing a complex task. Thus, one single study that includes a complex movement task as a fatigue protocol, while simultaneously incorporating multiple levels of fatigue, may be needed. Such a study could comprehensively reveal not only the underlying biomechanical mechanisms of landing impact, but also the adaption of neuromuscular strategies due to fatigue progression during drop landing.
Therefore, this study aimed to investigate the effects of fatigue progression on GRF during landing in college athletes and the possible biomechanical factors leading to changes in landing strategy. It was hypothesized that GRF would show non-progressive change with fatigue progression. It was also hypothesized that biomechanical variables of the knee joint would be the main contributors to GRF during landing.
Methods
Participants
In total, 18 college athletes (gender ratio: 1:1; mean ± standard deviation, SD, age: 21.3 ± 1.0 years; body height: 1.81 ± 0.07 m; and body mass: 69.6 ± 8.6 kg) were recruited to participate in this study. The inclusion criteria were as follows: 1) no less than 5 years of training in basketball and volleyball; 2) no cardiovascular or respiratory disease; 3) no history of lower extremity surgery; 4) no injury to the lower extremity in the previous 6 months. Each participant signed an informed consent form approved by the Ethics Committee.
Experimental Protocol
After a 10-min warm-up on a treadmill at the speed of 8 km/h, each participant was prepared for the optical motion capture assessment (participant preparation). Each participant first performed one drop landing (experimental task) under the no fatigue (NF) condition. Then, the participant was requested to perform three consecutive countermovement jumps (CMJs) with a metronome. The metronome was set at 18 bpm to ensure that the frequency of jumping was consistent among all participants. The average height of the three jumps, calculated from the marker on the sacrum (the vertical displacements of the marker from the initial standing posture to the highest position in the air), was recorded as the NF jumping height, which served as a baseline for quantifying levels of fatigue during the fatigue protocol. After the baseline CMJ test, each participant performed a fatigue drill cycle involving sidestep cutting, running, and CMJs. At the end of the fatigue drill cycle, the jumping heights of the last three CMJs were calculated, and then compared with the baseline jumping height to identify the target level of fatigue. The criterion of medium fatigue (MF) was a reduction of 20% in jumping height occurring in all of the last three jumps of the fatigue drill cycle (Dickin et al., 2015; James et al., 2006). Participants repeated the fatigue drill cycle until MF was reached, and then performed the experimental task. After that, participants continued to perform the fatigue drill cycle to reach severe fatigue (SF - a reduction of 30% in jumping height) (Iguchi et al., 2014; Xia et al., 2017). The target level chosen for both MF and SF was proportional to each participant’s non-fatigue jumping height, and therefore ensuring standardization in terms of the state of fatigue. They then performed the final round of experimental tasks to finish the whole experiment. Only one trial of experimental task was tested at each level of fatigue to prevent the effects of fatigue from confounding with the effect of recovery. During formal testing, participants performed an average of 12.9 (3.5) fatiguing drill cycles to gradually achieve SF.
Participant Preparation
All participants wore spandex T-shirts, shorts, and sports shoes during testing. Then, the participant was fully instrumented with reflective markers according to the marker set guidelines of C-Motion (https://c-motion.com/v3dwiki/index.php/Marker_Set_Guidelines) Reflective calibration and tracking markers were bilaterally placed on predefined anatomical locations of the foot, ankle, shank, knee, thigh, pelvis, sacrum, and shoulder. A static trial was run with the participant in an anatomical reference position with all the markers presented. The calibration markers were then removed before testing.
Experimental Task
The participant performed a drop landing task from a platform 40 cm high. The participant was requested to slowly move his/her upper body forward until losing his/her balance, drop from the platform, and then land with double feet on two force plates (Bobbert et al., 1987; Salci et al., 2004).
Fatigue Drill Cycle
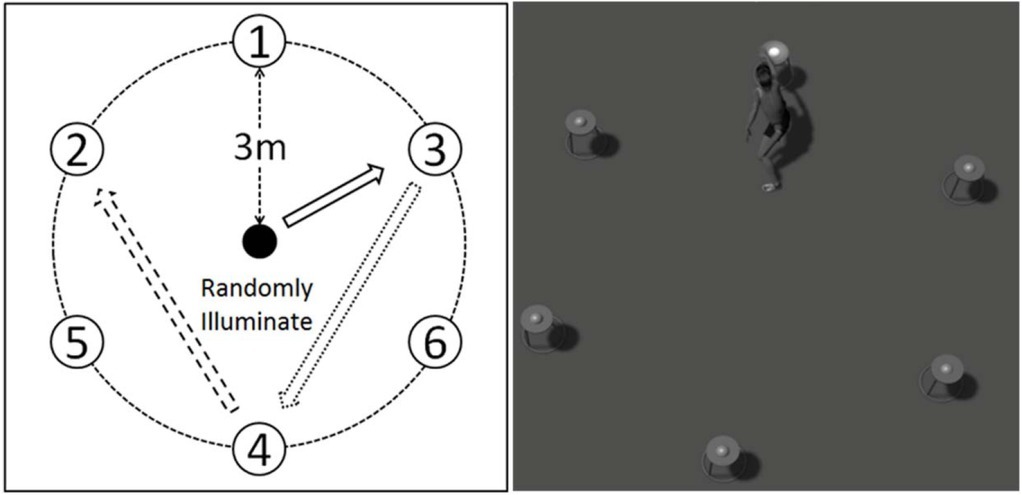
In order to simulate the progression of fatigue during match play, a variety of movements, including sidestep cutting, running, and jumping, were incorporated in the fatigue protocol. A random lighting signal system was developed for guiding the participant’s moving directions. The participant was requested to stand in the center of a circular region 6 m in the diameter with six lights equally placed around the circle (Figure 1). This system consisted of a controller illuminating the lights in a random series. During one lighting interval, the participant moved (cutting or running at their convenience) as fast as possible to touch the active light to turn it off and trigger illumination of the next light. In order to standardize the fatigue protocol, it was critical that the workout duration remained similar for all participants (McLean et al., 2007). Therefore, to ensure that the severity and the duration of the fatigue protocol were standardized across both genders, the quantity of lighting intervals within each fatigue drill cycle was adjusted in this study. A pilot study on two female and two male participants was conducted to estimate the mid-point of the level of severity in the fatigue protocol. In the pilot study, we observed that female participants had a sharper decline in jumping height after every fatigue drill cycle in comparison to their male counterparts. In order to achieve the approximately same duration needed to reach SF in the fatigue protocol, male participants chased 35 lighting intervals, while female participants completed a series of 25 lighting intervals. Both male and female participants then performed eight CMJs to complete one fatigue drill cycle. During formal testing, the average workout time of the fatigue exercise was 40.5 ± 2.9 min before reaching SF.
Data Collection and Processing
A 16-camera motion analysis system (100 Hz, Vicon Motion Analysis Inc., Oxford, UK) and two force plates (1000 Hz, Kistler Instruments AG Corp., Winterthur, Switzerland) were used to obtain the 3D kinematics and GRF simultaneously during testing.
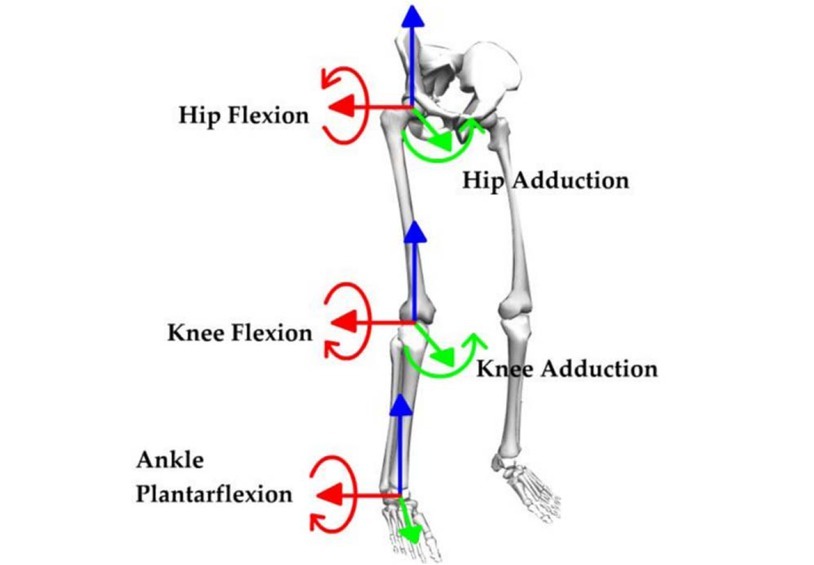
A 3D biomechanical analysis suite, Visual3D (C-Motion, Inc., Germantown, MD, USA), was used to compute 3D kinematic variables of the dominant lower extremity (the leg preferred for kicking) (Dickin et al., 2015; Peng et al., 2015; Xia et al., 2017; Yeow et al., 2009). The 3D angular kinematics was computed using a Cardan sequence (X-Y-Z), in which the order of rotation was flexion/extension (X-axis), abduction/adduction (valgus/varus, Y-axis), and internal/external rotation (Z-axis). A right-hand rule was used to determine the polarity of the 3D angular variables. The 3D markers’ trajectories and GRF signals were low-pass filtered (Butterworth, 4th-order, bidirectional) with cutoff frequencies of 10 Hz and 100 Hz, respectively (Zhang et al., 2018). Vertical GRF (vGRF) and joint moments were normalized to the body weight (BW) and body mass of the participants, respectively. The initial foot-ground contact (IC) was defined as the time point when GRF exceeded 10 N (Lee et al., 2013). The knee joint stiffness was calculated as the ratio of changes in the knee moment to changes in the knee flexion angle from the instant of IC to the instant of the peak joint moment (Farley et al., 1998). The local definitions of joint motions of the hip, knee, and ankle joints are shown in Figure 2.
Statistical Analysis
Three separate (one each for NF, MF, and SF) hierarchical multiple linear regressions (MLR) were conducted to identify whether the progression of fatigue led to changes in the manner in which the drop-landing task was performed. The reasons for choosing the hierarchical model were: 1) participants were nested within gender and as per the limitations of our female participants; 2) we wanted to know which variable replicated landing performance at different levels of fatigue. The dependent variable in all the MLRs was vGRF, which estimated the intensity of landing. The independent variables were gender, flexion-extension angles, and joint moment, as well as joint power at hip, knee and ankle joints, and knee joint stiffness (Table 1). The gender was entered in the model first, followed by the cumulative addition of all the other continuous independent variables.
Table 1
Values [mean(SD)] of all independent variables at the three different levels of fatigue (no fatigue (NF), medium fatigue (MF) and severe fatigue (SF)) entered into the hierarchical multiple regression model.
Two-way (fatigue × gender) analysis of variance (ANOVA) was performed to determine the interactions between fatigue and gender, as well as the effects of fatigue and gender on vGRF and those variables that were determined as predictors of vGRF from the MLR analysis. In the event of significant effect of fatigue, post hoc analysis was conducted using Bonferroni corrections to compare each two of the three levels of fatigue (Cohen, 1992). Statistical analysis was performed using SPSS software (version 13.0; SPSS Inc., Chicago, IL, USA) and significance was set at p < 0.05.
Results
The results of the study showed that knee joint stiffness and the knee angle at IC were the main predictors of peak vGRF for NF (Table 2). Differently, the peak knee flexion angle and peak knee power became the main predictors for MF (Table 2). The peak ankle plantarflexion moment instead of the knee variables was the main predictor of vGRF for SF (Table 2).
Table 2
Multiple regression analysis between vertical ground reaction force (vGRF) and biomechanical variables.
The time histories of ankle, knee, and hip joints during the landing phase are plotted in Figure 3. No significant interactions between fatigue and gender were found in vGRF and the predictor variables (Table 3). Significant differences among different levels of fatigue were found in the peak vGRF (p = 0.001, Power = 0.996, Table 3). The change of peak vGRF showed an opposite pattern: it decreased by 17% from NF to MF (p = 0.001), and then increased by 9% from MF to SF (p = 0.034). No significant difference was found in vGRF between NF and SF.
Figure 3
The time histories of the hip, knee, and ankle joint in the sagittal plane during landing. For the ankle angles, positive values indicate ankle dorsiflexion.
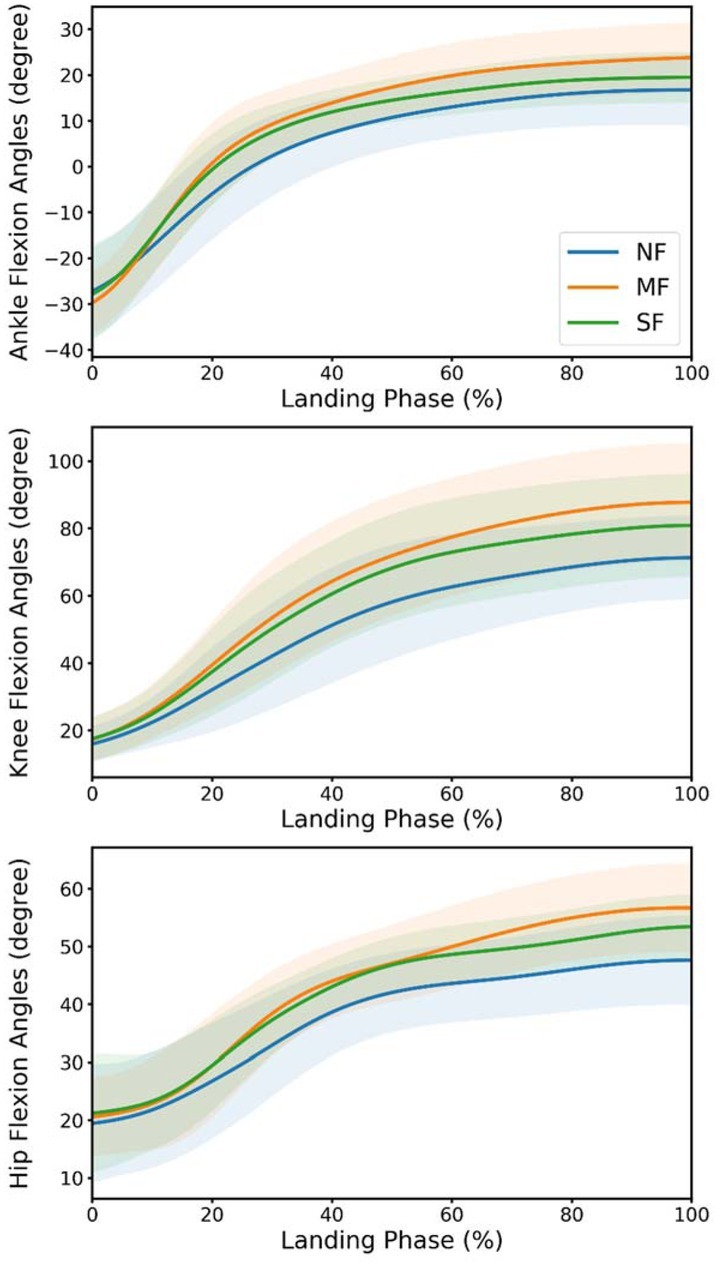
Table 3
Mean(SD) and ANOVA results (the effects of fatigue, gender and their interaction) on the predictor variables and the dependent variable (vGRF). NF: no fatigue; MF: medium fatigue; SF: severe fatigue. Significant p values are highlighted in bold.
The effects of fatigue on knee joint stiffness were significant (p = 0.033, Power = 0.651, Table 3). Specifically, knee joint stiffness decreased by 16% from NF to MF (p = 0.049), but it did not further change from MF to SF. While inducing fatigue did not affect the knee flexion angle at IC, it affected the peak knee flexion angle (p = 0.001, Power = 0.999) during drop landings (Table 3). Specifically, the peak knee flexion angle increased by about 23% across both genders from NF to MF (p = 0.001), and a further progression of fatigue from MF to SF led to a non-significant decrease in the peak knee flexion angle of about 8% across both genders (p = 0.051). Finally, fatigue did not significantly affect peak knee power and peak ankle plantarflexion moment.
Discussion
This study investigated the effects of the severity of neuromuscular fatigue on GRF during dynamic landing in college athletes. Neuromuscular fatigue was determined by quantifying the reduction in jumping height after each fatigue drill cycle. While peak vGRF decreased during MF (determined as a reduction of 20% in jumping height in comparison to pre-fatigue levels), continuation of fatiguing exercises to SF (determined as a reduction of 30% in jumping height in comparison to pre-fatigue levels) led peak vGRF to return to its initial levels. The MLR analysis revealed that the predictors of peak vGRF during drop landing for NF and MF were the moments and angles of the knee joint, while for SF, the predictors were the moments of the ankle joint. Thus, it is likely that the primary contributors of landing performance shifted from the proximal to the distal joints with the progression in the levels of fatigue, suggesting that similar GRF during NF and SF was actually achieved through the use of different landing strategies.
The decrease in vGRF from NF to MF was mainly driven by changes in knee joint kinematics and kinetics during landing. For NF, knee joint stiffness was positively associated, while the knee angle at IC was negatively associated with vGRF (Table 2). As knee joint stiffness was significantly higher for NF in comparison to MF, it is likely that our participants were able to easily control their knee postures during landing with lower levels of knee joint bending due to strong knee muscles prior to the onset of fatigue. This could also lead to higher levels of GRFs, thus explaining the relation between large vGRF and large knee joint stiffness for NF found in this study. Although the association between large vGRF and the small knee angle at IC was unclear, the authors predicted that the relatively extended knee joint before foot-ground contact might help with controlling knee postures, which could lead to high vGRF during landing. The smaller vGRF for MF was in agreement with at least two previous studies (Kellis and Kouveliod, 2009; Madigan and Pidcoe, 2003) that reported a decline in GRF during single-leg drop landings following fatigue on muscles of the lower extremities. For MF, the main predictors of vGRF were the peak knee flexion angle and peak knee power with almost no contribution from other joints, which indicated that the decrease in vGRF associated with fatigue progression was mainly affected by the change in variables at the knee joint. Compared to NF, our participants performed soft landings during MF by increasing the knee flexion to counteract the possible reduction in muscle force during MF, as can be seen by the larger peak knee flexion angle for MF than NF in Table 1. This could also explain the negative association between the peak knee flexion angle and peak vGRF for MF. Consequently, the decrease in vGRF from NF to MF could be explained by the increase in the knee flexion angle and the decrease in knee joint stiffness through the weakening of knee muscle forces with the onset of fatigue from NF to MF conditions.
The main predictor of vGRF shifted from knee variables to the ankle plantarflexion moment as fatigue further progressed to SF. This indicates a probable redistribution in the contributors to different joints during landing with the increased severity of fatigue, of which similar phenomena have previously been observed (Barbieri et al., 2014; Coventry et al., 2006; Kim et al., 2017). Our participants tended to adopt an “ankle-dominant” landing strategy to adapt for the dramatic effects of fatigue in order to maintain stability during the landing task. This “ankle-dominant” strategy following fatigue of the lower extremities has also been reported in previous studies (Kim et al., 2017; Madigan and Pidcoe, 2003; Padua et al., 2006). In those studies, participants placed higher reliance on the ankle joint but less on the hip and knee joints after performing an exercise protocol that relied heavily on fatiguing the hip and knee musculatures (Kim et al., 2017). In this study, the “ankle-dominant” landing strategy might not be solely due to a well-functioning or well-trained ankle joint, but rather a result of further reduction in muscle forces around the knee and the hip. The fatigue protocol in this study required not only continuous sidestep cutting and jumping that might induce fatigue in the ankle, knee, and hip musculatures (Sasaki et al., 2015), but also contained light-touching movement that predominantly focused on the muscles of the hip and knee joints. Therefore, our fatigue protocol was more severe in terms of the recruitment of the muscles of the hip and knee joints in comparison to the muscles of the ankle. The contribution of muscles around the knee in absorbing external impacts during landing might have lessened during SF. Finally, this led to a significant contribution of muscles around the ankle as the primary predictors of the large vGRF for SF (Table 2). Support for such an argument also stems from the fact that vGRF tended to increase as the severity of fatigue increased from MF to SF, resulting in non-significant difference in vGRF between NF and SF. Three studies also reported that landing GRF did not significantly change after fatigue (Peng et al., 2015; Xia et al., 2017; Zhang et al., 2018). The increase in landing stiffness from MF to SF was probably caused by the decrease in energy absorption ability of the muscular system (Padua et al., 2006). Future studies may focus on evaluating joint eccentric work and low-extremity muscle EMG to verify the relationship between changes in muscle capacity and energy absorption during fatigue progressing.
During the whole experiment, it is likely that our participants firstly adopted a protective mechanism of “soft-landing” by increasing joint flexion to adapt for the effects of neuromuscular fatigue from NF to MF, which in turn led to smaller GRF for the MF condition in comparison to the NF condition. This may be a common mechanism for many high-impact athletic tasks during real-sports situations and potentially a biomechanical strategy to avoid injurious landing resulting from an inability of the muscles to produce the desired forces at the early stages of fatigue. However, such an adaptation might only be maintained up to a certain level of fatigue, where muscles from the accompanying joints may be able to contribute to task performance. It would appear that with the progression of fatigue, a stiffer landing strategy was implemented in order to pursue the landing task during SF. Although there was no significant difference in peak vGRF for NF in comparison to SF, landing performances under these two conditions were achieved by adopting separate landing strategies. GRF during NF was absorbed by the well-functioning ankle, knee, and hip. The fatigue of muscles around the knee and hip most likely reduces the work of these two joints in absorbing external loads during SF (Dickin et al., 2015). The ankle joint may be more active in absorbing GRF when the contributions from knee and hip joints to absorbing external impacts were likely reduced. This can finally lead to high impact on ligaments (Beaulieu et al., 2015; Dickin et al., 2015). It is likely that the MF condition could serve as a potential “stiff landing threshold”, such that upon increasing the severity of fatigue beyond this threshold, a possible natural deterioration in lower extremity biomechanics eventually occurs (these effects were observed across a majority of our participants, see Figures S1-3 of the supplementary material). Considering the potential value of a stiff landing threshold to inform injury-prevention training (Vaczi et al., 2013), studies with more levels of fatigue should be made to determine the exact time point of stiff landing transition during fatigue progression. A deeper understanding of the fatigue adaptations could unravel the relationships between the severity of fatigue and the risk of injury, which could be helpful in monitoring high intensity training to lower the risk of ligament injury.
Several limitations of this study should be addressed. First, comparisons between the results of our study and previous studies are limited. As the fatigue protocols (e.g., fatigue activities, the level of fatigue definition, and fatigue areas) largely vary in different studies, simply comparing the fatigue-induced changes in landing biomechanics would confound our understanding of the results. Instead, we put more effort into addressing the rationality and explaining the implications of our findings. Second, our participants were not requested to continue the fatigue protocol beyond SF until exhaustion. However, for the SF condition, a reduction of 30% in jumping height was achieved in an average of about 40 minutes, which was very close to the time of a basketball match. One of our participants did perform more fatigue cycles even after SF, however, no further reduction in jumping height was observed. Although the difference in jumping height between MF and SF was only an average of about 10%, participants could achieve MF at about the half-way mark (around 20 mins) of the entire fatigue protocol. Third, as our male participants performed 35 lighting intervals whereas our female participants performed 25 lighting intervals in each fatigue cycle, we chose to include gender in our MLR model to help understanding changes in the neuromuscular strategies across both cohorts. Finally, although reduction in jumping height observed in this study was attribute to “neuromuscular fatigue”, it may involve a psychological component. Future studies should evaluate the contribution of the psychological component to performance reduction.
Conclusions
A reversal pattern in vGRF during fatigue progression was observed. Participants experienced less vGRF during MF in comparison to NF, whereas they experienced greater vGRF during SF in comparison to MF. The main predictors to GRF changed from the knee to the ankle variables with fatigue progression. While participants changed their landing strategy by firstly increasing the ROM of the ankle, hip, and knee joints during MF, further fatigue progression led participants to adopt an ankle-dependent strategy to adapt for the reduced ability of the knee and hip to control the landing intensity. The “stiff landing threshold” associated with the severity of fatigue might inspire the construction of an effective injury-prevention program.