Introduction
In the second half of the 20th century, Nikolai Bernstein formulated the problem of motor redundancy (Bernstein, 1967), which is viewed as a one of the main issues in the area of motor control (Turvey, 1990; Latash, 1996; Latash et al., 2007). Motor redundancy refers to the fact that the number of elemental variables (EV) produced by elements of a system is higher than the number of constraints associated with a specific task. In the literature, we observe different approaches applied to solve “Bernstein’s problem.” First of all, one group of approaches involves the elimination of redundant degrees of freedom (DOF) as an ability of the central nervous system (CNS) to produce specific movements (Newell, 1991; Vereijken et al., 1992; Gielen et al., 1997) and the optimization of DOF involvement based on mechanical, engineering, psychological, and complex cost functions (Seif-Naraghi and Winters, 1990; Prilutsky and Zatsiorsky, 2002; Todorov, 2004; Parsa et al., 2017). In contrast to the described solutions, motor redundancy may be viewed as the system’s potential, which assumes all available DOF are used during the performed movement to ensure the stability of performance. By this way of thinking, the problem of a redundant number of DOF was reformulated as a principle of abundance (Gelfand and Latash, 1998; Latash, 2010a, 2012b). To solve “Bernstein’s problem” the concept of synergy was introduced based on the afore mentioned principle of abundance (Latash et al., 2007). Synergy (stability of action) is understood as a system’s ability to return to a certain state after perturbations of different natures (Latash and Huang, 2015; Latash, 2017). Synergies are used in the fields of movement science and movement disorders with at least three different meanings (Latash and Huang, 2015). For the purposes of this paper, we define synergy as a neural organization that ensures the stability of task-specific salient performance variables (PV), (Schöner, 1995; Latash et al., 2001, 2007). The main foundation of such understanding of synergy is the hypothetical hierarchical neural control of them with at least two levels (Bernstein, 1967; Latash et al., 2008; Latash, 2010b). Each voluntary movement can be based on a hierarchical control scheme, where the top level of the hierarchy provides an input that specifies the task performance in the space of the salient performance variables (PV). At a low level, this input is distributed among the redundant set of elements (elemental variables–EV), which can show a high level of variability, as long as the covariation of EV ensure the adequate values of PV (stability of the task performance) (Latash, 2012a). For example, the force produced by elbow flexion can be viewed as a PV (upper level of the hierarchy), which is stabilized by an organization of muscle activity patterns–EV (lower level). Hence, the activity of a single muscle can be used again as a PV, stabilized by the organization of the recruited motor units as EV at the lower level of the hierarchy.
The idea of task-specific stability was developed into the Uncontrolled Manifold Hypothesis (UCM), which is the method for the quantitative analysis of synergies (Scholz and Schöner, 1999; Latash et al., 2007; Latash, 2017). There are a few methods of applying the UCM framework (Latash and Huang, 2015; de Freitas et al., 2018; Freitas et al., 2018). The most popular in the literature is inter-trial variance analysis within and orthogonal to the UCM (Schöner, 1990). The total space of EVs is divided into two orthogonal subspaces (VUCM – subspace of motion that does not affect the controlled variables, and VORT, orthogonal subspace of motion that does affect the controlled variables),(Scholz and Schöner, 1999; Latash et al., 2002b). In further analysis, these two indices of variance are reduced to an index of synergy (ΔV), which confirms (or denies) a synergy stabilizing the PV (Latash et al., 2002b, 2007, 2010b). The foundation of the inter-trial method of UCM analysis is a requirement for performing multiple trials of a movement. This might become an issue due to the experimental conditions (e.g. time) and the participants’ abilities, which may not always allow them to perform many repetitions of a given task. Specifically, in participants with many neurological diseases such as atypical development, cerebellar disorders, basal ganglia disorders, or stroke, it is observed that these patients struggle with maintaining stability during the execution of consecutive movements (for review see, Latash and Huang, 2015; Vaz et al., 2019). Among the reasons for loss of movement stability, aging with all its negative consequences (Olafsdottir et al., 2007; Christou and Enoka, 2011; SKM et al., 2012) and fatigue (Enoka and Stuart, 1992; Reisman and Scholz, 2006; Singh et al., 2014) must be mentioned. Furthermore, all of the above-mentioned individuals cannot perform multiple trials without a loss of concentration (Green et al., 1989; Mirsky, 1995). Therefore, it is crucial to know the minimum number of task repetitions (trials) that allows for valid and reliable outcomes. In the literature, reliability is used for different notions with similar meanings (Atkinson and Nevill, 1998; Downing, 2004; Koo and Li, 2016). In this paper, we refer to reliability as the amount of total variance in reference to the measurement error (signal to noise ratio). It is well known that measurement errors are always present with consecutive measurements (Shrout and Fleiss, 1979; Hopkins, 2000), which implies that the internal consistency of the repeated trials becomes one of the major difficulties in motor control studies, especially in clinical investigations (Bruton et al., 2000; Lachin, 2004; Matheson, 2019).
The question of how many data points are needed to apply the UCM-based analysis was introduced by Latash et al. (2010b). They performed an informal study about changing the structure of variance with an increasing number of repetitions of a task. Their subjects executed fifty trials of reaching movement. The authors observed that the largest reduction of data in the standard deviation of both variance components (VUCM and VORT) was between ten and fifteen trials. The stabilization of the standard deviation occurred with twenty and more trials. This suggests that UCM analysis requires at least twenty trials to be properly measured. Despite this useful tentative data, there is a large discrepancy and a lack of consistency among researchers in this context for different measurements and tasks. The most investigated actions, such as multi-finger and prehension force production tasks, have used a different number of trials. These varied from 7 to 45 in multi-finger tasks (Latash et al., 2001, 2002a). However, the most often number of repetitions of movement in the later studies has been about 20 to 25 (Shinohara et al., 2004; Zhang et al., 2006; Gorniak et al., 2007; Shim et al., 2008; Martin et al., 2009; Park et al., 2012; Reschechtko et al., 2014). Similarly, in prehension tasks, it has ranged from 15 to 24 (Zhang et al., 2009; Latash et al., 2010a; Singh et al., 2014; Jo et al., 2015). The same diversity is observed in the UCM analysis for electromyographic (EMG) variables in different tasks. In many studies, the numbers of applied repetitions varied from 12 to 25 for one of the performed tasks (Krishnamoorthy et al., 2003, 2004; Wang et al., 2006; Asaka et al., 2008; Robert et al., 2008; Danna-Dos-Santos et al., 2009).
Despite of the vast amount of various research as well as studies by de Freitas et al. (2018) and Freitas et al. (2018), which indicate the reliability level of performing a dozen trials and compare different methods of applying the UCM framework, there is still no reported reliable standard for the number of trials needed to apply this method in force production tasks for force and EMG variables in different tasks. Moreover, Solnik and coauthors (2020) indicated that inadequate number of trials (i.e. not enough) may generate a misleading index of synergy (ΔV) value leading to wrong results interpretation. Therefore, the main aim of the present study was to find the desired number of task repetitions that ensures a reliable level of data for applying UCM analysis both for force and EMG variables (different levels of hierarchical control of synergies), which are not yet provided in the literature.
Methods
Participants
Thirteen healthy male adults (19.69 ±1.49 years old, 80.23 ±10.75 kg weight, and 180.54 ±6.85 cm height; mean ±SD) voluntarily participated in this study after signing an informed consent approved by the Institutional Review Board. To be involved in this study, participants had to meet the following inclusion criteria: (i) had to be male, (ii) had no history of any neurological or musculoskeletal disorder that could affect the upper arms, and (iii) had to report a lack of regular strength training (as regular we mean at least two one-hour-long sessions per week). All participants were naive to the purpose of the study.
Apparatus and experimental procedure
Kinetic and electromyography (EMG) data were recorded using two force sensors (model 060-P665-01, Honeywell, USA) and Noraxon Wireless System (DTS Noraxon, USA), respectively. Self-adhesive hydrogel electrodes (Kendall, 30 x 24 mm) were attached to ten muscle bellies: the biceps brachii, brachialis, brachioradialis, flexor carpi radialis, and flexor carpi ulnaris both on the dominant and non-dominant upper extremities to record surface EMG. Electrodes were placed following SENIAM recommendations (Hermens et al., 2000). Force and EMG data were synchronized using Noraxon software (MyoResearch, ver. 1.08.17). Both signals were sampled at 1500 Hz.
Participants were seated comfortably on a gym bench with the forearms laying down on top of the bench (Scott’s bench). The subject’s elbows were set shoulder-width apart (angle between the arm and forearm was set at 90 degrees). The distal parts of the forearm were attached to the dynamometer. The height of the seat was adjusted to the participant’s height. The experiment consisted of 15 consecutive isometric contractions of elbow flexion in an accurate total force production task for both upper extremities. The subject viewed the monitor, which displayed the sum of the forces (FTOT) produced by both arms. During the measurements, the Noraxon software generated a pattern consisting of two phases: 3-sec of force production and 5-sec of rest. The timestamp of each phase (onset, offset) was provided by an auditory (beep) signal. The single trial (repetition) lasted eight seconds. First, the maximal voluntary contraction (MVC) task was conducted, each subject performed three consecutive arm flexions. During the MVC test, feedback (FTOT) was provided, and the participants were encouraged to bend their arms as strong as possible. Second, in the static force production task, the participants were asked to produce forces of 30% of obtained MVC (Ambike et al., 2016). In this task, the subjects produced 15 consecutive isometric contractions of arms flexions, followed a pattern on the screen.
Data processing
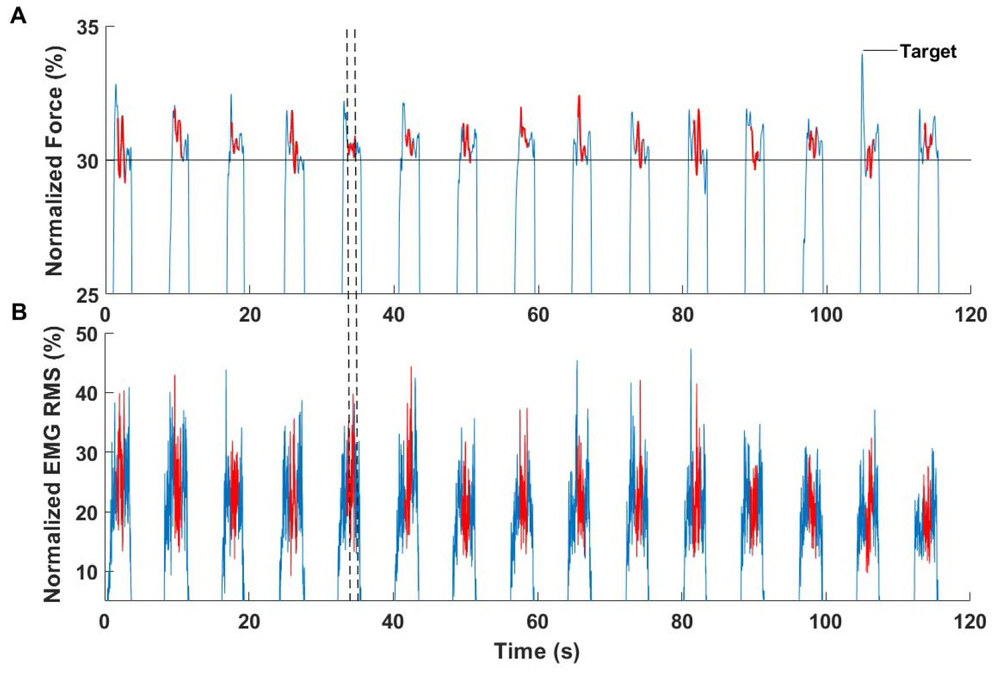
All signals were processed offline using MATLAB software (ver. R2017b, MathWorks, USA). The force signals were low-pass filtered at 10 Hz, fourth-order Butterworth. Next, the filtered data was normalized to the maximal MVC force, which was calculated as the mean value in the interval of force peaks ±250 ms in each performed repetition. Raw EMG signals were band-pass filtered (20-360 Hz), fourth-order Butterworth, and rectified. Next, the root mean square (RMS) algorithm in moving the 100-ms window was calculated. The RMS EMG data was then normalized to the MVC in the same way as the forces. The force and EMG normalized data were cropped into the 15 cycles. The three-second force production phase of the protocol was used as a cycle. The beginning of each cycle was set at the threshold point, where the force and EMG was higher than 5% of the achieved results of the MVC test. The end of each cycle was set at the point where the data were smaller than a threshold. As an input to synergy analysis, we took 1 sec of each cycle (Fig. 1).
Defining EV to UCM analysis
Due to the performance of analysis on two different levels of the neural hierarchical control of synergies, we started from the analysis of the EMG signal (lower level of the hierarchy). In order to apply the synergy analysis, the M-modes were selected as an EV. M-modes are defined as groups of muscles with the parallel scaling of the activation level (Krishnamoorthy et al., 2003; Danna-Dos-Santos et al., 2007; Furmanek et al., 2017). To extract M-modes we used the Principal Component Analysis (PCA) with varimax rotation. This method of factor extraction was validated by Tresch et al. (2006). Two first eigenvectors are selected during the PCA analysis to reduce the 10-dimensional muscle space to a two-dimensional factor (M-mode) space for each subject. This reduction was based on the percentage of total variance accounted by individual PCs (addressed as M-modes) and the analysis of the scree plots. In addition, we choose only PCs which had at least one muscle with the absolute value of the factor loadings > 0.5 (Furmanek et al., 2017). For force analysis (higher level of the hierarchy) as EV, we selected the mean value of force produced by each upper limb in the center second of each cycle.
Defining the Jacobian matrix
The second step in synergy analysis consisted of defining the Jacobian matrix (J). J consists of linear relationships between small changes in the magnitude of M-mode (ΔM) and individual limb forces in relation to the FTOT (which are selected as PV in both analysis levels). In the case of M-modes, J was computed with applied multiple regression (Eq. 1) overall cycles performed by each subject:
The coefficients of the multiple linear regression analysis were used as estimates of the J (Eq. 2) for each subject separately:
For force analysis, there is a linear space of data in our protocol. Hence, it is not necessary to linearize the space and J corresponds to the sum of two limb forces J = [1,1].
Analysis of intercycle variance: index of synergy
In the last step of synergy analysis, we estimated a UCM space for FTOT as the null-space of the J matrix. The null-space of J is a family of vector solutions x of a system of equations Jx = 0, (this subspace is spanned by basis vectors, ɛi.). In the analysis of EMG and M-modes, the synergies were stabilizing FTOT in the M-mode space (their dimensionality of two). For each time of the cycle, the mean magnitude of each of the M-modes was calculated (ΔM) and subtracted from the vectors of the individual changes in the magnitudes of the M-mode for each cycle (Eq. 3). The residual mean-free vectors ΔMdemeaned were calculated for each subject.
The inter-cycle variance was partitioned into two subspaces: variance parallel to the UCM (VUCM) which does not affect the salient performance variable, and orthogonal to the UCM (VORT) which does. In order to compute the synergy index, we project the vector ΔMdemeaned onto the UCM (Eq. 4) and on the orthogonal ORT subspace (Eq. 5).
The inter-cycle variance (from trial to trial) was computed as VUCM (Eq. 6), VORT (Eq. 7) and total variance VTOT (Eq. 8). All of the variables were normalized by the number of degrees of freedom of the corresponding spaces.
To quantify the stabilization of FTOT in M-mode space, the index of synergy (ΔV) was used, which reflected the difference between the variance within the UCM and orthogonal to the UCM (Eq. 9).
Positive values of ΔV indicate a synergy (VUCM > VORT) stabilizing FTOT (Latash et al., 2001; Scholz et al., 2002; Danna-Dos-Santos et al., 2007). For further analysis, ΔV was log-transformed using Fischer’s z-transformation (ΔVz) (Solnik et al., 2013, 2020; Furmanek et al., 2017). In the force synergies we applied a similar computational algorithm. Detailed descriptions of these analyses can be found in earlier publications (Scholz and Schöner, 1999; Latash et al., 2001; Scholz et al., 2002; Krishnamoorthy et al., 2003).
Statistical analysis
Statistica 13 (StatSoft, USA) and Microsoft Excel 16 (Microsoft Inc., USA) were used for all statistical analyses. The reliability of measurements was estimated using intraclass correlation coefficients (ICCs) described by Shrout and Fleiss (1979). Derived from a repeated measure analysis of the variance (ANOVA) results, the ICC was used to compare within- and between-subject variability. According to the guidelines for selecting and reporting ICC for reliability research (McGraw and Wong, 1996; Koo and Li, 2016; Liljequist et al., 2019), we applied ICC and their 95% confidence interval based on an absolute agreement, 2-way random model, which is appropriate for testing intra-rater reliability with multiple scores from the same rater (Eq. 10):
where MSB, MSR, and MSE are the mean squares of the 2-way ANOVA, k is the number of the subject, and n is the number of trials. Statistica and Excel software was used to estimate the reliability coefficient (R) by averaging k-trials. Furthermore, the Standard Error Measurement (SEM), (Eq. 11), and lower and upper bound (Eq. 12) of the Confidence Interval (CI) were computed (the confidence level was applied at 95%).
The last parameter used in further analyses was the Minimum Detectable Difference (MDD). MDD is used to define the amount of change reflecting the true difference in a variable, not as a possible error. MDD is the smallest amount of the mentioned change (Eq. 13) (Portney and Watkins, 2015; Matheson, 2019). The estimation of MDD is based on the 95% CI. The level of significance was set at p = 0.05.
Results
Based on the hierarchical neural control of synergies, the main findings of the present study are presented in a two-step order. This section starts with the analysis of the data obtained from the forces, and subsequently from the EMG. The analysis of reliability was performed for the following variables: VUCM, VORT, and ΔVz. The results of the ICCs for the force and EMG data are presented in Table 1 and 2, respectively. In both analyses, the ICCs are reported for consecutive trials from three to fifteen. Moreover, following the recommendation of Koo and Li (2016) regarding the estimation of the required minimum number of trials, ensuring the reliable level of measurement is based not only on achieving the ICC value, but also with respect of the CI, the lower and upper bound of the 95% CI, F test (the quotient of the average sum of squares between objects and the average sum of error squares), as well as reporting the SEM and MDD values. Among the many different possibilities of interpreting the ICC value, we have assumed the one reported by Portney and Watkins (2015): ICC values less than 0.5 are indicative of poor reliability, values between 0.5 and 0.75 indicate moderate reliability, values between 0.75 and 0.9 indicate good reliability, and values greater than 0.9 indicate excellent reliability. For ‘reliable measurements’ we mean reliability at least on a good level in the 95% CI.
Table 1
Results of the reliability analysis for force synergy
Table 2
Results of reliability analysis for muscle synergy
Number of trials to ensure reliable measurements for force synergy
For the analyzed variables, an increase in the ICC value was observed when performing the subsequent repetition of a task. Similarly, in the case of the lower and upper limits of the CI, the CI narrows according to the greater values of the bounds. In addition, a continued decrease in SEM was observed with further trials. In force synergies, the most sensitive for data deviation is VUCM. There is a need to perform at least ten trials to achieve the good to excellent reliability of the measurement (95% CI: 0.76-1.00). At the same level for VORT we observed a stable distribution of data with a need for at least four trials (95% CI: 0.82-1.00). In the case of ΔVz, we are able to indicate two levels of assuming reliability. First, a good level (R > 0.75) is achieved after performing five trials (95% CI: 0.81.00). Second, an excellent level of reliability (R > 0.9) is obtained after ten repetitions of the task (95% CI: 0.90-1.00). Hence, there is no consistency with the required number of measurements among the analyzed variables in force synergies (Table 1.).
Number of trials to ensure reliable measurements for muscle synergy
There is no possibility to indicate a clear increase in the ICC value as was in the case of the force synergy. For VUCM, VORT, and ΔVz in the muscle synergy, the ICC values at the first few trials achieve a high value (R > 0.9), but in the next one, drop significantly as well as the lower bound of the CI. Similar to the force synergy analysis, the SEM value decreases with each additional trial, but there is not such a clear drop as in the earlier analysis. Again, the VUCM is less repeatable than VORT. VUCM requires ten trials to achieve moderate to excellent reliability (95% CI: 0.51-1.00). Similar to force analysis, a smaller number of trials are needed for VORT. Finally, seven trials are enough to achieve good to excellent reliability (95% CI: 0.75-1.00). In ΔVz we reported moderate to excellent reliability for four trials (95% CI: 0.54-1.00). Similarly to force analysis, there is no consistency in the EMG results (Table. 2).
MDD analysis
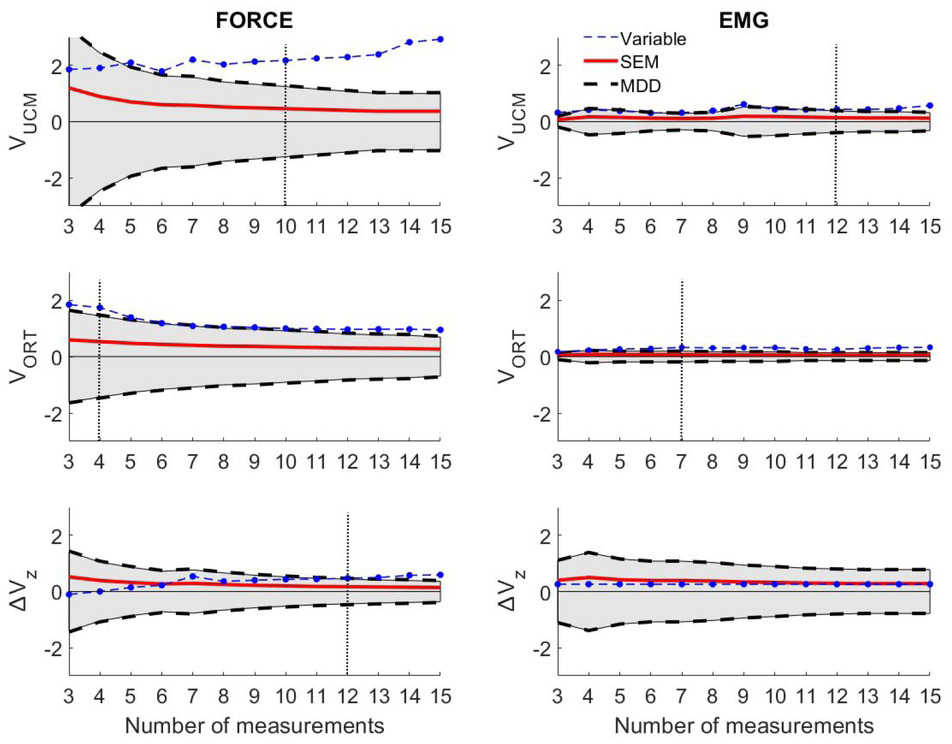
We performed additional analysis by using the minimal detectable difference (MDD). This parameter assesses the variability of variables-in order to error of measurement (e.g. random, rater errors, etc.) (Fig. 2). An analysis of MDD provided crucial additional information for our results. In the analysis of force synergy based on the ICC, we marked the minimal number of trials to apply UCM analysis as follows: VUCM-10, VORT-4, ΔVz -5. However, MDD showed that the previously designated five to ten trials for ΔVz is unacceptable because of an emerging error. In light of this new fact, for the force synergy analysis of ΔVz we set 12 trials as the minimum, allowing for an excellent reliability of measurement (95% CI: 0.93-1.00). In the muscle synergy analysis, we found that for VUCM the previously designated ten trials are not enough for reliable inferences. We assumed a minimum of 12 trials to achieve moderate to excellent reliability levels for VUCM (95% CI: 0.65-1.00). We did not observe any change in VORT, as 7 trials still ensured reliable outcomes. ΔVz computed from the EMG data from fifteen consecutive trials were smaller than the SEM and MDD values.
Figure 2
Results of MDD analysis. Gray shadow indicates the area where the error values are greater than true changes in measured variables. Left column-Results of force analysis; Right column-Results of EMG analysis.The vertical dotted line indicates the corrected minimal number of trials to achieve reliable data.
Discussion
This study aimed at finding the minimum number of trials to ensure reliable results for applying the inter-trial variance method of synergy analysis within the UCM framework. Regarding force synergy, our data indicate that performing 10, 4, and 12 trials would achieve at least good to excellent levels of reliability in VUCM, VORT, and ΔVz, respectively. Subsequently, for muscle synergy it is enough to perform 12 trials for VUCM to achieve moderate to excellent levels of reliability and 7 trials in VORT for good to excellent levels of reliability. ΔVz turned out to be smaller than SEM and MDD, which implies that our data does not allow to determine the minimum number of muscle activations to ensures reliable outcomes for ΔVz for muscle synergy.
In reference to the first tentative study by Latash and coauthors (2010b), we obtain relatively consistent results. In the force production task (isometric elbow flexion), ten trials were enough to achieve good to excellent reliability for VUCM and four trials were enough for VORT at the same level. In the literature, there are only a few studies which attempt to set the minimal number of trials in UCM analysis. de Freitas et al. (2018) measured the reliability of applying different methods of analysis within the UCM framework. Their results indicate that performing at least ten to twenty-four repetitions of tasks achieves a reliable measure of inter-trial variance. These outcomes are consistent with our results; at least ten trials are needed for VUCM. Furthermore, for VORT in the force production task, it is enough to perform four repetitions to ensure a good to excellent level of repeatability of the data. Similarly, Freitas et al. (2018) also set the number of trials at four, but for ΔVz. To our knowledge, four repetitions for ΔVz allow moderate to excellent levels of reliability to be achieved. In our opinion, these results should be interpreted with caution. The index is fully dependent on VUCM and VORT, which leads to the analysis of only the index of synergy. This leads to a loss of information on the upper subspaces of UCM. It is necessary to remember that ΔVz is also log-transformed for normality (Solnik et al., 2013, 2020) prior to further statistical analyses having an impact for interpretation. In other studies, Tawy et al. (2018) performed fifty trials to apply the inter-trial variance method of UCM for measuring gait variability. Their protocol was confirmed by Rosenblatt and Hurt (2019), who investigated the reliability of UCM analysis also for gait. They confirmed that an excellent level of reliability of variance may be achieved after performing forty-nine trials for VUCM, forty-eight for VORT, and sixteen for ΔVz. However, the differences between using fifteen to twenty and fifty steps were relatively small (< 20% of variability in measured variables). We set 12 trials for our study of ΔVz in force synergy analysis, allowing for an excellent level of reliability. However, we only measured forces in the elbow joints in isometric conditions. Perhaps the more structures of the body that are involved in the movement execution, the more trials are needed to obtain reliable data (as in mentioned the gait studies).
We strongly believe that the obtained results in this study can facilitate procedures for applying UCM analysis in force as well as muscle synergies in further studies among researchers. However, the outcomes from the EMG data are unexpected, especially with regard to ΔVz. The values of the index of synergy decreased and started oscillating around zero. The interpretation of ΔVz assumes that positive values indicate an existing synergy between the structures of the body involved in the movement execution. In contrast, negative values indicate a lack of synergy (Latash et al., 2007). Hence, for force synergy we observe the distribution of ΔVz in the opposite direction– providing strong synergy. These results may be due to the design of our study, where the control of synergies may be viewed as distributing the task between two limbs (higher level) and distributing actions by choosing the muscles of each of the limbs (lower level). We asked our participants to generate an adequate level of MVC force with two upper extremities (inter-limb synergy). However, at the same time the central nervous system (CNS) had to control the muscle contractions involved in the force production. For both levels of analysis, we expected stabilizing synergies to occur (the experimental task was completed by the limbs as well as the muscles). Generally, at each level of such an understanding hierarchy, there is a synergy which has a stabilizing effect on the combined actions (PV) of the elements (EV) on the lower level (Latash, 2015, 2016, 2017). This hypothesis was confirmed during prehension (Zatsiorsky and Latash, 2004) and pointing tasks (Domkin et al., 2002). However, in the latter studies performed by Gorniak et al. (2007a, 2007b, 2009) in a two-hand force production task, they found system behavior similar to what we found in our results. In contrast to the lower level of hierarchy control (very weak and disappeared synergy), they confirmed a strong synergy on the higher level. We report exactly the same behavior of ΔVz according to the two investigated levels of synergy control. The organization of CNS allows the execution of the task (inter-limb synergy), but it is not able to ensure synergy among the muscles. On the other hand, the distribution of UCM variance indices may be due to the typically high noise-to-signal level of the EMG signal and its stochastic nature (e.g. cross-talk). Furthermore, the quality of the EMG data depends on the applied method of recording and data processing because of this sensitivity (e.g. filtering, smoothing, etc.). The main drawback of our study is the lack of an EMG signal from the antagonist muscles, which could provide additional important data to describe all of the mechanics of the task (difference between agonists and antagonists). Nevertheless, we did not measure the EMG from these muscles as the main task was focused on elbow flexion in isometric conditions.
In conclusion, we fully agree with the thesis: the more data points (trials/repetitions) there is, the better the reliability of achieving indices of variance while applying the UCM analysis will be (Latash et al., 2010b). At the higher level of the hierarchy (generating forces), we recommended performing at least twelve repetitions of a task to achieve an excellent level of reliability. At the lower level (muscle activation), we also recommended twelve repetitions of a task to ensure a moderate to excellent level of reliability of UCM outcomes (VUCM, VORT). However, without calculating the index of synergy in simultaneously controlling tasks on two hierarchical levels, it is not reliable at all. Our study confirms that the CNS is not able to ensure stability on two different levels of control for synergies in a simultaneous task. Hence, we report a large variability in the analysis of muscle synergies. Due to the behavior of muscle synergy variables, we recommended taking special caution during data interpretation in such constructed studies. Our results seem to confirm the hypothesis that the CNS is not able to organize a strong synergy at two levels of a control hierarchy system at the same time.