Introduction
In soccer, the style of play can be considered a general behaviour adopted by the whole team to achieve the attacking and defensive objectives in the match (Fernandez-Navarro et al., 2016). Specifically, Hewitt et al. (2017) defined playing style as a playing pattern used by a team during matches showing a specific performance idiosyncrasy. In addition, it will be stably repeated within specific situational contexts where the measurement of some performance indicators may reflect the team’s playing styles.
The available research focused on playing style in soccer has evolved in its approach measuring those key playing patterns which defined the styles of play. Pollard et al. (1988) showed that there were three factors defining the styles of play in the English Premier league: (i) passing (short and long) and possession; (ii) use of centres; and (iii) regaining possession in attack. Bangsbo and Peitersen (2000) classified playing styles into attacking and defending ones. The former one was composed by direct attack, possession of the ball, counterattacking, total actions and crosses; while the latter one included high and low pressure situations. Hewitt et al. (2017) stated that a playing style pattern was demonstrated by a team during five moments of the match-play: (i) Established Attack, (ii) Transition from Attack to Defence, (iii) Established Defence, (iv) Transition from Defence to Attack; and (v) Set Pieces. Fourthly, in the most recent studies (Fernandez-Navarro et al., 2016; Gomez et al., 2018; Lago-Peñas et al., 2018) focused on identifying soccer team’s playing styles, the statistical model used was the factor analysis (PCA: Principal Component Analysis). The first study used nineteen performance indicators to identify different playing styles, and the results showed that six factors (possession directness, width of ball regain, use of crosses, possession width, defensive ball pressure, progression of the attack) and twelve different styles were identified (Fernandez-Navarro et al., 2016). Meanwhile, the second study encountered four playing styles (“possession” style of play, set pieces attack, counterattacking play, transitional play) from the consideration of twenty match performance indicators (Lago-Peñas et al., 2018). The latest study selected over sixty match performance variables to define the eight plying styles (ball possession, ending actions, individual challenges, counter-attack, set-piece, transitional-play, fouling actions, free-kick) in Greek professional soccer (Gomez et al., 2018).
The identification and measurement of playing styles in elite soccer have a direct application into practice and competition for coaches and performance analysts when gathering the key performance indicators from their teams (Kubayi and Toriola, 2020; Lago-Peñas et al., 2018). Modelling playing styles could improve performance analysis allowing comparisons among teams and competitions, as well as to model performance trends over time based on: (i) team’s strategies, (ii) player’s evolution, or (iii) the scouting opponents (Fernandez-Navarro et al., 2016; Hewitt et al., 2017; Lago-Peñas et al., 2018).
In order to identify styles of play, performance indicators (PI) are considered as the best variables that allow to reflect different aspects of attacking and defensive performances in soccer (Hughes ans Bartlett, 2002). However, key performance indicators may describe and distinguish between features of playing patterns in a different way according to those variables included in the statistical models. In particular, the characterization of playing styles in soccer is still inconclusive due to previous studies which analysed the PI from an isolated performance dimension (i.e., physical, technical or tactical) (Lago-Peñas et al., 2018). The available research demonstrated that playing styles reflect the combination of physical (Bradley et al., 2016; Bradley et al., 2009; Carling, 2011; Reilly, 2005), and technical-tactical performances during soccer matches (Collet, 2013; Fernandez-Navarro et al., 2016; Lago-Peñas et al., 2018). Accordingly, there is a need to analyse the styles of play combining the PI dimensions in order to obtain a better description of playing styles during team’s matchplay (Castellano et al., 2012; Fernandez-Navarro et al., 2016; Rein & Memmert, 2016). Moreover, these previous studies mentioned above merely took into account technical-tactical performances, failing to address the influence of physical performances. In addition, soccer has evolved across time because of rule changes as well as match tactics and strategies, increases in professionalism, the use of new technologies, global exposure, and transformations in training and the players’ recruitment process (Wallace and Norton, 2014). This evolution of soccer directly affects performance indicators and patterns of play during matches, and then may modify the playing styles developed by teams (Barnes et al., 2014; Bush et al., 2015; Hewitt et al., 2017). Despite the fact that some present studies (Barnes et al., 2014; Bradley et al., 2016; Bush et al., 2015) explored the long-term trends of physical and technical indicators, no previous study has examined the longitudinal evolution of the different playing styles used by teams and their association with the success.
Specifically, the majority of Chinese Soccer Super League (CSL) teams, under the permission of the financial policy, have invested considerable capital (e.g., even more than the most lucrative counterparts from Europe) in recruiting many world-famous foreign coaches and players during the last five years (Xu et al., 2018). Compared with the previous ageing soccer “stars”, more competent, skilled, younger, and somewhat in mid-career players were recently transferred from top European and South American leagues to the CSL due to the increase in financial benefits (Connell, 2018). It has been demonstrated that some of those Chinese teams are already benefiting from the success of recruiting high-performance coaches and players, as there is an increase of professional players and an improvement of playing skills for domestic players (Huang, 2016). This recruiting process of high-level coaches and players, coupled with the improvement of the domestic players may essentially affect match performance and playing styles in the CSL. Particularly, Zhou et al. (2020) found that physical performance (i.e., high-intensity running distance) together with technical performance variables such as crosses, shots on target, and opponent penalty area entries, have increased from the 2012 season to the 2017 season in the CSL. However, the analysis of playing style trends related to physical and technical-tactical indicators in the CSL is still inconclusive.
Therefore, the aim of the study was twofold: (i) to identify and measure those playing styles used by the CSL teams during a six season period (from the 2012 to 2017 season); and (ii) to investigate the evolution of styles of play during the seasons under analysis. The hypothesis of the study considered that specific playing styles could be identified (based on physical and technical-tactical indicators) and varied along the seasons as an adaptation of performances to succeed.
Methods
Match sample and variables
The CSL is the professional soccer league in China, which starts in March (spring in China) and ends in November (winter) every season. The competition system is played in a balanced schedule (each team plays twice against different opponents (both at home and away) by 16 teams (n = 240 matches per season). The sample was composed of 1,429 matches (n = 11 match data were missed due to absence of match reports) from the 2012 to 2017 seasons. Match statistics were collected by a semi-automatic computerized video tracking system, Amisco (Amisco, Nice, France), of which working process, accuracy, validity and reliability were previously reported (Zubillaga et al., 2007, 2009).
Based on the scientific literature (Carling et al., 2016; Mao et al., 2017; Yang et al., 2018), 17 technical and 11 physical PI were chosen as dependent variables in the analysis due to their importance for measuring performances related to space and possession of the ball (Fernandez-Navarro et al., 2016). The following PI were collected: Shots, Shots on target, Corners, Crosses, Possession, Possession in the opponent half, Passes, Passes accuracy, Forward passes, Forward pass accuracy, Opponent 35 m entry, Opponent penalty area entries, 50-50 Challenges won, Fouls committed, Offside, Yellow cards, Red cards, Total distance, Total distance in possession of the ball, Total distance without possession of the ball, Sprinting distance, Sprinting effort, Sprinting distance in possession of the ball, Sprinting distance without possession of the ball, High-speed-running distance, High-speed-running effort, High-speed-running distance in possession of the ball, High-speed-running distance without possession of the ball.
Statistical analysis
A factor analysis model using principal components analysis (PCA) and Varimax rotation was run with all 28 PI in order to pool the variables into factors (dimensions of playing styles). The Kaiser-Meyer-Olkin (KMO) measure of sampling adequacy was good (0.767) and the Bartlett’s test of sphericity (x2 = 98916.78, df = 378, p < 0.001) showed that correlations between items were sufficiently large to run the PCA. The principal components obtained in the model accounted for 74.4% of the total variance (Table 1).
Table 1
Eigenvalues for components and total variance explained.
Multivariate analyses of covariance (MANCOVA) were used to observe differences among those factors identified in the PCA analysis between the six years studied (20122017). The teams’ ranking (end-of-the season ranking of each team) was used as a covariate to account for the effect of rankings on playing style and to explore whether it might confound the association between the style of play and the season change. A further multivariate analysis of variance (MANOVA) was used to analyze differences in those factors between six years (2012-2017) for the only 9 teams that played during six consecutive seasons in the CSL. For all multivariate analyses, partial eta-squared effect sizes (ηp2) were used to analyze the magnitude of effects, using the following interpretation as small (0.01), moderate (0.06) and strong (0.14) effects (Cohen, 1988). Pairwise comparisons between the six seasons were further analysed using Cohen’s d effect size (Cohen, 2013). Magnitudes of the standardized effects were interpreted using thresholds of <0.2, 0.2-0.6, 0.6-1.2, 1.2-2.0, 2.0-4.0 (Batterham & Hopkins, 2006).
All statistical analyses were conducted using the IBM SPSS statistical software package (version 23; IBM, Armonk, NY, USA). The level of significance was set at p < 0.05.
Results
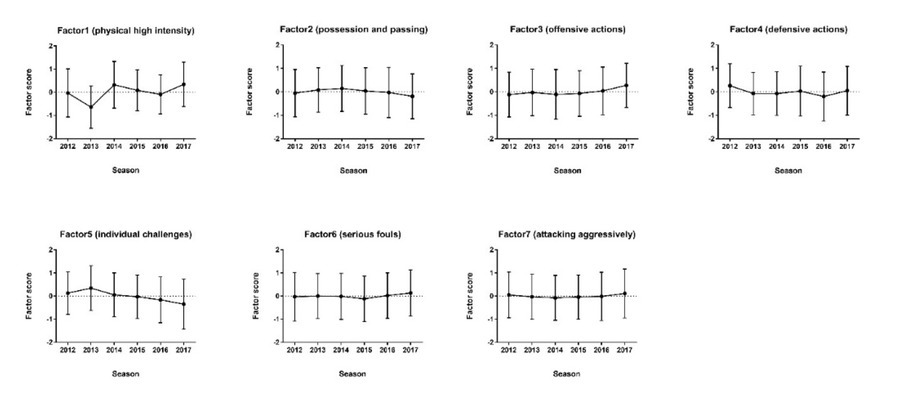
Seven factors were extracted (eigenvalues above 1) using the cut-off value of |0.60| in order to identify substantial loadings on factors (Lago-Peñas et al., 2018). The extracted factor scores were saved as variables in order to be used in the subsequent data analysis (Table 2). Factor 1 (high intensity play) included total distance, sprinting distance, sprinting effort, sprinting distance in possession of the ball, sprinting distance without possession of the ball, high-speed-running distance, high-speed-running effort, high-speed-running distance in possession of the ball and high-speed-running distance without possession of the ball; Factor 2 (possession and passing) included possession, pass, passes accuracy, forward pass, forward pass accuracy, opponent 35 m entry and total distance in possession of the ball; Factor 3 (offensive actions) included such variables as shot, corner, cross, possession in the opponent half and opponent penalty area entry; Factor 4 (defensive actions) included fouls committed; Factor 5 (individual challenges) only included 50-50 challenges won; Factor 6 (serious fouls) included red cards; and Factor 7 (attacking aggressively) only included offside
Table 2
Rotated component matrix for the performance indicators.
The results of Table 3 suggest that the season had trivial to small effects on every factor score over the 6 seasons except for Factor 7 (p < 0.05, ηp2 = 0.005-0.036), the final ranking had trivial to small effects on every factor score over the 6 seasons (p < 0.05, ηp2 = 0.005-0.049) except for Factor 1. A trivial interaction (time*final ranking) on every factor score was observed (p < 0.05, ηp2 = 0.004-0.009).
Table 3
Results of the effects of time and ranking and their interaction on the previously identified factors.
Figure 1 displays that, compared with the 2012 season, the scores of Factor 1 (-0.03 vs. 0.35, p < 0.01, Effect Size: ES = 0.38), and Factor 3 (-0.12 vs. 0.28, p < 0.01, ES = 0.42) increased in the 2017 season, and the scores of Factor 4 (0.26 vs. 0.05, p = 0.018, ES = -0.21) and Factor 5 (0.13 vs. -0.35, p < 0.01, ES = -0.48) decreased in the 2017 season. Factor 2 increased from the 2012 to the 2014 season (-0.06 vs. 0.14, p = 0.028, ES = 0.20), but decreased from the 2014 to the 2017 season (0.14 vs. -0.19, p < 0.01, ES = -0.35). The score of Factor 6 did not show a clear trend across the six seasons (0.03 vs. 0.13, p = 0.182, ES = 0.16)..
Discussion
The aim of the current study was to identify and measure playing styles used by the CSL teams during a six seasons period (from 2012 to 2017); and to investigate the evolution of styles of play during the seasons under analysis. As it was hypothesised, this study identified specific playing styles based on physical and technical-tactical indicators that varied along the seasons as an adaptation of teams to perform at the highest level in the competition. To the best of our knowledge, although some research has described partially different styles of play in elite soccer (Fernandez-Navarro et al., 2016; Hewitt et al., 2017; Lago-Peñas et al., 2018), no previous study has examined the longitudinal evolution of the different playing styles used by teams and their association with the success. The current study identified 7 factors from the PCA: Factor 1 (high intensity play), Factor 2 (possession and passing), Factor 3 (offensive actions), Factor 4 (defensive actions), Factor 5 (individual challenges), Factor 6 (serious fouls) and Factor 7 (attacking aggressively). These findings may allow coaches and analysts to differentiate between teams’ playing styles in order to recognize their own and their opponents’ strengths and weaknesses. Additionally, this information allows the team to use this knowledge to prepare appropriate tactics and strategies during league competition (Fernandez-Navarro et al., 2016; Gomez et al., 2018; Lago-Peñas et al., 2018). The PCA results showed positive or negative scores for the 7 factors determining how much a team relies on one specific style or a combination of these styles of play. For example, in the CSL, the style of play of Shandong Luneng was based on high intensity activities (Factor 1) and offensive actions (Factor 3). Conversely, high scores of Guangzhou R&F on Factor 2 reflected a possession playing style based on ball possession and passing.
The findings of the current study highlight the longitudinal changes of the styles of play used by teams across the 6-season period in the CSL. High intensity play (Factor 1), possession and passing (Factor 2) and offensive actions (Factor 3) were considered very important components of the playing patterns adopted by the Chinese teams. Although the score of Factor 1 fluctuated along the seasons, the overall trend showed an increase. The score of Factor 2 reflected highs and lows over the seasons, with highest values in the 2014 season. Factor 3 presented an increasing trend across the seasons. These performance changes may be due to two reasons. On the one hand, a commonly held belief is that the increased migration of non-Chinese players into the CSL could account for these alterations in technical, tactical and physical performance. In fact, it is plausible that non-Chinese players have encouraged the evolution in the Chinese players’ physical and technical performance. Bush et al. (2015) found that the English Premier League underwent substantial changes over the last decade with the distances covered at high intensity and sprinting increasing by 30-50% and the number of passes rising by 40%. According to those authors, the increased proportion of non-UK players in the English Premier League could be behind this evolution. On the other hand, some of the physical and technical developments may be driven by the fact that the styles of play of the last winners of the UEFA Champions League (Real Madrid and F.C. Barcelona) or the World Cup (Spain and Germany) were based on ball possession, an aggressive defensive strategy in order to recover the ball as soon as possible and close to the opponent’s goal, and spend more time attacking in the opponent’s half (Fernandez-Navarro et al., 2016; Hewitt et al., 2017). In particular, top teams preferred to “control” the match dictating their style of play instead of giving the initiative to their opponents (Collet, 2013). According to this rationale, the “winning formula” of successful teams may suggest changes over time according to the way the game is played (Lago-Peñas et al., 2018; Wallace & Norton, 2014).
The changes of playing styles from season to season are closely linked to the variation of their associated PI. In particular, the season by season increasing scores for Factors 1 (high intensity play) and 3 (offensive actions such as crosses, shots on target or opponent penalty area entries) may reflect the actual physical and technical performance requirements in the CSL (Zhou et al., 2020). Passing performance was better in 2013 and 2014 seasons than in other seasons, the number of passes and passing accuracy decreased continuously from the 2014 to the 2017 season (Zhou et al., 2020). These results are consistent with the findings of the current study, where the score of Factor 2 (possession and passing) decreased along the seasons. There is evidence to suggest a performance advantage in elite soccer when playing at increasing speed and considering the number of high intensity actions, particularly at times when moving closer to the goal and during phases of transition from defending to attacking. Vogelbein et al. (2014) analysed matches in the German Bundesliga and demonstrated that top teams recovered the ball quicker after losing it in comparison to lower ranked teams. They also found that the current score influenced the defensive timing. Other studies have shown an advantage in recovering ball possession as close to the goal as possible in order to increase goal scoring opportunities (Lago-Ballesteros et al., 2012; Tenga, Holme, et al., 2010b; Tenga, Ronglan, et al., 2010). Ball recoveries closer to the attacking goal produced seven times more goals and nineteen times more reaches to the score-box (Tenga, Holme, et al., 2010a; Tenga, Ronglan, et al., 2010) compared to ball recoveries in the defensive zones. Moreover, it has been demonstrated that the amount of high intensity play is related to the overall success of the team (Aquino et al., 2017; Zhou et al., 2018). This is consistent with research showing the need for high intensity running and repeated sprinting ability in the actual game and how these behaviours have increased compared to previous decades (Wallace & Norton, 2014).
In addition, our results demonstrate a strong association between the end-of-the season ranking of teams and the playing styles used with successful teams adopting styles of play focused on Factor 2 (possession and passing), Factor 3 (offensive actions), and Factor 7 (attacking aggressively). The results of the current study highlight the increasing physical and technical demands of the CSL. Although team’s success is complex and multifactorial, high intensity activities and the use of styles of play based on ball possession may be highly related to the success.
With regard to the limitations of the current study, several aspects should be highlighted. Firstly, due to data source limitations, more physical, technical-tactical, and positional related variables should be used to identify playing styles in further studies (Gomez et al., 2018; Lago-Peñas et al., 2018). Secondly, the analysis of interactive effect of contextual-related variables (e.g. match location, the opposition level and the score-line) need to be addressed to identify their impact on the styles of play used by teams. Lastly, different countries and competitions should be analysed in order to verify if the current results are specific to the CSL or can be similar to other international leagues and competitions.
Conclusions
In conclusion, this study combined the use of physical and technical-tactical PI related to space and possession of the ball to determine soccer team’s playing styles. In fact, this is the first study examining the long-term trends of playing styles in a professional soccer league (CSL). Seven factors were identified to show the teams’ playing styles (high intensity play, possession and passing, offensive actions, defensive actions, individual challenges, serious fouls, attacking aggressively). Specifically, the score of Factor 1 (high intensity play) fluctuated across the seasons; Factor 2 (possession and passing) reached the highest value in 2014; and Factor 3 (offensive actions) presented an increasing trend along the seasons. These results reflected that over the 6-season period studied, physical, technical and tactical demands of CSL soccer increased, particularly in terms of high intensity activities and offensive actions. The identification and understanding of team’s playing styles or patterns of play may have some practical implications, for example, when: (i) preparing training and competition based on high-intensity running and offensive actions required in the league or (ii) recruiting players who can meet the team's tactical or playing style requirements based on PI. The current findings may allow coaches and analysts to classify the teams into different playing styles. Furthermore, long-term trends of styles of play can show the performance idiosyncrasy of the CSL; and finally, findings can summarize the changing trends of playing styles for a particular team. Coaches can use this information for targeted training and tactical preparation.