Introduction
Wheelchair basketball is one of the most popular Paralympic sports. It was devised as a rehabilitation activity for American soldiers injured during World War II, but quickly spread to other parts of the world. It is currently played in over 80 countries and is one of the most watched Paralympic sports.
Rules of wheelchair basketball are very similar to those of running or stand-up basketball, referred to hereafter as simply “basketball”. The games are played on the same-sized courts with identical basket heights and scoring systems. The main difference is that in wheelchair basketball, players must dribble, pass the ball or shoot after pushing their wheelchair twice (IWBF, 2017). Wheelchair basketball teams also have 12 players, with a maximum of five allowed on the court at any time. Players are classified according to functional ability, i.e., their ability to perform the activities required by the game (García-Fresneda and Carmona, 2021). They are classified using a scoring system ranging from 1.0 to 4.5 (1.0, 1.5, 2.0, etc.). The lowest score, 1.0, is assigned to players with little or no control over trunk movement in any of the planes, while the highest score, 4.5, is assigned to players who tend to have normal trunk movement and no apparent weaknesses in any direction (IWFB, 2014). The sum of scores for the five players on the court at any given time cannot exceed 14 points (IWBF, 2017).
Although Paralympic sports are still a long way from attracting the level of research interest enjoyed by elite sport, numerous aspects of wheelchair basketball have been analyzed in recent years (Perret, 2017), including biomechanics (Marjolaine et al., 2018), physiology (Marszałek et al., 2019), physiotherapy (Veeger et al., 2019), motor skills (de Witte et al., 2018), psychology (Qasim et al., 2019), and sociology (Molik et al., 2017).
Match analysis studies have also been conducted in wheelchair basketball (Francis et al., 2019a, 2019b; Gómez et al., 2014), and studies which have investigated the influence of functional ability on performance by male (Skučas et al., 2009) and female (Vanlandewijck et al., 2004) players have reported comparable performance levels between similar functional categories. They have also found that players in higher categories (players with fewer functional limitations) have a more instrumental role in the game.
Building on previous work, the aim of this study was to use log-linear analysis to analyze efficiency in wheelchair basketball according to players’ functional ability from the perspective of three dimensions: position of the last pass before a shot, shot position, and shot result (favorable or unfavorable).
Methods
Within the framework of an observational methodology study (Anguera, 1979; Anguera et al., 2017), we applied a point, intrasessional, idiographic, multidimensional design (Anguera et al., 2011). The design was point (strictly speaking, focusing on one moment in time) because we studied performance of the gold medal winners (the US team) in men’s wheelchair basketball throughout the different phases of the 2016 Rio de Janeiro Paralympic Games. In observational methodology, a point design is typically used to analyze single matches, but it was appropriate in this case as we analyzed all the matches played by the US team as a whole, synchronously. The follow-up was intrasessional, as we conducted a frame-by-frame analysis of all behaviors which occurred in offensive sequences of play ending in a shot by the US men’s wheelchair basketball team. Finally, the design was idiographic because we only analyzed one team and multidimensional, because we studied different dimensions of proxemic behaviors (related to where on the court they occurred) and gestural behaviors (related to technical-tactical actions) contemplated in the observation instrument used.
Participants
We studied all offensive sequences of play which ended in a shot by the US men's wheelchair basketball team at the 2016 Paralympic Games in Rio de Janeiro. According to the official competition log, which records players’ jersey numbers (which do not change during the competition) and functional category, there were two 1.0-point players (12 and 13), one 2.0-point player (42), three 2.5-point players (2, 16 and 20), one 3.0-point player (5), three 3.5-point players (4, 9, and 11), and two 4.5-point players (8 and 15).
The distribution of players’ positions according to functional ability was similar to positions reported in other studies which have analyzed this association (de Witte et al., 2016; Vanlandewijck et al., 2004). Pérez (2012) additionally analyzed the influence of anthropometric profiles on the players’ position. In brief, 1.0- and 1-5-point players play as guards, 2.0- and 2.5-point players play as forwards, and 40- and 4.5-point players play as pivots. Considering that the main positions in wheelchair basketball coincide with those of basketball (de Witte et al., 2017), pivots mainly play under the basket and use a high seat, while forwards and, in particular, guards use a lower seat height to favor maneuverability and acceleration.
Footage of all the matches played by the US team during the 2016 Paralympics was obtained from the open International Paralympic Committee video channel (https://www.youtube.com/user/ParalympicSportTV). The details of the matches are summarized in Table 1. The study was approved by the research ethics committee at the University of La Rioja (file number 25238).
Table 1
Matches played by the US wheelchair basketball team at the 2016 Rio de Janeiro Paralympic Games.
Observation instrument
The observation instrument used was a version of that used by Alsasua et al. (2019) to analyze offensive sequences ending in a shot in professional and elite under-16 basketball which we adapted to include jersey numbers and players’ classification (Table 2). The original version of the instrument was the SOBL-2 instrument designed by Fernández et al. (2009).
Table 2
Observation instrument
The observation instrument was loaded into the Lince software program (Gabin et al., 2012) for data annotation and coding. Data were annotated and coded by two observers, i.e., a main observer and a second observer who completed 10% of the sequences for the data reliability study, duly trained using the method described by Anguera (2003). For all sequences analyzed, the observers made a note of when and where each action happened. The resulting data, taking into account that the observational design was multidimensional, were therefore concurrent, time-based type IV data (Bakeman, 1978).
Data reliability
Interobserver agreement was analyzed to check the reliability of the data used to conduct this study. Agreement was assessed by calculating Cohen's Kappa statistics for 10% of the sequences annotated for each match. This analysis was performed in Lince. The resulting statistics were all over 0.87, which according to the criteria of Landis and Koch (1977) indicates “almost perfect” interobserver agreement. The kappa statistics by match were 0.889 for Brazil-USA, 0.888 for USA-Germany, 0.910 for USA-Iran, 0.891 for Algeria-USA, 0.883 for USA-Great Britain, 0.877 for USA-Netherlands, 0.913 for Turkey-USA, and 0.936 for Spain-USA.
Data analysis
Log-linear analysis was used to investigate interactions between three dimensions: position of the last pass before a shot (last pass position), shot position, and shot result according to players’ classification, which ranged from PC1.0 for players in the lowest functional category to PC4.5 for those in the highest functional category. The goal of log-linear analysis was to select the most parsimonious model capable of explaining the distribution of cell frequencies in a corresponding contingency table (López-Roldán and Fachelli, 2015). We built six hierarchical models: one for each of the functional categories in our sample.
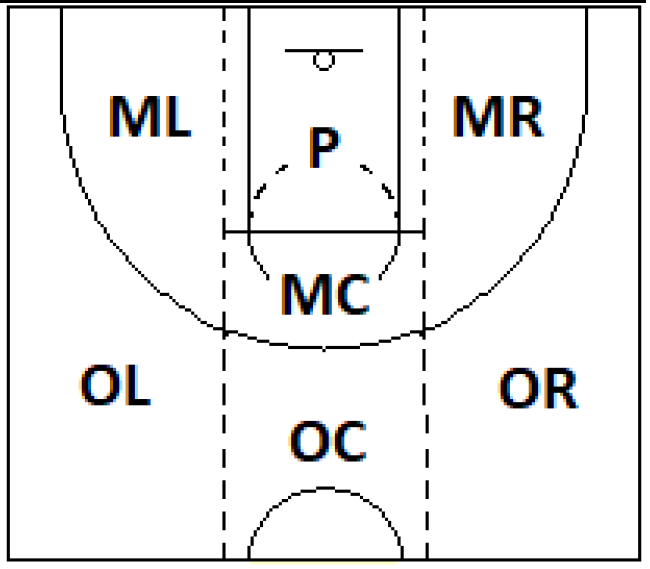
The log-linear analysis was performed in three phases. In the first phase, the model that best fitted the data in each case was selected through hierarchical stepwise backward elimination of non-significant effects. In this hierarchical process, conducted in SPSS v. 22.0, models with higher-order parameters must necessarily include all lower-order parameters (López-Roldán and Fachelli, 2015). The second phase consisted of estimating the parameters for the six best-fit models selected in phase 1. The general log-linear analysis feature in SPSS v. 22.0 was used to quantify the magnitude of each effect in all the models. To this end, however, it is first necessary to create dummy codes in the program using a reference category for each dimension. In our case, the reference categories were the outer central corridor for the last pass position, paint for the shot position, and favorable outcome for the shot result. The resulting parameters were expressed as neperian logs, and as such, the exponential function (or anti-logarithm) of the estimated parameters were the equivalent of odds and odds ratios for the different categories in the dimensions. These logs quantified the magnitude of each of the effects. In the third phase, we interpreted the effects of all the significant parameters in each of the six models.
Results
Four of the models, corresponding to offensive sequences ending with a shot by a PC1.0, PC2.0, PC3.0, or PC4.5 player, were independent models, as no significant interactions between the dimensions were observed (López-Roldán and Fachelli, 2015). The only marginal effect in the PC1.0 and PC3.0 models was the shot position. The PC2.0 model showed a marginal effect for the last pass position and shot position, while the PC4.5 model showed a marginal effect for the last pass position, the shot position, and the shot result. The PC2.5 model was a partial independence model, as it featured a significant interaction between the last pass position and the shot position which was independent of the shot result. Finally, the PC3.5 model was a conditional independence model containing two sets of dimensions, i.e., the last pass position and the shot position and the shot position and the shot result, independently associated with the shot result and the last pass position, respectively.
Parameters estimated for each of the best-fit models in the second phase of the log-linear analysis are shown in Table 3. In addition to our explanation below of how to interpret the data in this table, we created two Figures which show our findings in a graphic format (Figures 1 and 2).
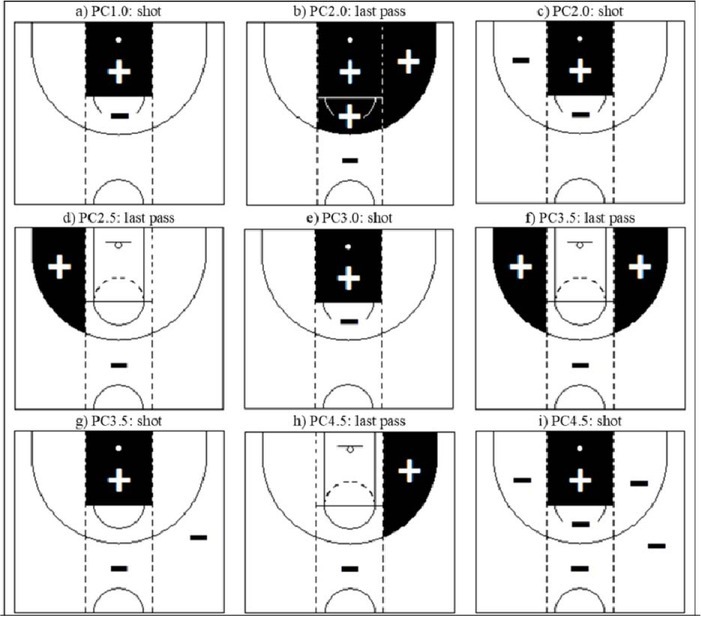
Table 3
Estimation of significant parameters in the best-fit model for each functional category.
The exp (  ) values in the fourth column of Table 3 provide the key to interpreting the results of the log-linear analysis. In brief, categories with a value higher than 1 were significantly more likely to occur than their corresponding reference category and the specific value indicates the likelihood of this happening. For example, the exp (
  ) value of 7.001 in the second row means that a PC2.0 player was seven times more likely to take a shot after receiving a pass from the middle of the right corridor than from the outer central corridor. Values below 1, in turn, indicate decreased likelihood of a given category occurring compared with the reference category. Taking the example from the first row of Table 3, the exp (
  ) value of 0.91 means that a PC1.0 player was 0.91 times less likely to shoot from the middle of the central corridor than from the paint. When interpreting results, it can help to use the inverse of exp ( ) -1/exp ( - as this indicates the increased likelihood of the reference category occurring in relation to a given category. Taking the same example as before, the 1/exp (
  value for exp ( ) 0.091 is 11.001, which indicates that PC1.0 players were 11.001 times more likely to shoot from the paint than from the middle of the central corridor.
In the following section, we provide an interpretation of the first- and second-order effects of the significant parameters according to the functional ability of the player taking the shot.
As mentioned in the example above, PC1.0 players were less likely to take a shot from the middle of the central corridor than from the paint (1/exp ( ) = 11.001). See Figure 1a for a graphic representation.
Passes leading up to a shot by PC2.0 players were more likely to come from the middle of the right corridor (exp ( ) = 7.001), the paint (exp (  ) = 6.001), or the middle of the central corridor (exp (
  ) = 4.998) than from the outer central corridor (Figure 1b). In addition, shots by these players were less likely to be taken from the middle of the left corridor (1/exp (
  ) = 3.999) or the middle of the central corridor (1/exp (
  ) = 3.001) than from the paint (Figure 1c).
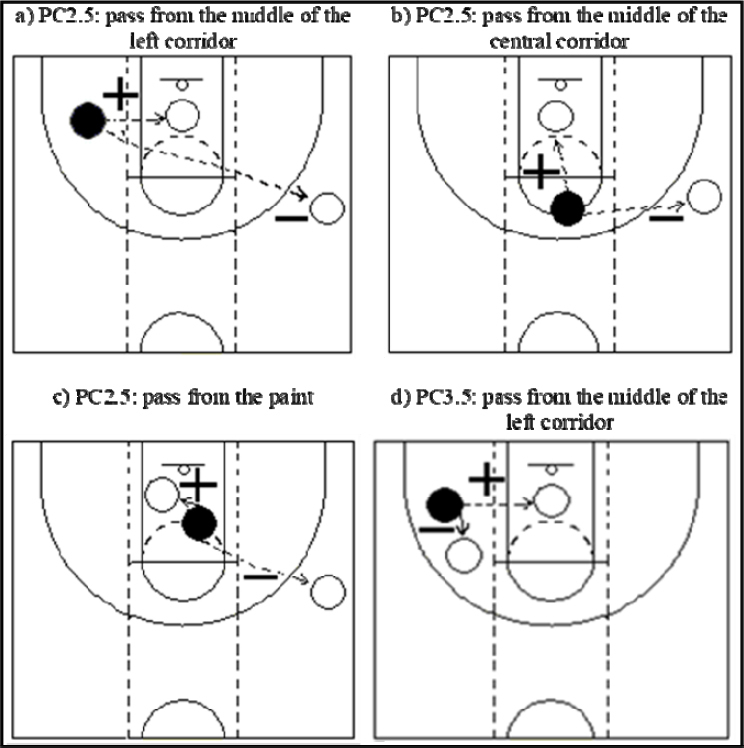
With regard to PC2.5 players, passes ending in a shot were more likely to come from the middle of the left corridor (exp ( ) = 3.001) than from the outer central corridor (Figure 1d). We also observed significant second-order interactions between the last pass position and the shot position in this category, with players less likely to take a shot from the outer right corridor (1/exp ( ) = 13.001) than from the paint after receiving a pass from the middle of the left corridor (Figure 2a). When the pass was made from the middle of the central corridor, by contrast, there was greater likelihood of them shooting from the outer right corridor (1/exp (  ) = 9.152) than from the paint (Figure 2b). Finally, passes from the paint were less likely to end in a shot from the outer right corridor (1/exp ( ) = 11.078) than from the paint (Figure 2c).
PC3.0 players were less likely to shoot from the middle of the central corridor (1/exp (  ) = 3.999) than from the paint (Figure 1e).
Analyzing offensive sequences ending in a shot by PC3.5 players, we observed that shots were more likely to be preceded by a pass from the middle of the right (exp ( ) = 3.200) or left corridor (exp (  )=3.001) than by a pass from the outer central corridor. In terms of the shot position, PC3.5 players were less likely to shoot from the outer right corridor (1/exp (
  ) = 11.787) or the outer central corridor (1/exp (
  )=9.826) than from the paint (Figure 1f). Finally, shots by these players were more likely to have a favorable than an unfavorable result (1/exp (
  ) = 3.666). We also observed two significant second-order interactions in the PC3.5 model: one between the last pass position and the shot position and another between the shot position and the shot result. In the first case, passes from the middle of the left corridor were less likely to end in a shot from this area of the court (1/exp ( ) = 14.999) than from the paint (Figure 2d). In the second case, shots were more likely to have an unfavorable result when taken from the outer left corridor (1/exp (
  ) = 18.338), the outer right corridor (1/exp (
  ) = 7.330), and the outer central corridor (1/exp (
  ) = 5.501) than from the paint. The same was observed for shots taken from the middle of the left (1/exp (
  ) = 4.683) and right (1/exp (
  ) = 3.666) corridors.
Finally, in PC4.5 players, who had the fewest movement restrictions, passes leading up to a shot were more likely to come from the middle of the right corridor (exp (  ) = 3.168) than from the outer central corridor (Figure 1h). In addition, these players were less likely to shoot from the middle of the central corridor (1/exp (
  ) = 62.992), the outer right corridor (1/exp (
  ) = 31.500), the outer central corridor (1/exp (
  ) = 21.010), the middle of the right corridor (1/exp (
  ) = 15.753), and the middle of the left corridor (1/exp ( ) = 15.753) than from the paint (Figure 1i). Finally, as in the previous category, shots taken by PC4.5 players were more likely to have a favorable outcome (1/exp (
  ) = 1.655).
Discussion
The observation instrument used in this study of offensive sequences ending in a shot by the US men’s wheelchair basketball team at the 2016 Paralympic Games in Rio de Janeiro has been previously used to analyze offensive sequences and efficiency in both professional (Alsasua et al., 2019; Fernández et al., 2009) and grassroots basketball (Alsasua et al., 2018). We adapted the instrument to account for functional ability, as this has been found to be a determinant of performance in wheelchair basketball (Gómez et al., 2014; Vanlandewijck et al., 2004).
Our study shows the potential offered by log-linear analysis in the field of observational methodology (Anguera, 1979; Anguera et al., 2017). Log-linear analysis permits investigation of higher-order interactions between dimensions which generate categorical data. It is therefore suitable for investigating interactions between three or more dimensions using multidimensional contingency tables (Eom and Schutz, 1992).
Examination of significant first-order effects in our study (Figures 1 and 2) showed that passes leading up to a shot were more likely to be made from middle areas (middle of the right corridor in PC4.5 players, middle of the left corridor in PC2.5 players, middle of the right and left corridors in the PC3.5 players, and middle of the right and central corridors in PC2.0 players than from the outer central corridor. This observation contrasts with findings from professional basketball showing that passes ending in a shot are significantly more likely to be made from outer areas of the court (Marmarinos et al., 2015). We also observed that shots by PC2.0 players were more likely to be preceded by a pass from the paint than from the outer central corridor. This result is consistent with the findings of Alsasua et al. (2019), who, using the same methodology and observation instrument as the Authors of this study to analyze efficiency in professional basketball, found that the paint was the only part of the court from which a pass ending in a shot was more likely than a pass from the outer right corridor.
Our analysis of marginal and first-order interactions also showed that for PC1.0 and PC3.0 players, the only place from where a shot was less likely than from the paint was the middle of the central corridor. Considering PC2.0 players, shots from the middle of the central corridor and the middle of the left corridor were also less likely than shots from the paint. These observations are consistent with findings showing that professional basketball players are less likely to shoot from middle areas of the court than from other areas (Alsasua et al., 2019). We also observed that PC3.5 players were less likely to shoot from the outer right corridor and the outer central corridor than from the paint. Again, this observation coincides with findings from a study of shots taken after direct blocks in professional basketball (Nunes et al., 2015). The results observed for players of the highest functional category (PC4.5 players) were most similar to those reported by Alsasua et al. (2019) in their log-linear analysis of professional basketball. Overall, players were more likely to take a shot from the paint than from any other area of the court except the outer left corridor in wheelchair basketball and the outer right corridor in professional basketball.
The final observation in our analysis of first-order effects was that shots were more likely to have a favorable result when taken by PC3.5 or PC4.5 players. In addition, the efficiency of these shots was similar to that reported for professional basketball players (Alsasua et al., 2019; Fernández et al., 2009).
Our analysis of second-order interactions for PC2.5 players showed that passes from the middle of the left corridor were less likely to end in a shot from the outer right corridor than from the paint. This observation is also consistent with reports by Alsasua et al. (2009) who showed that professional players located in the outer right corridor were less likely to shoot when passed the ball from the outer left corridor or the middle of the right corridor. We observed that PC3.5 players in the middle of the left corridor were significantly less likely to shoot following a pass from a player in the same area than from a player in the paint. Both of these observations are consistent with previous findings showing that short distances between passers and shooters have a negative effect on shot efficiency (Ortega and Gómez, 2009).
We also observed that following a pass from the middle central corridor, PC2.5 players were less likely to shoot from the outer right corridor than from the paint, supporting findings from professional basketball showing that passes ending in a shot are not typically made from the middle of the central corridor (Fernández et al., 2009). Passes from the paint were also significantly less likely to end in a shot from the outer central corridor than from the paint in the PC2.5 category. Alsasua et al. (2019) reported similar findings for professional basketball, and Serna et al. (2017) found that passes from one player to another in the paint following a direct block were more likely to end in an effective shot.
When analyzing the outcomes of shots taken by PC3.5 players, we observed that shots taken from any area of the court except the middle central corridor were less likely to have a favorable outcome than shots taken from the paint. Again, this finding was reported by Alsasua et al. (2019) in their log-linear analysis of professional basketball.
In conclusion, of all the models analyzed, only PC2.5 and PC3.5 models showed first-order effects, i.e., interactions between the last pass position, the shot position, and the shot result. The statistically significant results obtained, which largely corresponded to first-order effects, support previous findings showing that wheelchair basketball players with fewer movement restrictions have a more instrumental role in the game (Skučas et al., 2009; Vanlandewijck et al., 2004). In addition, the results observed for offensive sequences ending in a shot by PC3.5 and PC4.5 players are closest to those reported by Alsasua et al. (2019) in a similar study of professional basketball players. The corresponding models were also the only models to show significant effects in efficiency, again coinciding with findings for professional basketball (Fernández et al., 2009). This observation indicates a need to further investigate the association between running and wheelchair basketball.