Introduction
The one-repetition maximum (1RM) test, a reliable measure of muscular strength for compound movements (i.e., back squat and bench press) (Seo et al., 2012), can be used to track strength progress and to calculate percentage-based loading (Fleck and Kraemer, 2004). However, various issues exist with conducting a 1RM test. Specifically, performing a 1RM test can be time consuming, unnecessarily fatiguing (Helms et al., 2018), and potentially unsafe for novice athletes who have not achieved technical proficiency in the compound movements (Niewiadomski et al., 2008; Gepfert et al., 2019). Furthermore, the above limitations are especially relevant when attempting to assess 1RM in large groups of athletes (American College of Sports Medicine, 2009). Alternatively, a 1RM can be predicted; however, the utility of the prediction depends upon its accuracy. If a 1RM prediction is inaccurate, then a percentage-based load prescription could lead to an athlete failing to complete the prescribed number of repetitions.
The two main types of 1RM prediction are: 1) repetitions performed equations, and 2) velocity prediction methods. Repetitions performed equations utilize the number of repetitions lifted at a given load to predict the 1RM. DiStasio (2014) reported that the Epley (1RM=load(kg)×(1+0.0333×reps)) and Brzycki (1RM=load(kg)/(1.0278+0.0278×reps)) equations accurately predicted a back squat 1RM to within 2.7 and 3.1kg from a 5RM and a 3RM test (p>0.05), respectively (Brzycki, 1993; DiStasio, 2014). Reynolds et al. (2006) observed more accurate 1RM prediction on the chest press and leg press from repetitions performed equations when using a 5RM load versus 10 and 20RM loads. Therefore, repetitions performed equations only seem to be accurate when using fatiguing loads close to a 1RM, which does not rectify the limitations of a 1RM test.
Predicting 1RM value with submaximal velocities does not require the athlete to use fatiguing loads and can save considerable time. Velocity 1RM predictions are conducted by having the athlete perform repetitions at submaximal loads and then using regression equations to forecast the 1RM from the obtained average concentric velocity (ACV) values. Indeed, submaximal velocity forecasts have accurately predicted a 1RM value on machine-based movements (García-Ramos et al., 2018). Specifically, García-Ramos et al. (2018) observed a 2-point submaximal velocity forecast using ACVs of 1.00m⋅s-1 (~46% of 1RM) and 0.50m⋅s-1 (~77% of 1RM) to produce nearly perfect 1RM predictions (actual – predicted 1RM=0.4±3.0kg) in the Smith machine bench press. However, Banyard et al. (2017) who instructed participants to move the barbell as fast as possible, found significant differences between actual and predicted 1RMs (r=0.73-0.93, p<0.001) using 3-, 4-, and 5-point velocity methods in the free-weight back squat. Conversely, Jiménez-Alonso et al. (2020) who, similarly to Banyard et al. (2017), provided subjects with a maximal intended velocity cue, reported no significant difference (p=0.80) between the predicted and the actual 1RM in the free-weight bench press using a 2-point prediction method (i.e., ACVs at ~40% and ~85% of the 1RM). Additionally, Ruf et al. (2018) observed 3-, 4-, and 5-point forecasts to over-predict a deadlift 1RM by 5-10kg while also instructing subjects to lift the barbell with maximal effort. Although using submaximal ACV to predict a 1RM can rectify the limitations of a 1RM test, there is currently a lack of consistency between studies in terms of both methodology and prediction accuracy, and results are equivocal on free-weight barbell exercises. Since recent data (García-Ramos et al., 2018) have shown 2- and 4-point equations to accurately predict a squat and a bench press 1RM, those equations warrant further investigation.
Additionally, studies utilizing the Smith machine (García-Ramos et al., 2018) or machine-based exercises have typically included cues instructing participants to move the barbell with maximal effort (Pérez-Castilla et al., 2019). Thus, it is crucial to examine the accuracy of submaximal velocity to predict a 1RM on free-weight exercises without a maximal effort cue to increase ecological validity of the prediction. Therefore, the purpose of this study was to assess the accuracy of using both 2- and 4-point velocity forecasts to predict a 1RM in the free-weight back squat and bench press in well-trained men. We hypothesized that both methods would accurately predict the 1RM.
Methods
Participants
Seventeen males between the ages of 18-40 participated in the study (Table 1). For inclusion, participants must have trained the back squat and bench press for ≥2 years and had a 1RM squat of ≥1.5 times body mass, and a 1RM bench press of ≥1.25 times body mass as determined by a physical activity questionnaire. Furthermore, participants who had contraindications to exercise (i.e., heart disease, hypertension, diabetes, etc.) as determined via a health history questionnaire were excluded. Participants provided written consent prior to participation. This study was performed in accordance with the ethical standards of the Helsinki Declaration and the University’s Institutional Review Board approved this investigation.
Design and Procedures
Participants reported to the laboratory on one day and performed a 5-min dynamic warm-up followed by a squat-specific warm-up and a squat 1RM test. Following squat 1RM testing, participants were given 10-min of rest before performing a bench press-specific warm-up and a bench press 1RM test. All 1RM testing was performed in accordance with previously validated procedures (Zourdos et al., 2016). On every warm-up and every 1RM attempt, ACV (m.s-1) was recorded. Submaximal ACV values were used to predict a 1RM with 2- and 4-point equations. Subsequently, the 1RM predictions and the actual 1RM were compared to determine the accuracy of the prediction methods.
Measures
Anthropometric Assessments
Total body mass (kg) was assessed by a calibrated digital scale (Mettler-Toledo, Columbus, Ohio, USA) and each participant’s height (cm) was measured via a wall-mounted stadiometer (SECA, Hamburg, Germany). The body fat content was estimated using the average sum of two skinfold thickness measurements acquired from three sites (chest, abdomen, anterior thigh) (Jackson and Pollock, 1978). If any measurement was >2mm different than the previous measure, a third thickness was taken and the closest two were averaged. The Jackson and Pollock equation (Jackson and Pollock, 1978) was used to estimate the body fat percentage and the same investigator took all measurements.
Back Squat and Bench Press Technique
The back squat and bench press were performed in accordance with International Powerlifting Federation standards (International Powerlifting Federation, 2019). For the squat, participants stood straight with the hips and knees locked, and the barbell placed across the upper back/shoulders. Upon the investigator’s command of “squat” participants descended until the hip joint was below the top of the knee. Then, participants volitionally returned to the starting position. A “rack” command was then issued to re-rack the barbell. Participants were given no other commands to increase ecological validity. During the bench press, participants laid supine on a weight-bench, maintaining five points of contact (head, buttocks, and both shoulders on the bench, and both feet flat). Participants removed the barbell from the rack and held it with arms extended. Investigators issued a “start” command upon which participants lowered the barbell until it contacted the chest and was then pressed upwards until the arms were fully extended. A “rack” command was then issued to re-rack the barbell.
One Repetition Maximum (1RM) Testing
All 1RM testing was performed in accordance with previously validated procedures (Zourdos et al., 2016). Specifically, all participants first completed a 5-min dynamic warm-up followed by a squat-specific warm-up consisting of as many repetitions as desired with an empty barbell. Next, participants performed 5 repetitions with 20% of their estimated 1RM, followed by 50% for 3 repetitions, 70% for 2 repetitions, and 80% of 1RM for 1 repetition. Following the 80% of the estimated 1RM warm-up, participants were given 3-5min of rest before a final warm-up at a load determined by the investigators (between 85-90% of the estimated 1RM). Following the final warm-up, participants took 5-7min of rest while the investigators determined the load for the first 1RM attempt. The load was increased on each subsequent attempt until a 1RM was reached and 5-7min of rest were given between each attempt. On every warm-up and 1RM attempt repetitions in the reserve-based rating of perceived exertion (RPE) (Zourdos et al., 2016) and ACV were collected to aid in attempt selection. Following 1RM testing on the back squat, a 10-min rest interval was given and then an identical protocol followed for the bench press. Both the eccentric and concentric movement tempos were volitional as a volitional or a preferred tempo has been shown to maximize 1RM performance (Wilk et al., 2020). A 1RM was accepted as valid if one of three conditions was met: (a) a participant reported a “10” on the RPE scale and the investigators determined an additional attempt with an increased load would be unsuccessful, (b) a participant reported a “9.5” RPE and then proceeded to the subsequent attempt with a load increase of 2.5kg or less, and (c) a participant reported an RPE of 9 and failed the subsequent attempt with a load increase of 5kg or less. Finally, Eleiko barbells and lifting discs (Chicago, Ill., USA) calibrated to the nearest 0.25kg were used for all 1RM testing.
Velocity Assessment
The Open Barbell System Version 3 (OBS3) (Squats & Science, New York, N.Y., USA) is a linear position transducer and was used to assess velocity during all warm-up and 1RM attempts. The OBS3 has a velocity sensor and a display unit. The OBS3 was set on the floor to the right side of the participant and attached to the barbell using a Velcro strap, via a cord, just inside the “sleeve”. The OBS3 has been previously validated for ACV (Goldsmith et al., 2019).
One-Repetition Maximum (1RM) Prediction
The 1RM was predicted using both 2-point (2 submaximal ACV values) and 4-point (4 submaximal ACV values) velocity methods. For the 2-point method, the ACV values in the warm-up closest to 1.0m⋅s-1 (±0.1m⋅s-1) and 0.50m⋅s-1 (±0.1 m⋅s-1) were utilized in the analysis of the 2-point as previously described (García-Ramos et al., 2018). For the 4-point method, ACV values were back-calculated to find that closest to 20, 50, 70, and 80% of the 1RM similarly to previous procedures (Banyard et al., 2017). When more than one repetition was performed during a warm-up set (i.e., 20 and 50% of 1RM), the fastest ACV value was used. To predict the 1RM, each participant’s extracted ACVs were entered into Microsoft Excel (Microsoft Corporation, Redmond, W.A., USA) alongside the corresponding load lifted. Next, individualized linear regression forecasts predicted the ACV for any subsequent load entered into the spreadsheet. The load which then corresponded to the ACV value that was recorded during the actual 1RM was designated as the predicted 1RM for each individual regression equation. A linear regression forecast was used as recent data observed a 4-point linear regression forecast to predict a bench press 1RM more accurately than a 4-point polynomial method and 2-point linear and polynomial 1RM predictions were similar (Janicijevic et al., 2021). Furthermore, the velocity-load relationship is remarkably linear (Helms et al., 2016; Zourdos et al., 2016).
Statistical Analysis
The agreement between the predicted and actual 1RMs was evaluated using multiple graphical representations, Bland-Altman plots (Bland and Altman, 1986) and folded empirical cumulative distribution plots (mountain plots) (Krouwer and Monti, 1995; Monti, 1995). Furthermore, a one-way repeated measures analysis of variance (ANOVA), intraclass correlation coefficients (ICCs) and their associated 95% confidence intervals (CIs) (based on a single-rater, absolute agreement, two-way mixed-effects model) (Koo and Li, 2016), and standard error of measurement (SEM) were used to compare the predicted and actual 1RM values. Paired t-tests were used for multiple comparison purposes. A Pearson’s product moment correlation was used to determine the relationship between the predicted and actual 1RMs. To determine the magnitude of difference between predicted and actual 1RMs, Hedges g effect sizes (ES) were calculated as ES=[(1RM_mean–2-point_mean)/SDpooled] and ES=[(1RM_mean–4-point_mean)/SDpooled], then a small sample size correction was used (Hedges, 2016). The ES magnitudes were interpreted in accordance with Cohen (1988). MATLAB (MathWorks, Inc., Natic, MA. USA) was used to conduct the ANOVA, calculate the ICCs, and to produce the Bland-Altman and Mountain plots. Microsoft Excel was used to conduct the linear regression forecasts. Interpretation of the ICCs was based on the following: <0.5 poor, 0.5-0.75 moderate, 0.75-0.90 good, and >0.90 excellent agreement (Koo and Li, 2016). The SEM was calculated as: SEM=SD
Results
Actual Average Concentric Velocity (ACV) Values
Data for one participant were unusable for the 4-point prediction in the bench press, therefore, 17 participants were included in the squat predictions and 2-point bench press predictions, while 16 participants were included in the 4-point bench press prediction. The means of the ACVs entered into both the 2-point and 4-point equations and the corresponding percentages of 1RM are presented in Table 2.
Table 2
Actual ACV Values and Corresponding Percentages of 1RM
One-Way Repeated Measures Analysis of Variance
The actual 1RM and predicted 1RM values are presented in Table 3. The ANOVA demonstrated a significant main effect (p < 0.001) for both the squat and the bench press. Furthermore, post-hoc analysis revealed that for the squat and the bench press, both the 2-point (p<0.001) and 4-point (p<0.001) predictions were significantly different from the actual 1RM. Compared to the actual 1RM, the 2- and 4-point squat predictions overestimated 1RM value by 18.54% and 23.82%, respectively. For the bench press, the 2- and 4-point predictions were 8.15% and 6.30% different from the actual 1RM, respectively. The 2- and 4-point squat predictions were significantly different from each other (p=0.005), however, the 2- and 4-point bench press predictions were not significantly different (p=0.18). Specific values for the predictions are displayed in Table 3.
Table 3
Mean Difference, R2, ICC, Effect Size, and SEM Between Actual and Predicted 1RM
[i] Data are mean ± standard deviation; back squat n=17, 2-point bench press n=16, 4-point bench press n=17; prediction of both the 2-point and 4-point methods; difference between the calculated predictions and actual one-repetition maximum for both methods; the mean average concentric velocities (ACVs) or percentages of 1RM (one-repetition maximum) for both squat and bench press prediction methods; ICC=Intraclass correlation coefficient; ICC 95%CI= Intraclass correlation coefficient 95% confidence interval; ES, effect size; SEM, standard error of the measurement. *Significantly greater than actual 1RM (p<0.05).
Standard Error of Measurement
The SEM values were high in both the 2-and 4-point equations for both the squat (9.15, 10.42) and the bench press (7.14, 7.76), indicating low consistency and inaccurate predictions for both methods. However, the data indicated slightly more accurate predictions in the bench press versus the squat for both prediction methods.
Intraclass Correlation Coefficients
The ICCs and associated 95% confidence intervals are presented in Table 3. The ICCs for the 2-point (0.73) and 4-point (0.61) squat analyses suggest moderate agreement. In the bench press, the 2-point (0.87) and 4-point (0.89) ICCs suggest good agreement. However, the 95% confidence interval range for the ICCs was very large for both the 2-point (-0.0672-0.9341) and 4-point (-0.0891-0.8865) squat predictions suggesting low 1RM prediction consistency. Like SEM, the ICC 95% confidence intervals suggest that bench press predictions were more accurate than squat preictions; however, 95% CI ranges were still wide for the bench press.
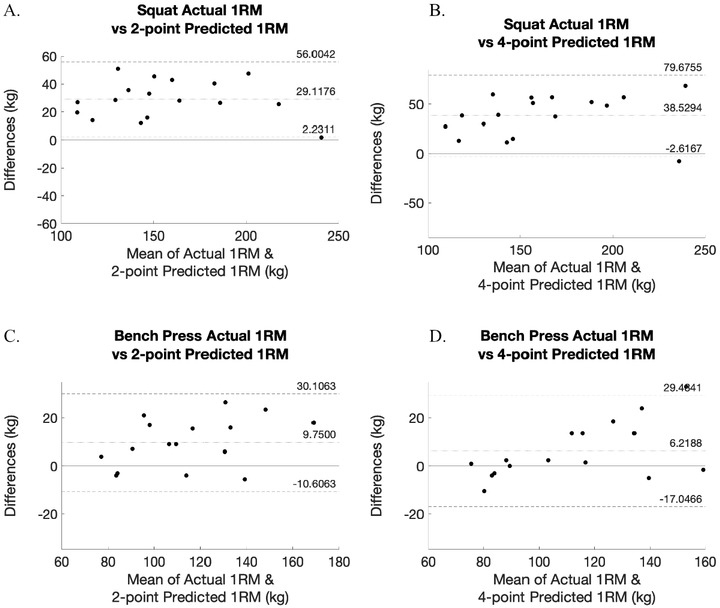
Bland-Altman Plots
All plots (Figure 1ABCD) show a large mean bias with wide limits of agreement, suggesting poor agreement between the predicted 1RMs for both prediction methods and in both exercises. Furthermore, the Bland-Altman plots demonstrate that both methods overpredicted 1RM value for most participants.
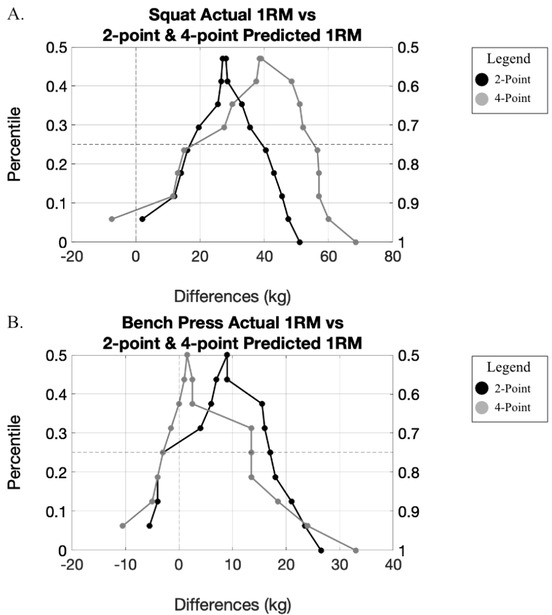
Mountain Plots
A Folded Empirical Cumulative Distribution plot, or a Mountain plot (Krouwer and Monti, 1995; Monti, 1995), is an Empirical Cumulative Distribution Plot that flips downwards halfway through the percentile ranks, hence the name "Mountain plot”. Mountain plots are included in addition to the Bland-Altman plots as these plots have been used in recent applied physiology literature to assess agreement (Goldsmith et al., 2019b; Kasovic et al., 2021) and previous data have recommended the two methods of agreement be used to verify results (Scott et al., 2003). A Mountain plot presents a clear visual representation of agreement or lack thereof between two measures. In the current Mountain plots (Figure 2AB) the data are “shifted” far to the right of the zero-difference line demonstrating that both the 2- and 4-point methods had poor agreement with the actual 1RM. The plot would demonstrate good agreement if the data were tightly conformed to the zero-difference. Additionally, all mountain plots have long tails, which further suggests inaccurate prediction. Similar to all other statistical measures, the plots are closer to the zero-difference line for the bench press versus the squat, demonstrating that the prediction equations were more accurate in the bench press.
Discussion
The main findings of this study were in contrast with our hypotheses. Specifically, ANOVA revealed a significant difference between both prediction equations and the actual 1RM. Additionally, visual representations of both the Bland-Altman and Mountain plots reveal substantial disagreement between all predicted and actual 1RMs. Therefore, based upon these findings, submaximal velocity should not be used to predict free-weight squat and bench press 1RM values.
Our findings are in agreement with both Banyard et al. (2017) and Ruf et al. (2018) who observed that 3-, 4- and 5-point individual linear regression forecasts using velocities obtained from 20-90% did not accurately predict 1RM value (p<0.001) in the free-weight back squat and deadlift, respectively. Specifically, in the Banyard et al.’s (2017) study, the 5-point equation which used ACV up to 90% of the 1RM, overpredicted the 1RM by 19.4kg, while the 4-point and 3-point equations overpredicted the 1RM by 22.0kg and 29.6kg, respectively. Similarly, Ruf et al. (2018) observed that deadlift 1RM value was predicted in trained men within 9.1-13.7 kg. The present study observed the 4-point method to overpredict squat 1RM value by 38.53kg and the 2-point equation to overpredict squat 1RM value by 29.12kg. Despite the nearly perfect linear relationship between ACV and the load (Helms et al., 2016; Zourdos et al., 2016), it seems that using a linear equation with submaximal ACV significantly overpredicts back squat and deadlift 1RMs.
In contrast with the present study, García-Ramos et al. (2018) and Jiménez-Alonso et al. (2020) observed 2-point submaximal velocity equations in men with ≥1.5 years of training experience to accurately predict 1RM value in the Smith machine bench press and free-weight bench press, respectively. Specifically, García-Ramos et al. (2018) found a 2-point equation using ACVs of 1.00m∙s-1 (~50% of 1RM) and 0.50m∙s-1 (~80% of 1RM), to accurately predict the Smith machine bench press 1RM with accuracy of <1kg (0.4±3.0kg) in trained men. Furthermore, Jiménez-Alonso et al. (2020) observed that both 4-point (40, 55, 70, and 85% of 1RM) and 2-point (40 and 85% of 1RM) equations could accurately predict 1RM value in the free-weight bench press. Jimenez-Alonso et al. (2020) also had participants perform 2 repetitions at each submaximal velocity, except for 85% of the 1RM, under two different conditions to predict 1RM value. In one condition, Jiménez-Alonso et al. (2020) provided participants with knowledge of their velocity immediately following each repetition, while no velocity feedback was given in the other condition. When velocity feedback was given, Jiménez-Alonso and colleagues (2020) observed improved bench press 1RM predictions and faster ACVs at submaximal intensities. Importantly, García-Ramos et al. (2018) and Jiménez-Alonso et al. (2020) instructed participants to perform each repetition at “maximal intended velocity”, while no such instruction was given in the present study in an effort to increase ecological validity. The absence of a maximal effort cue in the present study, by design, provides a meaningful comparison with another recent study that did utilize the maximal effort cue with well-trained males in the back squat. Thompson and colleagues (2021) found that a mixed exercise (jump squats and back squats) quadratic prediction equation was able to predict 1RM value within ±3kg , further supporting that providing a maximal intended velocity cue may be necessary for submaximal velocity to accurately predict 1RM value in various exercises (Thompson et al., 2021).
Another reason for the lack of agreement between actual and predicted 1RMs in the present study compared to some previous literature could be the usage of free-weight exercise as opposed to single-joint machine-based movements (Balsalobre-Fernández et al., 2019). In addition to submaximal velocity (2-point equation) accurately predicting Smith Machine bench press 1RM value (García-Ramos et al., 2018), there are other positive machine-based predictions. Indeed, Perez-Castilla et al. (2019) observed 2- and 4-point submaximal velocity linear equations to predict 1RM value in the machine lat-pulldown and seated cable row to a statistically accurate degree (p>0.05, absolute error ~2-4kg), which included Bland-Altman plots with low limits of agreement and data tightly conformed to the true zero line.
It is also possible that the accuracy of submaximal velocity predictions of 1RM on free-weight exercise is exercise-specific. Jiménez-Alonso et al. (2020) did find submaximal velocity to accurately predict the bench press 1RM and although the bench press 1RM was significantly overpredicted in the present study, it is worth noting that bench press predictions did have better agreement with the actual 1RM than the squat, based upon visual inspection of the Bland-Altman and Mountain plots for both the 2- and 4-point equations. Although the back squat, bench press, and deadlift all have very strong (r>0.90) load-velocity relationships throughout a spectrum of loads (Helms et al., 2016), the squat and deadlift have prolonged “sticking regions” compared to the bench press (Kompf and Arandjelović, 2017), which may cause the load-velocity relationship to become curvilinear, compromising the ability of velocity to predict 1RM value in the squat and deadlift. In agreement with previous data, the present study also found bench press 1RM predictions to be more accurate than squat predictions further suggesting that the accuracy of velocity predictions of 1RM may be exercise specific.
Despite the inaccurate 1RM predictions in the present study, it is worth noting that the predictions for the strongest participant in the study were particularly accurate. The strongest participant had 7 years of training experience with a back squat of 2.33xbody mass and a bench press of 1.55xbody mass. This individual’s squat was predicted within 2kg (2-point equation) and his bench press was predicted within 2.5kg (4-point). While no conclusions can be drawn from one participant, it has been previously observed that stronger load-velocity relationships exist in trained lifters versus novice ones (Zourdos et al., 2016); thus, future research should further examine the role of training status to influence the accuracy of submaximal velocity 1RM predictions.
Various limitations existed in the present study. First, only well-trained, young men were tested and only the back squat and bench press were examined. Therefore, caution should be used when extrapolating these findings to other population samples and exercises. Furthermore, it is possible that using different percentages of 1RM or ACV values in the regression equations could have resulted in more accurate 1RM predictions; however, if regression equations are accurate but use high absolute percentages (i.e., 90% of 1RM), then that would not rectify the limitations of a 1RM test. Additionally, as previously discussed, data have demonstrated more accurate 1RM predictions when maximal velocity cues and velocity feedback were given in the bench press (Jiménez-Alonso et al., 2020); thus, future research should examine the effect of immediate velocity feedback on 1RM predictions in the free-weight back squat. However, we wish to highlight that in practice, trainees and athletes often do not perform each repetition with maximal effort; therefore, the presently reviewed study provides valuable insight for practitioners looking to predict 1RM from submaximal velocity.
Conclusions
In summary, the results of this study demonstrate that linear regression forecasts using 2- and 4-point submaximal velocity methods provide inaccurate 1RM predictions for the back squat and the bench press. As previously noted, the present findings are in agreement with two previous studies showing 1RM predictions to be inaccurate in free-weight exercises (Banyard et al., 2017; Ruf et al., 2018). However, the present data are in disagreement with a recent investigation that observed submaximal velocity to accurately predict 1RM in the free-weight bench press (Jiménez-Alonso et al., 2020). It seems likely that the disparate findings between the free-weight barbell studies are due to one of two factors in Jiménez-Alonso et al. (2020), which were not used in the present study: 1) a maximal intended velocity cue, and 2) immediate velocity feedback. Therefore, based upon the current data, we recommend that athletes who wish to predict 1RM from submaximal velocities perform 2 single repetition sets of maximally intended velocity at the submaximal loads and use the higher velocity in the 1RM forecast. While submaximal velocity prediction may be attractive to coaches and athletes since it is both less fatiguing and time consuming than performing a true 1RM, based upon the present findings we advise against using this prediction to inform training decisions. For example, if a 1RM is predicted at the beginning of a training session and used to calculate daily loads, this could be significantly inaccurate. Specifically, using the present data, if a squat 1RM is predicted as 180kg, then 3 sets of 5 repetitions at 145kg (~80% of 1RM) might be programmed. However, based on the present data, that 1RM prediction could be overestimated by ~30kg; thus, the prescribed load could be as much as ~97% of the 1RM almost certainly resulting in failure to complete the training prescription. Ultimately, based on the totality of the literature, submaximal velocity cannot be recommended to accurately predict 1RM value in the free-weight barbell movements.