Introduction
Identifying trainable, physiological characteristics that influence sports performance is particularly important in competitive environments. This holds true for the sport of CrossFit®, though research-based evidence is currently limited. Consistent with the primary training goal of CrossFit® (i.e., adaptations across several fitness domains) (Glassman, 2011), several physiological traits including maximal strength (Barbieri et al., 2017; Butcher et al., 2015; Martínez-Gómez et al., 2019; Serafini et al., 2018), anaerobic threshold and power (Bellar et al., 2015; Butcher et al., 2015; Feito et al., 2018), maximal effort recovery (Feito et al., 2018), and aerobic capacity (Bellar et al., 2015) have all been shown to either influence performance or reflect competitive success. However, these traits may be secondary to experience. Compared to traditional physiological measures, Bellar and colleagues (2015) found that years of CrossFit® training experience was a better and more consistent predictor of performance in novel workouts. While years of experience is an imprecise description of proficiency or skill, greater experience might imply several relevant characteristics about an athlete. For instance, exercise familiarity, structure recognition, movement efficiency, self-awareness, and planning skills may all improve with experience (Higuchi et al., 2011; Kida et al., 2005; Micklewright et al., 2015; Santalla et al., 2009). It is possible that these skills might enable an athlete to be more successful than a more physically and physiologically gifted but less experienced athlete.
The CrossFit® Open (CFO) is an annual, 5-week competition that consists of 1 – 2 unique, weekly workout challenges. Though highly variable, workouts are expected to incorporate some combination of gymnastic, plyometric, resistance training or traditional aerobic exercises (e.g., rowing, cycling) programmed to tax one or more energy systems (Glassman, 2010). The energy systems involved will influence how quickly the athlete might fatigue and their percent contribution is dependent on the workload, duration, and their combination (i.e., density) (Gastin, 2001). Competitors earn a better score when effort and efficiency are optimized (i.e., maximizing density by performing assigned movements correctly and as fast as possible). CFO workouts are typically programmed to either challenge the athlete to complete ‘as many repetitions as possible’ (AMRAP) of the assigned exercises within a given time limit or to complete the assigned work as fast as possible (i.e., measured by time to completion [TTC]). Greater density is determined by the athlete’s pace which may be quickened by performing exercises at a faster rate, reducing transition time between exercises, or by minimizing the occurrence and duration of self-selected rest. However, an overall faster pace is limited by the athlete’s ability to manage fatigue (Skorski et al., 2019). This is further modulated by the differential effects of each workout’s specific programming (e.g., order and intensity of tasks, volume, etc.). Thus, performance may suffer for athletes who do not adopt a pacing strategy that accounts for these differences.
Although CFO athletes have unlimited attempts to complete a given workout, there are only four days allotted between the release of a workout’s details and when they must submit their score (CrossFit, 2019). Performance may suffer in athletes who repeat a workout on multiple occasions within this timeframe due to accumulated fatigue and insufficient recovery (Andersson et al., 2008; Mohr et al., 2003). As such, athletes who identify and execute an appropriate strategy on their initial attempt would be better positioned to minimize the number of attempts needed to find their best score. This could also limit the accumulation of fatigue and help maintain performance over the entire five weeks of competition. Currently, however, no information exists to help athletes identify effective pacing strategies for various CFO workout structures. Therefore, the purpose of this pilot study was to observe pacing strategies utilized by recreational CFO competitors and determine which strategies were most predictive of performance. These data may assist competitors in identifying the components most in need of attention, with regard to pacing, within a familiar workout structure.
Methods
Participants
Eleven recreationally-active adults (Men: n = 5, 34.4 ± 3.8 years, 176 ± 5 cm, 80.3 ± 9.7 kg; Women: n = 6, 35.2 ± 6.3 years, 158 ± 7 cm, 75.9 ± 19.3 kg) with CrossFit®-experience (1 – 5 years) volunteered to participate in this study. All prospective participants were recruited by wordof-mouth from the same CrossFit® affiliated gym and each had registered for the 2016 CFO prior to their enrollment. Enrolled participants were classified as “recreational athletes” because they possessed CrossFit® experience (> 6 months), had voluntarily registered for the 2016 CFO, and had never progressed (or did progress) beyond the CFO round of the overall competition. Due to reasons unrelated to the competition, not all athletes completed each workout in the presence of the research team. One female athlete discontinued participation in the study after the second week because a change in profession required her to move out of the area, while two male athletes did not complete the final week’s workout due to personal reasons (n = 1) and illness (n = 1). Prior to the investigation, all competitors were apparently healthy and free of any physical limitations (determined by medical history and physical activity readiness questionnaires), and no injuries were reported during the length of the study. Following an explanation of all procedures, risks and benefits associated with the study, each participant provided his/her written informed consent to participate. This investigation was carried out in accordance with the Declaration of Helsinki and approved by the University’s Institutional Review Board (IRB# 16-242).
Measures
On each week of the 5-week competition (W1 – W5), workout-details were released on Thursday evening (2000 hours EST) and competitors were required to report their best score by the following Monday evening (2000 hours EST). Workout-details were released on the competition website (CrossFit, 2019) and included a description of the workout’s structure, all movement standards, and scoring criteria. In general, each workout consisted of two or more exercises with a separately prescribed (Rx) number of repetitions at standardized resistance loads for men and women. A “Scaled” option was also available for each workout that either modified some combination of exercise complexity, intensity loads, and/or repetitions. To standardize effort and still account for differences in athletic ability and skill, athletes were instructed to complete their first attempt using the difficulty level (i.e., Rx or Scaled) that would enable them to complete the prescribed exercises and achieve the highest score possible. Based on the assumption that maximal effort was given by each athlete on each workout, the resultant scores were analyzed together. That is, it was assumed that differences between sexes and competitive levels in programming still required the same relative effort from each athlete. No further recommendations on workout selection or pacing strategy were provided by the research team.
In general, the officially recognized scoring format was used to quantify performance on each workout. The AMRAP structure of W1 and W3 produced a final score that was represented as the total number of repetitions completed within the time limit. Although W2 and W4 were also structured as an AMRAP, only two athletes progressed beyond the workout’s 2nd round (of five total rounds) on W2 and only one athlete completed a full round on W4. To standardize performance on W2, the final score was converted into a rate (repetitions·s-1) that either reflected the total number of repetitions completed at the 8-min mark (i.e., the time limit for two rounds) or TTC of 178 repetitions (i.e., the number of repetitions in two full rounds). In contrast, the official score on W4 (i.e., total repetitions) was not modified. However, the examination was limited to pacing variables (described below) calculated during the 1st round. Performance on W5 was quantified as TTC (in s). A description of each workout and associated score are presented in Table 1.
Table 1
Prescribed and scaled workout descriptions and scoring for competitors (men/women) of the 2016 CrossFit® Open.
Within each workout, pacing was quantified as a repetition rate (repetitions·s-1) for each exercise and round (when applicable), as well as rest (in s) between exercises (when available) and rounds. When the structural design of a workout allowed athletes to complete multiple rounds (W1, W2, W3, and W5), the fastest rate, slowest rate, average rate across rounds, and slope (Δ rate / round) were calculated for each exercise and round. Due to faster than expected transitions between exercises on W1, the calculated rates for each exercise actually reflect the time between the initiation of consecutive exercises; only rest between rounds could be consistently timed. Furthermore, because only two rounds were considered for W2, rest was limited to quantifying that taken between the first and second rounds. When only a single full round was expected (i.e., W4), only the rate for each exercise was calculated (including any rest taken). Additional strategic variables were also considered on selected workouts. On W4, the damper setting (1 – 10), total distance covered (m), and stroke rate over the last 500 m (spm) on the rowing ergometer (Concept 2 - Model D, Morrisville, VT, USA) were recorded. Then on W5, the number of rest breaks taken for each exercise (e.g., setting the bar on the floor during thrusters, pausing between burpees) were recorded and then the minimum, maximum, and average rates, along with their slope across rounds were calculated.
Design and Procedures
In this observational study, pacing strategy during the 2016 CFO was monitored in recreational competitors at their normal, CrossFit® affiliated gym. Prior to each attempt, competitors completed a self-selected warm-up for 10 – 15 minutes and were then paired with an official judge and a member of the research team. The official judge recorded all repetitions during the workout attempt and verified that movement standards were met. Meanwhile, the researcher recorded the start and finish time for each exercise and round (when applicable) via a stopwatch. The first four workouts (W1 – W4) were completed at mid-day (1200 – 1500 hours, Eastern Standard Time [EST]), approximately 18 – 40 hours after competition officials released their details. The fifth workout (W5) was completed at night, within 30 minutes of its release (~2030 hours EST) due to athletes’ choice. In either case, the occurrence of each workout represented each athlete’s first attempt on a specific workout, and only this attempt was examined to minimize the potential influence of accumulated fatigue and familiarity on their self-selected pacing strategy. Following the completion of each attempt, and prior to any data treatment, all recorded timing data were checked for accuracy by members of the research team who had not been involved with data collection. When necessary, video recordings of each workout were used to verify recorded times. Subsequently, the collected timing data were used to calculate pacing variables of interest, which were then correlated with each athlete’s final score for the associated workout.
Statistical analysis
Prior to statistically assessing relationships, results of the Shapiro-Wilk’s test indicated that several variables were not normally distributed. Therefore, Spearman’s rank correlation coefficients (ρ) were calculated to determine the relationships between CFO workout performance and all calculated pacing variables. Subsequently, stepwise regression analysis was used to identify the best predictors of performance on each workout. All statistical calculations were performed using SPSS (v. 26.0, SPSS Inc., Chicago, IL). All descriptive data are presented as mean ± standard deviation. A criterion alpha level of p ≤ 0.05 was used to determine statistical significance.
Results
Competitor performance scores on each week have been previously reported (Mangine et al., 2018a). Briefly, the athletes ranked between 10,056 – 113,830th place on W1, between 8,093 – 70,836th place on W2, between 14,329 – 97,461st place on W3, between 8,284 – 58,302nd place on W4, and between 13,822 – 50,914th place on W5. Significant (p < 0.05) relationships were observed between several pacing variables and workout performance on each week (Table 2). In addition to those reported in Table 2, the relationships between performance and select strategic variables collected on W4 (i.e., damper setting, total meters, and final stroke rate on the rowing ergometer) and W5 (i.e., rest intervals taken between repetitions) were also examined. However, none of these were found to be significantly related to performance.
Table 2
Relationships between pacing measures and CFO workout performance ρ (p-value)
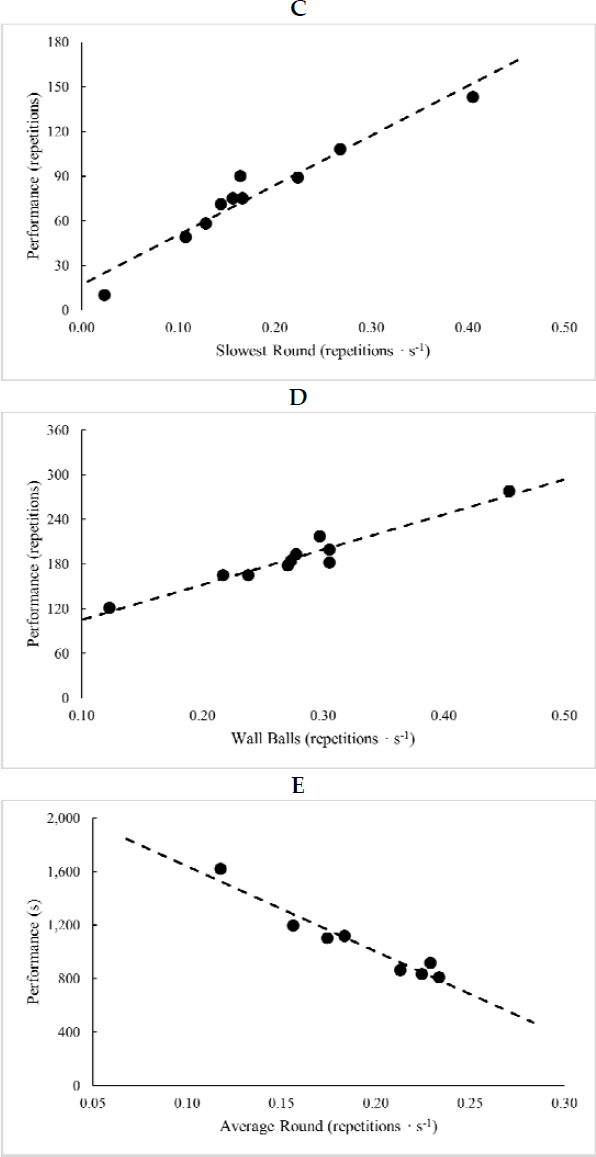
The best predictors of performance on each workout were identified via stepwise regression analysis and are presented in Figure 1a and b. The average rate of round completion best predicted performance on W1 (R2 = 0.89, SEE = 21.2 repetitions, F = 46.9, p < 0.001), W2 (R2 = 0.99, SEE = 0.01 repetitions·s-1, F = 466.2, p < 0.001), and W5 (R2 = 0.94, SEE = 74.7 s, F = 85.6, p < 0.001). Additionally, variance explained for performance on W2 was improved by 1.2% (F = 2181.2, p < 0.001) with the addition of the competitive level (Rx or Scaled) into the model, while variance explained for W5 performance was improved by 5.5% (F = 241.6, p < 0.001) from the slope in rest taken between thrusters and burpees. That is, increasing the amount of rest taken between these exercises as the workout progressed improved time to completion. Performance on W3 was best predicted by the slowest round completion rate (R2 = 0.94, SEE = 7.5 repetitions, F = 106.8, p < 0.001) and could not be further explained with the inclusion of any other pacing variable. On W4, the wall ball completion rate best predicted performance (R2 = 0.89, SEE = 13.0 repetitions, F = 38.7, p = 0.002) with variance explained further improved by 9.8% (F = 117.4, p < 0.001) with the inclusion of the deadlift completion rate.
Discussion
In traditional, continuous exercise modalities (e.g., running and cycling), pacing strategy is known to influence the predominant energy system used and the onset of fatigue (Mauger, 2014; Skorski et al., 2015). Energy utilization and fatigue may be further modulated by anticipation (e.g., to competition, to the amount of work expected or remaining), as well as intrinsic and extrinsic sensory feedback mechanisms related to, for example, peripheral fatigue and opponent performance, respectively (Casto and Edwards, 2016; Mauger, 2014; Skorski et al., 2015). The effect on energy utilization becomes more pronounced when a workout structure becomes variable (e.g., cross-training, interval training) (Buckley et al., 2015; Peake et al., 2014; Townsend et al., 2013). The sport of CrossFit® appears to fall within this latter category but differs from traditional training or competition structures because each workout uniquely involves frequent transitions between multiple modalities programmed at various volume loads. Nevertheless, similarities in the structural design of CFO workouts (e.g., AMRAPs, TTCs) make it possible to identify potential pacing strategies that might be employed even when specific exercises or volume loads are different. Since no study has previously attempted an examination of pacing in this sport, the primary aim of this pilot study was to identify pacing strategies utilized by recreational CrossFit® athletes and determine which were most predictive of competition performance. While several pacing variables were related to performance during each workout, the best predictors were affected by the workout type and predominantly related to how athletes approached the entire workout. For workouts where multiple rounds were expected, a fast but consistent pacing strategy was the best predictor of performance. In contrast, when competitors were not expected to complete much more than a single round in a workout (i.e., on W4), performance was improved when athletes focused on completing specific exercises at a faster rate. Although preliminary, these data may be useful in helping athletes construct an optimal strategic approach when encountering future competitive workouts of a similar design.
Figure 1a
Relationships between the best predictor of performance on 2016 CrossFit® Open Workouts (16.1 – 16.5).
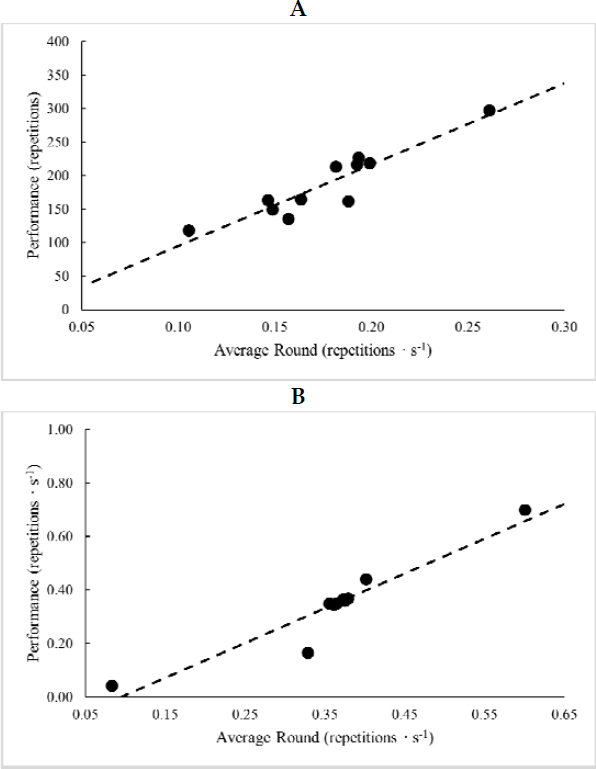
Figure 1b
Relationships between the best predictor of performance on 2016 CrossFit® Open Workouts (16.1 – 16.5).
Note: Dashed line denotes the line of best fit from linear regression
When athletes competed in a workout that involved multiple rounds, maintaining a faster average round completion rate (i.e., average repetitions per round across the entire workout) resulted in more repetitions completed within the time limit (W1 and W2) or a quicker TTC (W5). Although this would seem obvious, multiple strategies that are differentially beneficial may be employed to affect the average round completion rate. An athlete may attempt to preserve energy by initiating a workout at a slower (than average) pace and increasing it as they progress. Unfortunately, efficiency may suffer if the initial pacing is too slow, as physical limitations and fatigue may limit the athlete’s capacity to produce a comparably faster round. An alternative approach would be for the athlete to attempt completing each round as fast as possible. However, like an “all-out” maximal sprint (Bergstrom et al., 2013; Feito et al., 2018; Jones et al., 2010; Vanhatalo et al., 2011), the athlete would quickly fatigue and their pace on subsequent rounds would decrease until the athlete reached a sustainable rate. The effect on the average rate would be dependent on the duration of the workout, though typically, a sharp decline in the pace may be expected within 30 – 60 s (Bergstrom et al., 2013; Jones et al., 2010; Vanhatalo et al., 2011) and few CrossFit® workouts are less than 60 s (CrossFit, 2019; Mangine et al., 2018b; Serafini et al., 2018). Drastic effects might be avoided with an interval approach (e.g., alternating faster and slower rounds), but energy expenditure and the likelihood of fatigue would still be greater than they would if the athlete were able to find a sustainable rate from the onset (Buckley et al., 2015; Peake et al., 2014; Townsend et al., 2013). Thus, the ideal strategy would be for the athlete to find a fast and sustainable pace. This is supported by the slope in round time not being related to performance for any workout. A slope equal (or close) to zero would indicate that the pace remained steady, but it could not produce a significant relationship with performance unless all competitors performed similarly. Additionally, the predictive ability of rest time slope on W5 performance is consistent with this finding because the observed increase in between-round rest time appeared to be offset by the prescribed repetition scheme. Competitors completed each round at the same pace while gaining more rest as repetitions decreased.
Relatedly, on W3, performance was best predicted by how fast the competitors completed their slowest round. While this would also impact the average round pace, it emphasizes the practical importance of the athlete’s worst round in a shorter duration (7 min) workout when inefficient rounds are harder to overcome. Physiologically, the pace in which an athlete completes their slowest round may be linked to the concept of critical power. Critical power represents the highest sustainable power output and is thought to demarcate the point in which exercise transitions from ‘heavy’ to ‘severe’ (Bergstrom et al., 2013; Jones et al., 2010; Vanhatalo et al., 2011). In a sport noted for AMRAP workouts or workouts scored by TTC (CrossFit, 2019; Glassman, 2010, 2011), being able to maintain a faster pace or rapidly recover within very short rest periods would seemingly be essential to success. This notion is supported by recent evidence showing that critical power is higher in advanced CrossFit® athletes (i.e., athletes who advanced beyond the CFO) compared to those who had never progressed beyond the CFO (Mangine et al., 2020). Moreover, an athlete’s critical speed, a similar concept to critical power, has been related to performance in shorter (“Fran”, ~4.2 min) and longer (“Nancy”, ~14.1 min) benchmark workouts (Dexheimer et al., 2019), where being able to maintain a faster sprinting pace was associated with a shorter TTC in the workouts. A caveat to this information, however, is that athletes are unlikely to completely work continuously due to, at minimum, transitions between exercises. Nevertheless, this concept was superficially explored when Feito and colleagues (2018) examined the influence of a variety of cardiorespiratory measures surrounding four maximal Wingate sprints, separated by 90 s of rest, to 15-min AMRAP performance. Though the authors found that the amount of work completed on the final Wingate trial was the best predictor, oxygen uptake during the rest intervals was also a strong predictor (Feito et al., 2018). Oxygen uptake is heavily influenced by aerobic capacity, and aerobic capacity has been previously documented to influence 12-min AMRAP performance in experienced CrossFit® athletes (Bellar et al., 2015). Thus, it is clear that an athlete’s aerobic fitness and critical power play influential roles in CrossFit® performance, and how these intriguing characteristics influence pacing warrants further investigation.
In the only workout where multiple rounds were not expected (W4), the strategic focus shifted to performance on 1 – 2 specific exercises. Out of the variables assessed, only three were found to be related to performance: deadlift (1st exercise) completion rate, wall ball (2nd exercise) completion rate, and handstand or handrelease push-ups (4th exercise). Of these, the completion rate for wall balls followed by deadlifts were the best predictors of performance. Although the reason for why wall balls were most important cannot be determined at this time, there are a few hypotheses that warrant further investigation. The most obvious reason could be related to uncontrollable aspects about the wall ball exercise. That is, the exercise requires the athlete to perform a parallel squat while holding a medicine ball and then tossing it up to a specified height. Since the time it takes the ball to drop from the target cannot be hastened, this exercise is likely to consume more time than the other exercises in W4. The accuracy of the athlete in hitting the target with the proper trajectory (Glassman, 2007) may also play a role. Failure to hit the target or an off-center trajectory may produce an uncounted repetition (not measured) or require additional energy to reposition and catch the ball, respectively. In either case, rhythm, efficiency, and pace may be negatively impacted by poor technique, and since a higher amount of repetitions were assigned on W4 (i.e., 55 repetitions), these issues could be exacerbated over the length of the set. Yet another possibility may be related to the order of exercise and accumulated fatigue. With some exception (i.e., Rx competitors not employing a kip during handstand push-ups while the scaled version replaced handstand push-ups with hand-release push-ups), each movement in W4 exercised the musculature involved in hip extension. While performance was best predicted by wall ball pacing, it was further modulated by deadlift pacing. It is possible that wall ball performance, and thus overall score, suffered in athletes who expended too much effort on the deadlifts. Anecdotally, competitors reported lower-back fatigue while performing the wall ball exercise. Further investigation on each of these hypotheses may be relevant to both a better understanding of W4 performance and performance in workouts that consist of a similar design or limitations.
It is common for CrossFit® coaches and competitors to strategize a game plan for training and CFO workouts to optimize performance. The findings of this observational, pilot study suggested that competitors should employ a fast and sustainable pace when workouts were expected to consist of multiple rounds. Conversely, when competitors were only expected to complete 1 – 2 rounds, the data suggested that they shift their focus to pacing on specific exercises. In this case, focusing on the wall ball exercise, which contained elements that could not be hastened (e.g., the decent of the ball from the target), was most important. Competitors performed better when they maximized their pace during this exercise followed by the preceding exercise (i.e., deadlifts). However, these findings should be viewed as preliminary, as this was the first study to attempt an examination of pace in relation to CFO performance and our data are limited to performance in 8 – 11 (depending on workout) recreational male and female competitors during their first attempt. It remains unclear whether the observed relationships would change on subsequent attempts. Future studies should also consider the influential roles of factors such as the competitive level and the presence (or lack) of other competitors. Although competitors were allowed to select the difficulty of each workout (i.e., Rx or scaled) and this factor was only related to performance on W2, programming differences in workout complexity, volume, and intensity still exist and may prove to be influential in a more diverse and robust sample. Additionally, training and competitive workouts are often completed within a group setting. This setting may motivate trainees and competitors to maximize performance (or ‘win’) (Lichtenstein and Jensen, 2016); albeit, potentially at the cost of deviating from one’s optimal pacing strategy. Nevertheless, it is possible for performance in CFO workouts to be different if the competitor completes the workout by themselves or while in the presence of other competitors of various fitness levels. Finally, determining the influence of the relative workload on performance may provide new and interesting insights. Without knowing the details of CFO workouts in advance, it was difficult to predict which physiological measures would be relevant. However, it appears that measuring aerobic fitness and critical power may be useful since maintaining a higher average round pace was predominantly the most relevant predictor across workouts.