Introduction
Participating in elite sports demands a high level of mental and physical attributes (Demulier et al., 2013). Within the psychological realm, cognitive and psychomotor abilities are crucial for performance of elite athletes (Kalén et al., 2021; Scharfen and Memmert, 2019; Skala and Zemkowa, 2022; Vestberg et al., 2012), as they significantly influence decision-making (Broadbent et al., 2015; Roca et al., 2013; Scharfen and Memmert, 2019). Examples of these essential abilities include visual search, situational information processing, discrimination of situational differences, and response types (Chainken et al., 2000). Although cognitive and psychomotor abilities are often treated as identical aspects within the psychological domain, they represent distinct concepts that warrant a comprehensive review.
Psychomotor ability refers to the precision and coordination of movement. It involves the selection and processing of information, allowing individuals to execute movements adequately (Kim et al., 2017). The result of this process is a movement response to visual or auditory signals (Paul et al., 2011), which is associated with simple motor activities (Nuri et al., 2013). In summary, psychomotor abilities are linked to executing movement with precision and coordination (Habay et al., 2021; Hindmarch, 2014). Cognitive abilities, on the other hand, pertain to the reception and interpretation of information within the mental domain (Kalén et al., 2021). These abilities can be categorized into two related groups: basic cognitive processes and higher cognitive functions (Butzbach et al., 2019; Paz-Alonso et al., 2013). Basic cognitive processes include processing speed, attention, and perception.
In contrast, higher cognitive functions encompass the interaction of multiple basic cognitive processes, such as working memory capacity and cognitive decision-making (Glisky, 2007). These functions involve tasks requiring participants to choose between different options, engage in judgment and decision-making, and anticipate outcomes (Kalén et al., 2021). While psychomotor abilities are primarily related to movement, cognitive functions are closely tied to mental operations and the foundations of the nervous system (Scharfen and Memmert, 2019). It is important to note that the terminology of these two concepts is often used interchangeably in sports science and psychology.
Researchers have defined cognitive and psychomotor abilities in various ways, such as perceptual-cognitive abilities (Williams and Ericsson, 2005), psychomotor abilities (Przednowek et al., 2019), cognitive-motor abilities (Wang et al., 2020), motor-cognitive abilities (Huzarska et al., 2023; Musculus and Raab, 2022), and sensory-cognitive abilities (Nuri et al., 2013). It is essential to analyse cognitive and psychomotor abilities as separate categories (Ree and Carretta, 1992), as they represent distinct concepts. The lack of consensus regarding terminology and assessment methods can significantly impact the interpretation of study conclusions (Voss et al., 2010). Previous reviews have examined the effects of mental fatigue on athletes (Dong et al., 2022; Habay et al., 2021; Skala and Zemkowa, 2022), but they often overlooked methodological differences among studies. Additionally, other reviews have focused exclusively on cognitive abilities (Furley et al., 2023; Heilmann et al., 2022; Kalén et al., 2021; Scharfen and Memmert, 2018) without considering psychomotor abilities. Given the conceptual and methodological differences between cognitive and psychomotor abilities, there is a need for a review that combines studies examining both domains. Furthermore, summarising the literature will provide a conceptual framework for understanding psychomotor and cognitive abilities in the context of sports, highlighting the methodological issues related to assessing both capacities.
This review aimed to summarise the research on psychomotor and cognitive performance in elite athletes, focusing on the methods, tools, and variables used for assessment. Concepts from both sports science and psychology were integrated by comparing psychomotor and cognitive performance. This distinction is important for addressing inconsistencies in the use of these concepts within the sports domain. By accurately defining and diagnosing these concepts, researchers can select and apply research methods more effectively. The specific aims of this review were as follows: (1) to verify the terms used to delineate psychomotor and cognitive abilities, ensuring a consistent framework for their application in research; (2) to focus on core functions, analysing which basic cognitive abilities or psychomotor skills are linked to perception, attention, or responding to a stimulus, while excluding broader constructs such as executive functions, decision-making, anticipation, or critical thinking; and (3) to optimize research approaches by distinguishing and recommending appropriate methods and tools for assessing cognitive and psychomotor performance in professional athletes.
Methods
The review was performed in accordance with PRISMA Guidelines and Cochrane recommendations (Higgins et al., 2019; Page et al., 2021). The protocol was registered in the Open Science Framework on April 8, 2024.
Eligibility Criteria
The inclusion criteria were guided by the Participants, Exposure, Comparators, Outcomes, and Study Design (PECOS) framework, as follows: (1) Participants: adult athletes (mean age > 18 years) classified as elite, professional or trained individuals; (2) Exposure: assessment of cognitive and psychomotor abilities, including attention and performance related to these abilities; (3) Comparator: comparison of athletes based on a competitive level, gender or against a control group; (4) Outcomes: measures of psychomotor and cognitive performance; (5) Study Design: observational studies. Studies that included Paralympic athletes were excluded as well as interventional studies that focused on training interventions. Only papers written in English and Polish were consulted and there were no defined restrictions regarding the year of publication or geographical location.
Information Sources and Search Strategy
Three online databases were consulted: PubMed, Scopus and Web of Science. The search encompassed relevant publications available up to the 12th of January, 2024. The search strategy used was: (“reaction time” OR “eye-hand coordination” OR “psychomotor performance” OR “psychomotor*” OR “psychomotor abilit*” OR “psychomotor skill*” OR “motor-cognitive” OR “cognitive abilit*” OR “cognitive performance” OR “perceptual-cognitive” OR “visuomotor” OR “visual skill*”) AND (athlet* OR sport*) AND (expert* OR athlet*) AND (adult).
Selection Process
An automated procedure was executed using EndNote 20.6 for Windows (Clarivate) to prevent duplication of records. Manual screening was also carried out to ensure all duplicates were excluded. Two independent reviewers initially checked the titles and abstracts. Afterwards, full studies were screened following the eligibility criteria previously mentioned. When discrepancies occurred, a third external reviewer was consulted to guarantee agreement by consensus.
Data Items, Extraction and Synthesis
The first author (I.H.-R.) conducted the data extraction process, collecting relevant information using a structured template. This comprehensive datasheet included all pertinent details and essential information. For each study, the following information was organized: (i) sample characteristics: (country, sample size, age, competitive level, training experience, sport); (ii) methodological details: study design, performance terminology and procedures, tools used, main outcomes and the respective unit of measurement; (iii) the key findings of each study.
The information from each paper was presented in tables and compiled in figures to highlight central points regarding sample characteristics, methodological issues, and results.
Risk of Bias
The Quality Assessment Tool for Observational Cohort and Cross-Sectional Studies was used to assess the risk of bias for each study (National Heart, Lung, and Blood Institute, 2019). This tool includes fourteen questions related to various aspects of the research, such as the research question, study population, recruitment from the same population with uniform eligibility criteria, sample size, assessment of exposure before outcome measurement, an adequate timeframe to observe effects, different levels of the exposure of interest, exposure measures and assessment, repeated exposure, blinding, follow-up, and statistical analysis. In the present review, the following questions were not considered due to their inapplicability to the design of studies included in this review: question 8 (different levels of the exposure of interest), question 10 (repeated exposure assessment), question 12 (blinding of outcome assessors), and question 13 (follow-up). Two independent authors assessed the risk of bias; in the event of disagreement, a third experienced author made the final decision.
Results
Study Selection and Identification
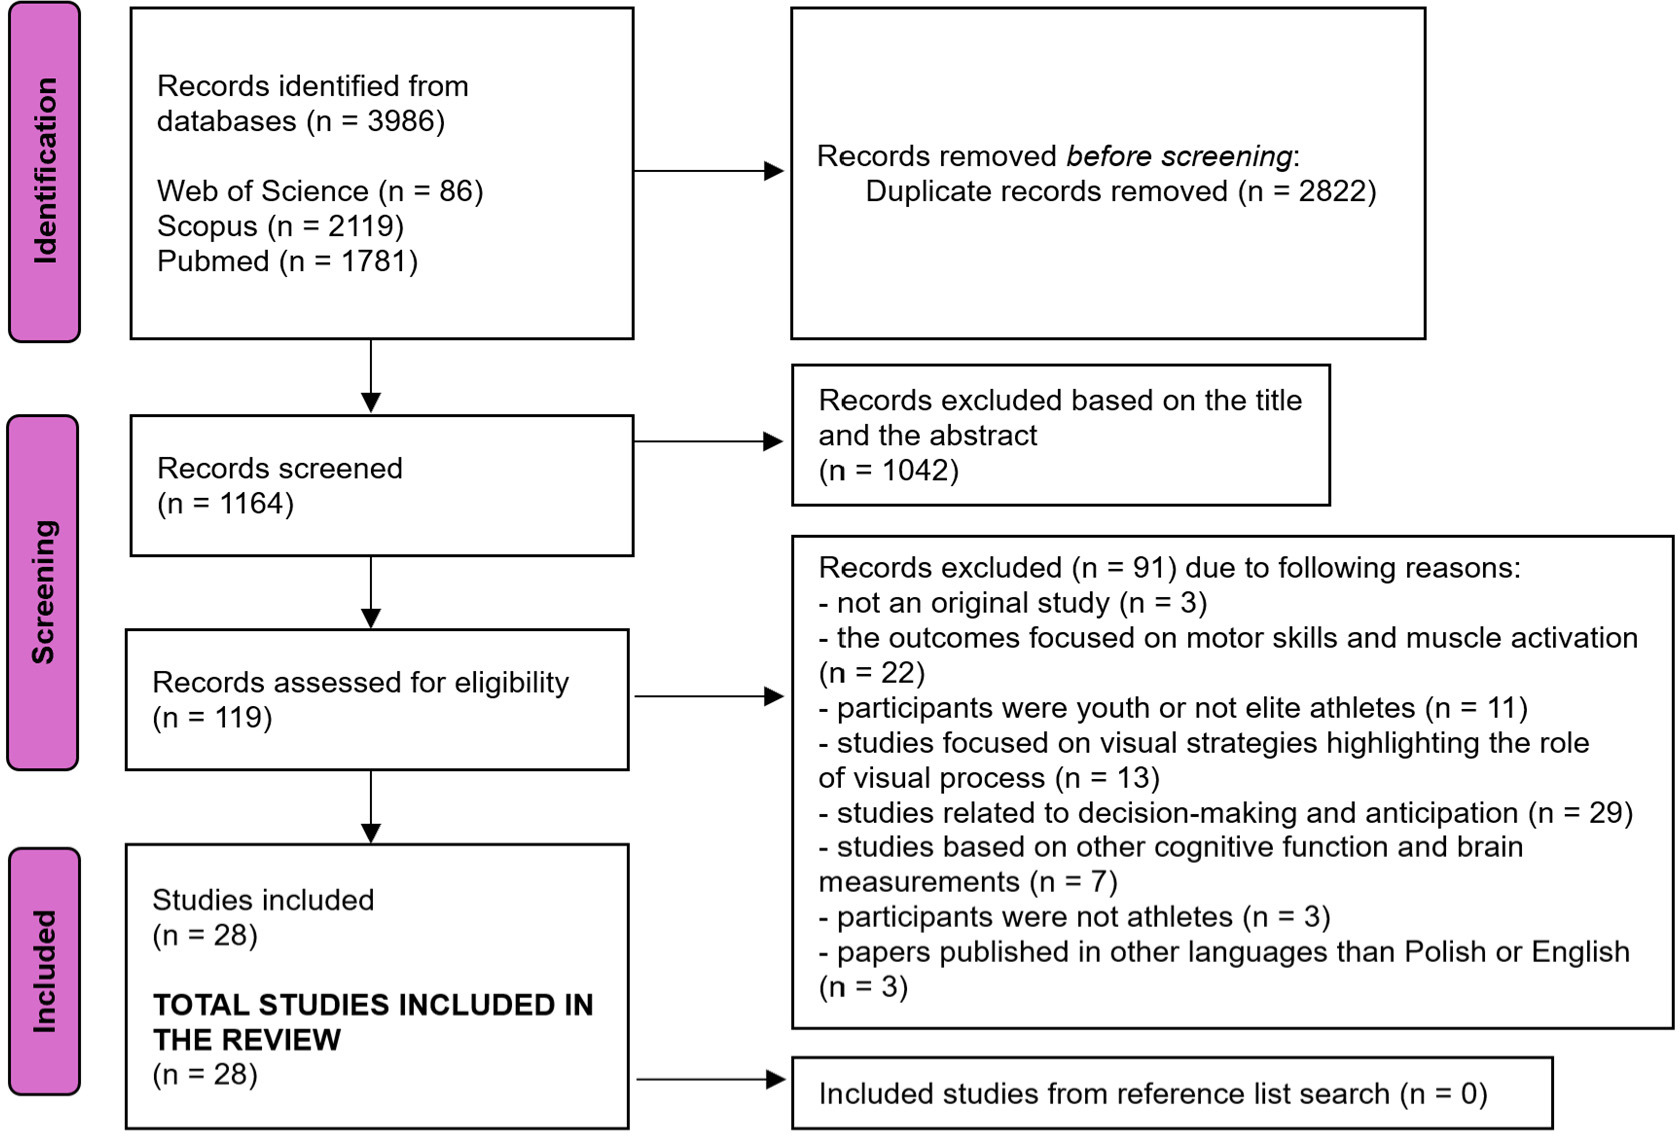
The initial search across three databases resulted in the identification of 3,986 paper records. After removing 2,822 duplicates, 1,169 records were screened based on their titles and abstracts, leading to the deletion of 1,042 records. This process culminated in a full-text screening of 119 studies. Ninety-one (91) studies were excluded due to the following eight reasons: not an original study (n = 3), the outcomes focused on motor skills and muscle activation (n = 22), the sample included youth participants or not elite athletes (n = 11), visual strategies highlighting the role of the visual process were applied (n = 13), studies related to decision-making and anticipation (n = 29), brain measurement and cognitive functions were considered, which were not related to psychomotor or cognitive abilities (n = 7), study subjects were non-athletes (n = 3), papers published in other languages than Polish or English (n = 3). Finally, 28 studies met the eligibility criteria and were included in this review (Figure 1).
Study Characteristics
The characteristics of the included studies are detailed in Tables 1 and 2. Among the considered studies, four were conducted in China (Chan et al., 2011; Cojocariu et al., 2019; Nian et al., 2023; Shao et al., 2020), while three were conducted in Poland (Markowski et al., 2023; Śliż et al., 2022, 2023). In total, the review encompassed 3,482 athletes, with sample sizes ranging from 12 (Oudejans et al., 1997) to 1,319 (Tønnessen et al., 2013).
Table 1
Characteristics of the participants examined in each study.
| Study | Country | Sample size (N) | Age (yrs) | Competitive level | Training experience (yrs) | Sport discipline | |
|---|---|---|---|---|---|---|---|
| Alves et al. (2013) | Brazil | 154 | 24.85 ± 4.40 20.55 ± 1.23 17.58 ± 0.92 16.27 ± 1.06 23.33±3.04 21.55±1.50 17.33±1.13 16.45±1.53 | Adult professional M Adult professional F Junior professional M Junior professional F Adult control M Adult control F Junior control M Junior control F | 11.61 ± 4.75 9.66 ± 1.5 5.25 ± 2.43 5.43 ± 1.94 | Volleyball | |
| Bennett et al. (2020) | NR | 110 | 19 -55 30.70±6.7 | National | NR | Boxing, MMA, MA | |
| Bianco et al. (2008) | Italy | 60 | 24.1 ± 5.13 29.4 ± 4.19 | Professional Amateur | 3.8 ± 3.97 14.8 ± 5.16 | Boxing | |
| Chan et al. (2011) | China | 60 | 20.63±2.11 20.63 ± 2.11 | National | >5 non | Fencing | |
| Cojocariu et al. (2019) | Spain | 53 | 20.2 ±1.7 31.7 ±5.9 | International University | >12 yrs NR | Qwan ki do | |
| Cona (2015) | Italy | 30 | 43±8.6 | International | NR | Ultra-marathon run | |
| Eriksson et al. (2023) | Sweden | 93 | 18.21 ± 1.8 17.27 ± 1.05 17.50 ± 1.29 | National National Control | 7.62 ± 3.03 12.17 ± 2.79 non | Biathlon, alpine ski racing | |
| Faro et al. (2020) | NR | 34 | 26.5 ± 7.9 25.2 ± 5.8 | Professional Amateur | >10 <1 | Judo | |
| Garrido-Palomino et al. (2020) | NR | 35 | 34.7 ± 6.2 | International | 11.1 ± 7.0 | Sports climbing | |
| Harmenberg et al. (1991) | Sweden | 14 | 23.1 19.5 | International Beginners | 11.7 1.25 | Fencing | |
| Hülsdünker et al. (2021) | Germany | 19 | 21 ± 5 | International | 13 ± 5 | Badminton | |
| Kida et al. (2021) | Japan | 193 | 23.4 ± 2.1 22.1 ± 1.9 | International National Non-athletes | NR | Baseball, tennis | |
| Liu et al. (2018) | Taiwan | 159 | 21.57 ± 2.37 21.19 ± 1.57 21.09 ± 1.70 20.74 ± 1.74 20.23 ± 0.82 20.53 ± 0.68 | National F National M Beginners Non-athletes | NR | Karate | |
| López Del Amo et al. (2018) | NR | 30 | 26 ± 2 28 ± 3 29 ± 3 | International | NR | 110 m hurdles | |
| Lynch et al. (2019) | France | 16 | 24.71 ± 2.43 27.56 ± 10.69 | National Beginners | 16.29 ± 4.23 | Rugby | |
| Markowski et al. (2023) | Poland | 65 | 25.9 ± 7.6 | National | NR | Speedway riders | |
| Nian et al. (2023) | China | 42 | 24.46 ± 1.43 22.33 ± 1.05 21.38 ± 1.43 | National University Beginners | NR | Basketball | |
| Oudejans et al. (1997) | United States | 12 | 24 ± 22–31 | International Beginners | 15 ± | Basketball | |
| Petrenko et al. (2021) | Russia | 38 | NR | National | NR | Track and field | |
| Russo et al. (2022) | NR | 95 | 28.62 ± 8.39 27.30 ± 7.49 29.97 ± 9.73 29.04 ± 8.25 | NR | NR 14.73 ± 7.78 8.44 ± 7.82 | Open skill Closed skill | |
| Shao et al. (2020) | China | 32 | 29.36 ± 0.71 17.89 ± 1.15 23.50 ± 0.34 | International Beginners Non-athletes | 18.13 ± 2.48 2.84 ± 0.57 | Shooting | |
| Spierer et al. (2010) | United States | 35 | 20.7 ± 2.3 | National | NR | Soccer, lacrosse | |
| Śliż et al. (2023) | Poland | 118 | 19.60 ± 3.16 | National | 7.69 ± 2.43 | Handball | |
| Śliż et al. (2022) | Poland | 49 | 26.5 ± 5.2 | National | NR | Rugby | |
| Tønnessen et al. (2013) | NR | 1319 | 16–47 | International | NR | Sprint | |
| Van Leeuwen et al. (2017) | Netherlands | 17 | 19.9 ± 1.8 21.6 ± 1.7 | International Non-racing | 8.4 ± 3.0 | Racing | |
| Xie et al. (2022) | China | 527 | NR | National | NR | Track and field | |
| Yildiz et al. (2020) | Turkey | 73 | 22.0 ± 2.7 | National | 10.7 ± 2.9 | Soccer | |
Table 2
Summary of methodological details of each psychomotor and basic cognitive abilities studies.
| Study | Study design | Methodological details | ||||||||||
|---|---|---|---|---|---|---|---|---|---|---|---|---|
| Performance nomenclature | Performance procedures | Tools | Outcome variables | Outcome units | ||||||||
| Alves et al. (2013) | Cross-sectional | Perceptual-cognitive expertise | Computer tests | Task Switching, Useful Field of View, Visual short-term memory, Stopping, Flanker, Change detection | Mean RT, Mean accuracy | Miliseconds, Seconds | ||||||
| Bennett et al. (2020) | Cross-sectional | Cognitive performance | CNS Vital Signs program Trails A via the iCOMET | Symbol digit, Coding, Finger-tapping, Stroop-like test | Correct answers, Reaction time | Numbers, Miliseconds | ||||||
| Bianco et al. (2008) | Cross-sectional | Cognitive functions | CogSport computerized NP test battery | Detection task, Identification task, Monitoring task | Mean reaction time, Errors, Reaction time change | Miliseconds, %, % | ||||||
| Chan et al. (2011) | Cross-sectional | Cognitive capability, Executive functions | Computer test | Go/no-go task | Simple RT mean, Mean commission error, Mean omission error | Miliseconds | ||||||
| Cojocariu et al. (2019) | Cross-sectional | Visual choice reaction time | Computer tests | Visual choice, reaction time | Mean reaction time | Miliseconds | ||||||
| Cona (2015) | Cross-sectional | Cognitive functioning | Computer tests | Inhibitory control task | Mean accuracy, Mean reaction time | Number Miliseconds | ||||||
| Eriksson et al. (2023) | Cross-sectional | response inhibition | Computer test | Stop-signal task | Reaction time go trials, Signal-respond reaction time, Stop-signal reaction time, Stop-signal delay, Accuracy | Miliseconds Miliseconds % | ||||||
| Faro et al. (2020) | Cross-sectional | Cognitive performance | Computer tests, E-prime 2.0 | Go/NoGo, Stroop color-word, Matching test | Accuracy, Response Time, Response Time variability | %, Miliseconds, Miliseconds | ||||||
| Garrido-Palomino et al. (2020) | Cross-sectional | Attention | Vienna Test System 26.04 | Signal detection, Determination task | Visual scanning accuracy, Selective attention accuracy, Speed response | % % Miliseconds | ||||||
| Harmenberg et al. (1991) | Cross-sectional | Fencing Performance | Self-design protocol | Hitting target | Reaction time, Movement time, Total time | Miliseconds, Miliseconds, Miliseconds | ||||||
| Hülsdünker et al. (2021) | Nonrandomized controlled trials | Reaction speed | Lab Test | Reaction task | Reaction time, Monosensory reaction time, Multisensory reaction time | Miliseconds, Miliseconds, Miliseconds | ||||||
| Kida et al. (2021) | Cross-sectional | Go/Nogo reaction, simple reaction time | Computer tests | Simple reaction task Co/No Go task | Simple reaction time, Go/No Go reaction time, Commission error rate, Go/No Go, Error rate | Miliseconds, Miliseconds % % | ||||||
| Liu et al. (2018) | Cross-sectional | Simple and choice reaction time | FITLIGHT Trainer™ System | Simple reaction time, Choice reaction time | Response time | Miliseconds | ||||||
| López Del Amo et al. (2018) | Cross-sectional | Reaction time | provided by the IAAF | Reaction time | Reaction time | Seconds | ||||||
| Lynch et al. (2019) | Cross-sectional | Perception-action performance | Computer Assisted Virtual Environment | Perception task, Perception-action task | Correct response, Response time | % Seconds | ||||||
| Markowski et al. (2023) | Cohort study | Response time | Pegasus Speedway telemetry system | Real-time analysis | Reaction time | Seconds | ||||||
| Nian et al. (2023) | Cross-sectional | Visual search response | E-prime 3.0 | Visual search task | Total reaction time, Correct rate | Miliseconds, % | ||||||
| Oudejans et al. (1997) | Cross-sectional | Movement initiation | Self-design protocol | Perceptual location task | Mean movement initiation time, Incorrect responses | Miliseconds | ||||||
| Petrenko et al. (2021) | Cross-sectional | Psychomotor characteristics | Psychophysio- logical Test System | Real-time analysis | Simple visual-motor response, Simple sensorimotor response, Sensorimotor dynamic coordination, Dynamic visual, response speed | Miliseconds, Miliseconds, Ratio, Number | ||||||
| Russo et al. (2022) | Cross-sectional | Visual search ability | Psychtoolkit | Visual search test | Reaction Time, Correct responses | Miliseconds | ||||||
| Shao et al. (2020) | Cross-sectional | Executive functions | E-prime | Flanker task | Accuracy, Reaction time | Miliseconds | ||||||
| Spierer et al. (2010) | Cross-sectional | Response to stimuli | Cybex Reactor | Cybex reactor | Reaction time, Move time | Seconds, Seconds | ||||||
| Śliż et al. (2023) | Cross-sectional | Psychomotor abilities | Test2Drive Computer System | SIRT, CHORT, HECOR, SPANT | Reaction time, Movement time, Correct answers | Miliseconds, Miliseconds % | ||||||
| Śliż et al. (2022) | Cross-sectional | Psychomotor abilities | Test2Drive Computer System | SIRT, CHORT, HECOR, SPANT | Reaction time, Movement time, Correct answers | Miliseconds, Miliseconds % | ||||||
| Tønnessen et al. (2013) | Cross-sectional | Reaction Time | IAAF official website | Reaction time | Mean Reaction time | Seconds | ||||||
| Van Leeuwen et al. (2017) | Cross-sectional | Reaction time and visual-motor performance | Tatuus Formula Renault 2.0 chassis | Choice reaction Time task, Visual-motor task | Choice reaction time, Root mean square | Miliseconds | ||||||
| Xie et al. (2022) | Cross-sectional | Reaction Speed | Swiss OF02-ATΩ starting foul monitor to monitor | NR | Average starting, Reaction time | Seconds | ||||||
| Yildiz et al. (2020) | Cross-sectional | Reaction Time | Lafayette MOART system | Visual reaction Test | Reaction time | Miliseconds | ||||||
Of note, eight studies explored psychomotor and cognitive variables in team sports athletes, accounting for 25% of the total (Alves et al., 2013; Kida et al., 2005; Lynch et al., 2019; Nian et al., 2023; Spierer et al., 2010; Śliż et al., 2022, 2023; Yildiz et al., 2020). Furthermore, more than 60% of the studies focused on individual sports. Seven studies examined psychomotor and cognitive abilities specifically in combat sports (Bennett et al., 2020; Bianco et al., 2008; Chan et al., 2011; Cojocariu et al., 2019; Faro et al., 2020; Harmenberg et al., 1991; Liu et al., 2018), while another five focused on track and field disciplines (Cona et al., 2015; López Del Amo et al., 2018; Petrenko et al., 2021; Tønnessen et al., 2013; Xie et al., 2022). Other sports, including speedway, car racing, climbing, shooting, badminton, biathlon, and skiing, were also investigated, although each of these sport disciplines was considered in only one study. Additionally, one study categorised activities into open and closed sports (Russo et al., 2022), thereby combining various sports in their analysis.
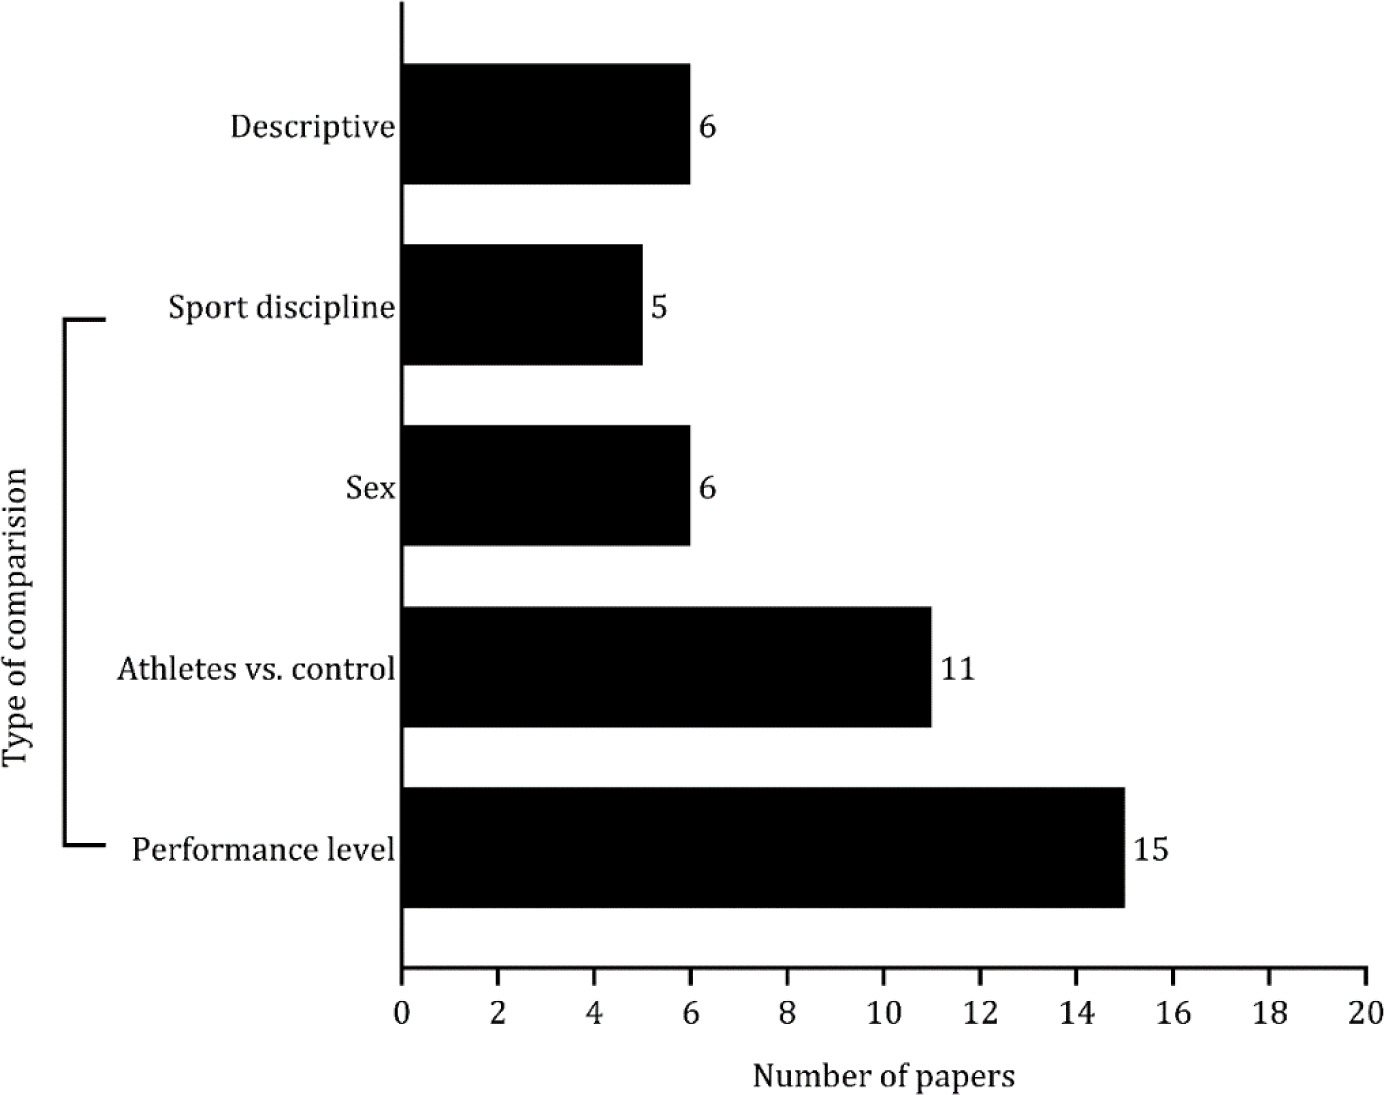
The studies were organized based on the type of comparisons made. As shown in Figure 2, 12 studies contrasted athletes with different competitive or skill levels (Alves et al., 2013; Bianco et al., 2008; Chan et al., 2011; Cona et al., 2015; Harmenberg et al., 1991; Kida et al., 2005; Liu et al., 2018; Lynch et al., 2019; Nian et al., 2023; Oudejans et al., 1997; Shao et al., 2020; Śliż et al., 2022). Eight studies assessed differences in psychomotor and cognitive abilities between professional athletes and a control group (i.e., the general population) (Alves et al., 2013; Chan et al., 2011; Cojocariu et al., 2019; Kida et al., 2005; Liu et al., 2018; Shao et al., 2020; Śliż et al., 2023; Van Leeuwen et al., 2017). Comparisons based on sex were performed in five studies (Bennett et al., 2020; Eriksson et al., 2023; Spierer et al., 2010; Tønnessen et al., 2013; Xie et al., 2022). Lastly, four studies examined differences in psychomotor and cognitive outcomes by the type of sport (Eriksson et al., 2023; Kida et al., 2005; Petrenko et al., 2021; Russo et al., 2022), while five studies solely described the levels of these outcomes (Garrido-Palomino et al., 2020; Harmenberg et al., 1991; Hülsdünker et al., 2021; Markowski et al., 2023; Yildiz et al., 2020).
Methodological Issues and Outcomes
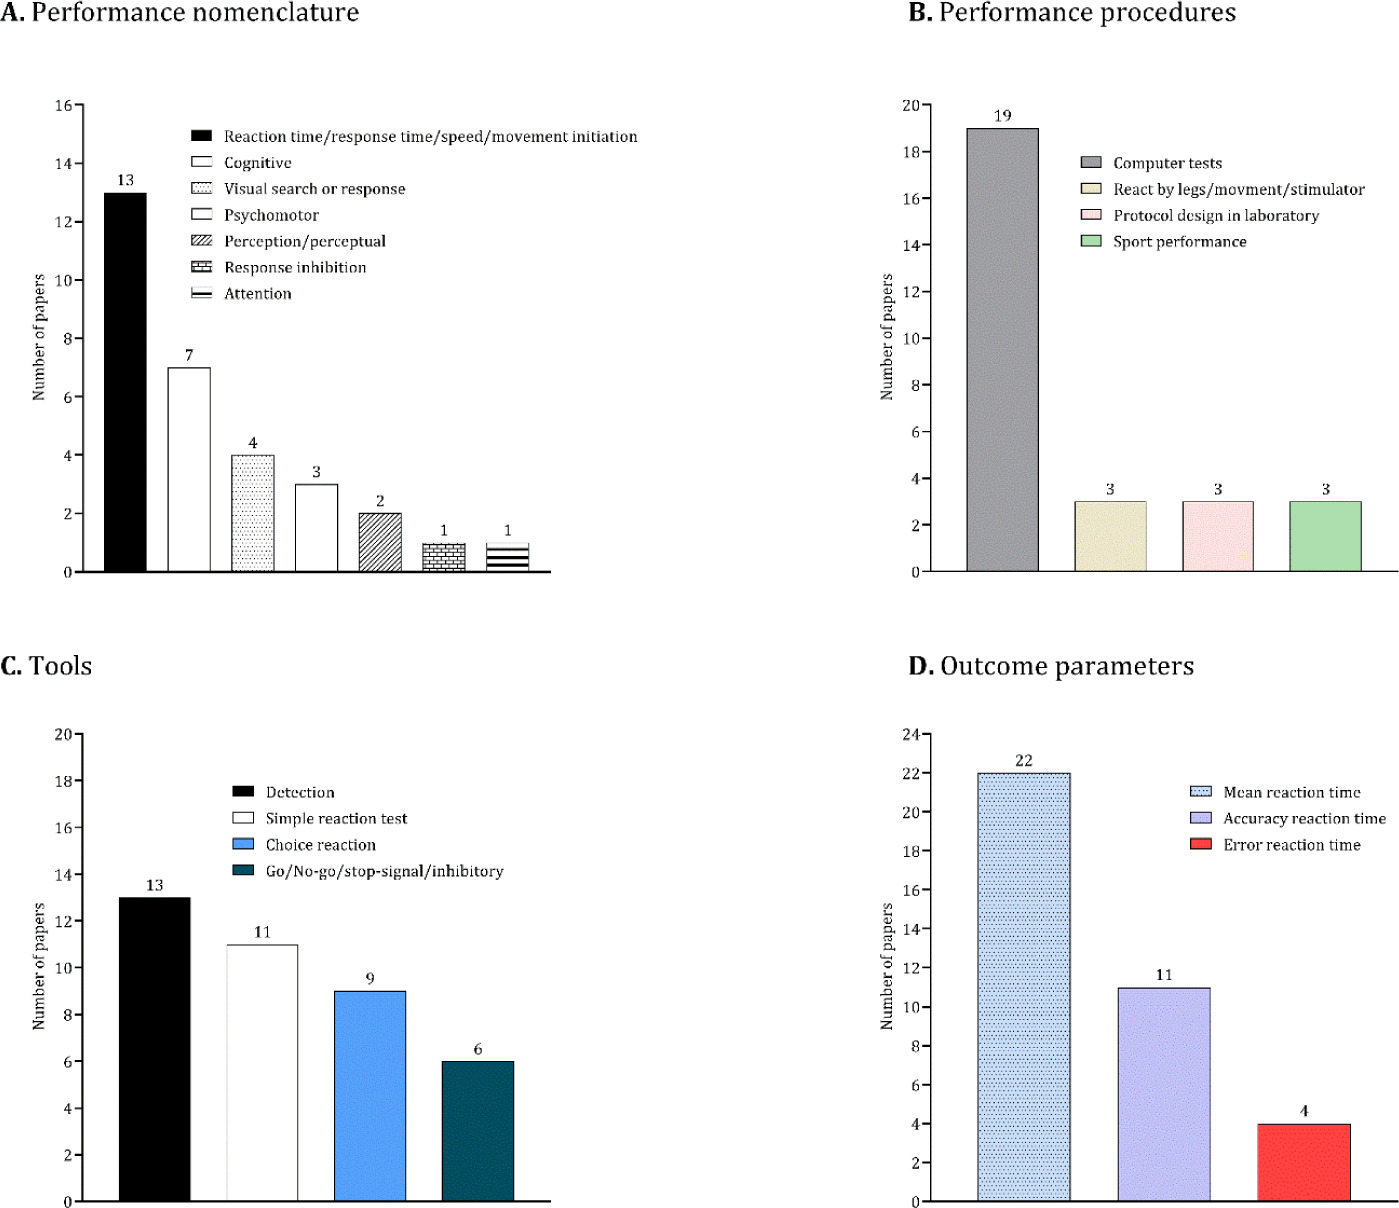
Table 2 summarizes the methodological details of each study. As depicted in Figure 3, 13 studies (approximately 42%) utilized the performance nomenclature “reaction time/response time/speed/movement initiation”, while seven studies (approximately 31%) focused on “cognitive” performance. Other performance terminologies included “psychomotor”, “perception/perceptual”, “visual search/response”, “response inhibition”, and “attention”. In terms of performance procedures, 19 studies (approximately 39%) employed a computer system. The most common tests used to extract outcomes were detection (13 studies), the simple reaction time test (11 studies), and the choice reaction test (9 studies). Notably, the most prevalent outcome examined was the mean value of reaction time, assessed in 22 studies.
Comparisons by Competitive Level, Sex and Sport
Tables 3–5 present comparisons of psychomotor and cognitive abilities across competitive levels, sex, and types of sport. In 56 comparisons, elite or expert athletes generally demonstrated better performance than those at lower competitive levels or control groups. Conversely, novices, non-experts or debuting athletes exhibited superior performance outcomes in 12 of the 52 comparisons (approximately 23%). Regarding sex comparisons, the findings across studies were inconsistent, with two studies favouring males and two favouring females. Additionally, only three studies examined psychomotor and cognitive abilities by the type of sport, and no significant differences were found.
Table 3
Comparisons of athletic participation among participants of various sports levels and a control group.
| COMPARISION BY THE SPORTS LEVEL | ||||
|---|---|---|---|---|
| Study | Outcome | Groups: mean ± SD | p-value | Favours* |
| Alves et al. (2013) | Single switching task RT | Elite: 570.88 ± 8.42 Control: 596.18 ± 9.30 | 0.05 | Elite |
| Go task RT | Elite: 746.48 ± 15.13 Control: 656.66 ± 16.45 | 0.001 | Elite | |
| Change detection task | Elite: 7.23 ± 0.17 Control: 7.70 ± 0.17 | 0.006 | Elite | |
| Bianco et al. (2008) | Detection task SRT 1st trial | Elite: 0.244 ± 0.007 Debuting: 0.249 ± 0.007 | 0.005 | Debuting |
| Detection task SRT 2nd trial | Elite: 0.247 ± 0.007 Debuting: 0.251 ± 0.008 | 0.028 | Debuting | |
| Chan et al. (2011) | Simple RT | Elite: NR Non-athletes: NR | 0.20 | No differences |
| Motor speed | Elite: NR Non-athletes: NR | 0.84 | No differences | |
| Go/no go | Elite: NR Non-athletes: NR | 0.94 | No differences | |
| Cojocariu et al. (2019) | VCTR 1 | Elite: NR; Non-athletes: NR | 0.018 | Elite |
| VCTR 1 Red dots, white background DH | Elite 364.4 ± 12.3 Non-athletes 408.02 ± 7.4 | 0.033 | Elite | |
| VCTR 1 Red dots, white background NDH | Elite 361.8 ± 7.5 Non-athletes 404.3 ± 6.8 | 0.021 | Elite | |
| VCRT 2 | Elite: NR; Non-athletes: NR | 0.005 | Elite | |
| VCRT 2 Blue dots, white background DH | Elite 363 ± 11.5 Non-athletes 405.3 ± 6.3 | 0.015 | Elite | |
| VCRT 2 Blue dots, white background NDH | Elite NDH: 353 ± 8.5 Non-athletes 403.1 ± 6.3 | 0.004 | Elite | |
| VCRT 3 | Elite: NR; Non-athletes: NR | 0.05 | Elite | |
| VCRT 3 White dots, red background DH | Elite 367.7 ±15.6 Non-athletes 407.1 ± 7.3 | 0.52 | Elite | |
| VCRT 3 White dots, red background NDH | Elite 368.4 ± 14.6 Non-athletes 405.9 ± 6.9 | 0.05 | Elite | |
| VCRT 4 | Elite: NR; Non-athletes: NR | 0.023 | Elite | |
| VCRT 4 Blue dots, red background DH | Elite 368 ± 13.5 Non-athletes 415.04 ± 6.5 | 0.01 | Elite | |
| VCRT 4 Blue dots, red background NDH | Elite 382.5 ±9.4 Non-athletes 412.7 ± 6.7 | 0.096 | Elite | |
| VCRT 5 | Elite: NR ; Non-athletes: NR | 0.043 | Elite | |
| VCRT 5 White dots, blue background DH | Elite 367.5 ± 14.06 Non-athletes 405.2 ± 6.4 | 0.037 | Elite | |
| VCRT 5 White dots, blue background NDH | Elite 375.8 ± 10.03 Non-athletes 408.5 ± 7.3 | 0.099 | Elite | |
| VCRT 6 | Elite: NR; Non-athletes: NR | 0.009 | Elite | |
| VCRT 6 Red dots, blue background DH | Elite 369 ± 13.5 Non-athletes 415.06 ± 7.1 | 0.02 | Elite | |
| VCRT 6 Red dots, blue background NDH | Elite 360.8 ± 8.6 Non-athletes 406.3 ± 6.5 | 0.01 | Elite | |
| Cona (2015) | RT | Elite: 455 ± 16.97 Intermediate: 438 ± 8.90 | 0.01 | Intermediate |
| Harmenberg et al. (1991) | Total Time (RT + MT) | Elite 0.607 ± 0.079 Non-athletes 0.731 ± 0.04 | 0.006 | Elite |
| Kida et al. (2021) | Go/no go RT | Elite baseball: 293 ± 37 Intermediate Tennis: 332 ± 34 | 0.05 | Elite |
| Go/no go RT | Elite baseball: 293 ± 37 Non-athletes: 347 ± 46 | 0.01 | Elite | |
| Liu et al. (2018) | SRT | Elite: 292.33 ± 45.4 Novice: 306.33 ± 47.05 Non-athletes: 335.43 ± 73.05 | 0.001 | Elite |
| CRT | Elite: 352.11 ± 35.9 Novice: 376.28 ± 61.38 Non-athletes: 423.7 ± 63.58 | 0.001 | Elite | |
| Lynch et al. (2018) | Perception accuracy | Experts: 75.30 ± 31.92% Novices: 61.27 ± 38.13% | 0.001 | Novices |
| Nian et al. (2023) | Visual Search Reaction Time | Elite: 1388.82 ± 165.27 Novices: 1744.18 ± 213.58 Semi-elite: 1625.75 ± 197.31 | 0.001 | Elite |
| Initiation Reaction Time | Elite: 279.95 ± 18.31 Novices: 312.75 ± 29.58 Semi-elite: 304.64 ± 29.12 | 0.001 | Elite | |
| Oudejans et al. (1997) | Foot Movement Initiation Time | Experts: 350 Non-experts: 265 | 0.06 | Non-experts |
| Shao et al. (2020) | RT Inconsistent Trails 300 IS | Experts: 183.05 ± 15.85 Controls: 210.70 ± 25.93 | 0.041 | Experts |
| RT Inconsistent Trails 300 IS | Novices: 175.82 ± 31.65 Controls: 210.70 ± 25.93 | 0.037 | Novices | |
| RT Inconsistent Trails 400 ISI | Experts: 192.28 ± 20.63 Controls: 239.78 ± 43.29 | 0.041 | Experts | |
| RT Inconsistent Trails 400 ISI | Novices: 195.15 ± 25.68 Controls: 239.78 ± 43.29 | 0.037 | Novices | |
| RT Consistent Trails 300 ISI | Experts: 173.39 ± 16.37 Controls: 206.74 ± 36.18 | 0.015 | Experts | |
| RT Consistent Trails 300 ISI | Novices: 165.50 ± 11.97 Controls: 206.74 ± 36.18 | 0.010 | Novices | |
| RT Consistent Trails 400 ISI | Experts: 172.97 ± 20.45 Controls 227.92 ± 49.46 | 0.015 | Experts | |
| RT Time Consistent Trails 400 ISI | Novices: 169.05 ± 19.38 Controls 227.92 ± 49.46 | 0.010 | Novices | |
| Śliż et al. (2023) | Simple RT | Elite rugby: 356.0 ± 34.4 Non-athletes: 332.4 ± 41.7 | 0.0389 | Non-athletes |
| Simple MT | Elite rugby: 158.1 ± 38.0 Non-athletes: 192.1 ± 47.4 | 0.0089 | Elite | |
| Choice MT | Elite rugby: 170.3 ± 42.4 Non-athletes: 214.7 ± 48.0 | 0.0014 | Elite | |
| Hand-eye Coordination MT | Elite rugby: 206.3 ± 31.4 Non-athletes: 243.0 ± 50.9 | 0.0065 | Elite | |
| Śliż et al. (2022) | Simple MT | Elite: 216.29 ± 32.71 Professionals: 201.54 ± 37.40 Intermediate: 185.32 ± 34.23 | 0.017 | Intermediate |
| Choice RT | Elite: 650.82 ± 45.07 Professionals: 670.17 ± 70.85 Intermediate: 698.71 ± 58.77 | 0.014 | Elite | |
| Hand-eye Coordination MT | Elite: 259.71 ± 27.95 Professionals: 241.73 ± 39.15 Intermediate: 229.87 ± 31.52 | 0.017 | Intermediate | |
| Van Leeuwen et al. (2017) | RT | Elite: 431.6 ± 35.8 Non-athletes: 439.5 ± 34.2 | 0.6689 | No significant differences |
Table 4
Comparisons of psychomotor/cognitive abilities by sex.
| COMPARISION BY SEX | ||||
|---|---|---|---|---|
| Study | Outcome | Groups: mean ± SD | p-value | Favours* |
| Bennett et al. (2020) | Performance of psychomotor speed measure | Males: NR Females: NR | 0.005 | Females |
| Eriksson et al. (2023) | SSRT | Males: 136.78 ± 48.90 Females: 157.76 ± 34.98 | 0.018 | Males |
| Garrido-Palomino et al. (2020) | RT | Males: 660 ± 46.8 Females: 679 ± 33.5 | p > 0.05 | No differences |
| Spierer et al. (2010) | RT | Males 0.1782 ± 0.189 Females 0.1317 ± 0.192 | 0.05 | Females |
| Tønnessen et al. (2013) | RT | Males: 0.166 ± 0.030 Females: 0.176 ± 0.034 | 0.05 | Males |
Table 5
Comparisons of psychomotor/cognitive abilities by type of sport.
| COMPARISION BY THE SPORT DISCIPLINE | ||||
|---|---|---|---|---|
| Study | Outcome | Groups: mean ± SD | p-value | Favours* |
| Eriksson et al. (2023) | SSRT | Alpine skiers 145.63 ± 40.93 Biathletes 150.47 ± 39.16 Non-athletes 149.99 ± 47.67 | 0.89 | No differences |
| Kida et al. (2021) | Go/no go reaction time | Baseball: 293 ± 37 Tennis: 332 ± 34 | 0.05 | Elite |
| Russo et al. (2022) | RT | OSA: 1023.6 ± 22.02 CSA: 1162.6 ± 28.1 | 0.94 | OSA |
Risk of Bias Assessment
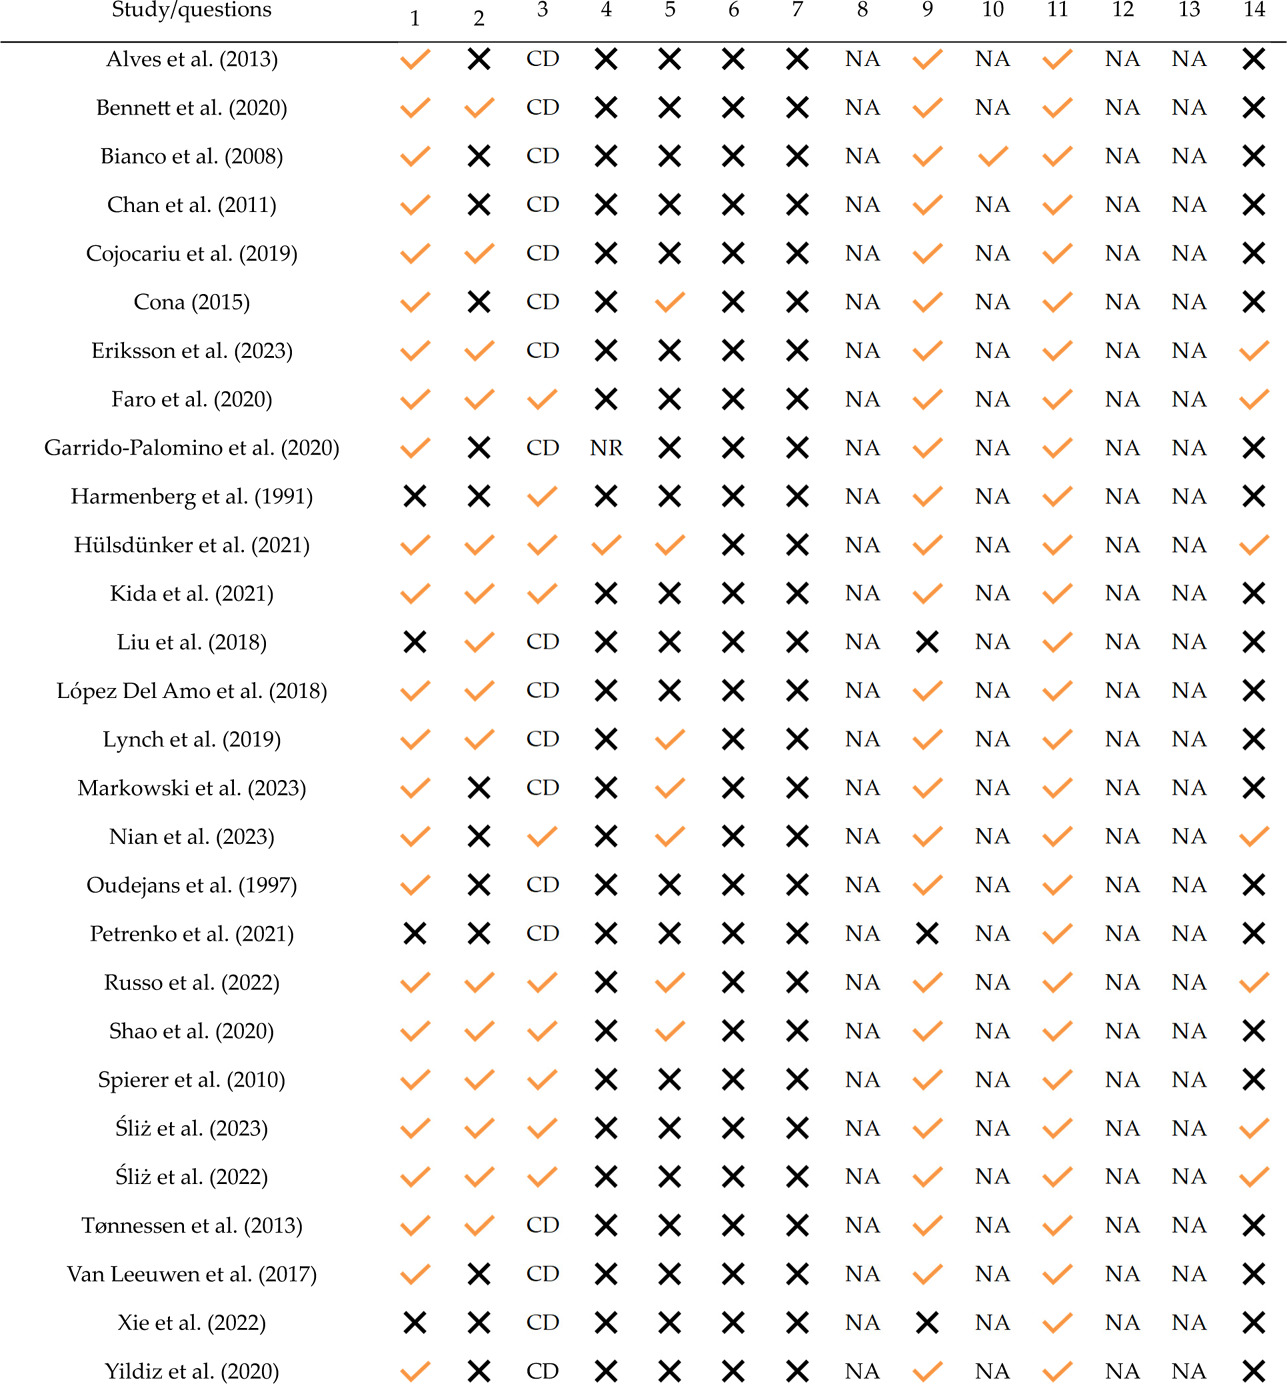
Table 6 summarizes the risk of bias assessment for each study. The research objectives were clearly defined in 22 studies, accounting for approximately 78% of the total. Thirteen studies lacked a comprehensive description of the characteristics of the examined population. Other significant issues identified in the risk of bias assessment included the calculation of sampling power, which was conducted in only five studies, and the adjustment for confounding variables, which was addressed in only 25% of the studies. In contrast, the descriptions of dependent and independent variables were sufficiently provided in more than 90% of the studies.
Discussion
The topic of cognitive abilities and psychomotor skills is frequently explored in research on professional sport (Habay et al., 2021; Kalén et al., 2019; Scharfen and Memmert, 2019). This review critically examines methodological details such as performance nomenclature as well as procedures and tools related to the assessment of psychomotor and cognitive abilities. The objective was to examine cognitive processes associated with perception, attention, and response to stimuli, with a particular emphasis on their measurement and analysis in scientific research. A notable challenge revealed by the review is the terminological inconsistency in describing cognitive and psychomotor measurements. The terms “reaction” or “response”, “perceptual/visual”, “psychomotor” and “cognitive processes” are often used interchangeably, even when referring to similar constructs and procedures. No specific rule was identified that characterized the method of use of these terms. The primary feature of this measurement was that it combined the fields of knowledge related to psychology, neuropsychology, sports training, and motor control (Block et al., 2017; Markov and Lebedinsky, 2014). For this reason, addressing the selection and description of methods is crucial (Mann et al., 2007), as it can contribute to the design of a more effective research intervention. The most frequently applied approach was computer-based. The methods utilized were generally broad rather than sport-specific, contrary to those which accounted for the contextual factors of athletic performance. The most measured outcomes included median reaction time, motor time or performance accuracy. Using such methods implies a risk that they may not fully reflect the cognitive processing of information under real-world conditions.
In the present review, we demonstrated significant variability in sample sizes across studies as study groups ranged from small to very large (Oudejans et al., 1997; Tønnessen et al., 2013). This may have introduced uncertainty in the selection of methodological approaches and the interpretation of results. The risk of bias analysis revealed that only a limited number of studies applied methods of justification to the sampling size selection.
Moreover, comparative analyses were conducted based on the study selection. These comparisons primarily concerned the sports level, as well as sex and the specific sport discipline. For the most part, better performance was observed in elite athletes. Surprisingly, there were 12 studies favoring novices, non-expert or debuting athletes when compared to the elite. In the expert-novice research paradigm, differences between skilled and less skilled athletes are evident due to greater experience in anticipation and direct perception (Jacobson and Matthaeus, 2014). The outcomes can differentiate among athletes in the context of a sport discipline thus appropriate methods should be adapted to the characteristics of the sport discipline (Kaluga et al., 2020). When representatives of different sports perform various tasks, comparing and making general conclusions about the impact of a sport discipline may be limited (Рiatysotska et al., 2023). In addition, there have been studies making comparisons with non-athletes. It is also well-known in the literature that sports training stimulates the neural transmission by enhancing the functioning of perception, attention and reaction, thus comparing athletes to non-athletes results in a preconceived advantage for athletes (Fadde, 2009; Sagdilek and Sahin, 2015; Suppiah et al., 2016).
The topic of psychomotor assessment has become multidisciplinary, and there is still a lack of answers regarding a human’s response and behaviours under situational and contextual conditions, as presented solely by computer-based measurements (Krivokapic and Tanase, 2016). Regarding the methodology details, computer-based methods were most frequent in the included studies. However, although the applied methods were generally called “computer methods”, no specific names of the employed system were provided. Such studies included only a description of the specific task or test, along with the proper way to perform it, yet no further specific details were provided.
When using computer-based methods, it may be difficult to find differences between athletes regardless of the type of sport they practise (Moşoi and Balint, 2015). Also, it is easier to understand and interpret the obtained results when they concern a real-situation task related to a perceptual-cognitive response (Hinz et al., 2021). For being effective in sport, the processing context and consequences of the made choice also matter (Voss et al., 2010) and in computer-based tests that part cannot be appropriately highlighted. Different sports require tasks of varying complexity levels and information to process; thus, comparisons between sports considering their cognitive dimensions are often fraught with the risk of error or inadequate representation of the subject (Aslan, 2018). Cognitive processing and its difficulty in a single or a complex task is closely related to tactical objectives in particular sport disciplines (Moreira et al., 2025). Moreover, these abilities can also depend on parental attitudes or personality traits, such as mental toughness (Vega-Díaz and González-García, 2025); thus, the topic is complex and requires a holistic approach.
The studies included in the present review were not entirely free from limitations. It needs to be highlighted that several critical gaps remain in the current body of research. First, the lack of standardisation in methodologies and nomenclature necessitates a unified framework to ensure consistency across studies. In this paper, we based our analysis on the nomenclature and findings reported by authors in their studies. Due to the critical approach, we attempted to identify potential differences in nomenclature and methods. To ensure accuracy, we conducted a risk of bias analysis. The primary limitation of the analysed studies was the lack of detailed description and a clear rationale for the selection of the study sample, which consequently influenced the methodology employed. Additionally, many studies failed to control for confounding variables, such as the duration of a simple reaction, when assessing a complex reaction. However, it is essential to note that, in most cases, both the dependent and independent variables, as well as the purpose of measurement, were described fairly and accurately, thereby contributing to the overall transparency of the analysis. The included studies were only in English, thus perhaps there exist more similar studies in other languages at a local research environment. Perhaps there are published papers that measure psychomotor or basic cognitive abilities but have been mistakenly called executive functions or otherwise. In the current work, no studies were found that included interventions or training effects on psychomotor or cognitive functioning. Furthermore, different sample sizes were considered; therefore, the obtained results may not be directly comparable. The key is to carefully select the experimental group and compare it with a suitable control group (Horoszkiewicz, 2024). However, in some of the studies, groups differed significantly in size and the skill level. Moreover, one can see clear predominance of male subjects. Next, the influence of contextual factors, such as environmental and discipline-specific factors, as well as the type of sport discipline, should be more in-depth and incorporated into future assessments. In the current review, both team and individual sport disciplines, along with Olympic and non-Olympic disciplines, were included, which implied a different choice of measurement methods, but not necessarily the naming of variables.
Conclusions
The considered topic is important for understanding the differences and processes underlying the concepts of psychomotor and cognitive abilities in the context of sports performance. By addressing these challenges, future research can enhance the validity and applicability of its findings, thereby optimising evidence-based research procedures. This knowledge can be applied in learning, cognition, sports training, and practical tips for athletes. The correct diagnosis can help predict the athlete’s development and a situational disposition under training conditions (Szwarc et al., 2021). However, one may observe a lack of clear division in research between the presented abilities as well as the gold standard in such measurements. There is a great need to plan the research protocol and distinguish between the particular concepts with more precision. This review presents a valuable attempt to clarify these two topics and systematise measurement methods for psychomotor abilities and basic cognitive processes. It is a significant contribution to knowledge regarding future publications in sports science, psychology, and cognition in sports.