Introduction
It is well documented that dehydration impairs an athlete’s physical performance, and adequate hydration is important to optimize physiological functions relevant to sports performance. Dehydration may negatively impact endurance performance (American College of Sports Medicine et al., 2007; Arnaoutis et al., 2015; Deshayes et al., 2020; Kurylas et al., 2019; Sawka et al., 2007), cognitive function (Fortes et al., 2018; Wittbrodt and Millard-Stafford, 2018), and strength and power performance (Judelson et al., 2007) in athletes. In addition, dehydration may independently affect the mood state and perceptual responses in longer duration events (Moyen et al., 2015). Dehydration, with a >2% body mass deficit, impairs soccer-specific performance, including intermittent high-intensity sprinting (McGregor et al., 1999) and passing decision-making performance (Fortes et al., 2018). Progressive fluid loss acts as a physiological stimulus to initiate conscious feelings of fatigue and thirst in elite soccer players (Edwards & Noakes, 2009). Soccer is an intermittent, team-based sport. In regular 90-min match-play, top level Europa league soccer players, run 10 to 13km (Andrzejewski et al., 2015), with ten percent of this distance performed at a high intensity (Taylor et al., 2017) resulting in significant fluid loss through sweat. Although sweat rates are significantly affected by environmental factors and vary greatly between players (Maughan et al., 2005), the average fluid loss during a soccer match is known. Previously published normative data in soccer players reported a whole body sweating rate of 0.94±0.38L/h and a 34.6±1mmol/h rate of sweat Na+ loss (Barnes et al., 2019).
Therefore, soccer players experience high training and competition workloads and are at a high risk of dehydration. A number of studies have reported that significant dehydration (˃2% body mass deficit) is a common occurrence in elite soccer players (Arnaoutis et al., 2015; Laitano et al., 2014; Nuccio et al., 2017; Ozolina et al., 2013; Phillips et al., 2014). Those authors highlighted the potential for athletes to begin physical activity in a state of dehydration. However, relatively few studies have investigated whether athletes are aware of their hydration status and how they perceive their fluid intake (Love et al., 2018). One study revealed that while soccer players were generally aware of the importance of hydration, they failed to use this knowledge in practice (Decher et al., 2008). In our experience, elite athletes failed to subjectively evaluate their beverage intake and hydration status (Klimesova et al., 2019). Drinking behaviour, which subsequently affects hydration status, is influenced by thirst and it has been suggested that thirst may provide a valid means of assessing hydration status (Armstrong, Ganio, et al., 2014). However, few studies have examined the perception of thirst as a potential marker of hydration status in professional athletes (Armstrong, Johnson, et al., 2014, 2016; Fernández-Elías et al., 2014; Hew-Butler et al., 2018). Therefore, the objective of the present study was to determine the hydration status of Czech male soccer league players, and to compare the reported beverage intake, perceived consumption of the beverage and thirst sensation between euhydrated (EU) and dehydrated (DE) athletes.
Methods
Participants
The study sample consisted of 124 Czech First League, male, soccer players. Players’ characteristics were (mean±SD): age 25.2±5.0 years, body height 182.5±6.4cm, body mass 77.6±7.3kg, body fat content 11.2±2.9%, and maximal oxygen uptake 55.7±4.2ml/kg/min. Inclusion criteria for participation in this study were as follows: each player had to a) participate in the entire laboratory testing protocol, b) be free of any health problems that might have limited performance in any laboratory test, and c) not be currently taking diuretics, including caffeine and/or alcohol, or other medications which affect water content in the body.
The institution ethics committee approved the study (ethics number 67/16) and research was performed according to the standards set by the Declaration of Helsinki. Participation was voluntary and each player gave written informed consent. All players were provided with individual feedback on results, together with health-promoting, fluid intake guidelines.
Hydration status
Although it is generally accepted that a proper identification of dehydration can only be made biochemically (e.g. USG or osmolality of blood, urine, saliva and tear), rather than relying upon clinical signs and symptoms (e.g. dark urine color or thirst sensation) (Armstrong, Kavouras, et al., 2016), there is currently no “gold standard” for hydration assessment methods. Based on American College of Sports Medicine (American College of Sports Medicine et al., 2007) and National Athletic Trainers’ Association’s (McDermott et al., 2017) recommendations USG measurement was chosen as an appropriate screening tool for classification of euhydration or dehydration in athletes. In addition, the USG assessment has been shown as a sensitive and valid measurement method in determining hydration status of elite young male soccer players (Ersoy et al., 2016).
Upon arrival at the laboratory, a midstream sample of urine was provided by each player and collected using sterile urine containers. Hydration status was assessed by urine specific gravity (USG) measures within 2 hours of receiving the samples. USG was determined by refractometry (ATAGO SUR-NE, Tokyo, Japan). Between sample readings, the refractometer was recalibrated using distilled water. Euhydration was set at USG≤1.020, and dehydration was set at USG≥ .021 (American College of Sports Medicine et al., 2007). The USG value is based on the density of the water and is therefore given a dimensionless number.
Fluid intake and thirst perception
Athletes completed a self-report Fluid intake and thirst perception questionnaire consisting of 17-items (Klimesova et al., 2019). Questions included items related to what and how much they drank on a daily basis and during training (fluid intake shortly before, during, and after training) The questionnaire also included two qualitative questions focused on thirst perception and adequate fluid replenishment. Athletes evaluated their thirst perception using a 9-point Likert scale ranging from 1 (not thirsty at all) to 9 (very, very thirsty). The Thirst rating scale used in this study was from Engel and co-authors (Engell et al., 1987). This particular Thirst scale has also been used in a number of other research papers and is considered a valid tool in young healthy men (Armstrong et al., 2014). A good previous practical experience with this Thirst scale led us to use the same scale for the evaluation of the Fluid intake (from 1=very, very poor to 9=very, very good). The same scaling allowed to make a good comparison of the results of the two self-assessment tools. Participants were instructed to answer as honestly as possible and to ask for clarification of any question, if needed. The questionnaire was developed by the research team, pilot tested on five athletes, and used in a previous research study in elite deaf athletes (Klimesova et al., 2019).
Anthropometrical measurements
Body height (cm) and body mass (kg) were measured using the SOEHNLE 7307 (Leifheit, Nassau, Germany). The percentage of body fat was determined using bioimpedance analysis (Tanita BC-418 MA, Tanita, Tokyo, Japan).
Design and procedures
Two user-friendly hydration assessment methods used in our study (USG and Thirst scale) provide an accurate assessment of the state of hydration during mild dehydration, but there are situations in which it can be changed independently of the level of hydration. These situations include rapid rehydration, alcohol and caffeine consumption, intravenous infusion, and critical illness, and severe dehydration (Kavouras, 2002). That is why athletes received standardized instructions prior to the experiment. The 48 hours before testing, participants were not exposed to any exhaustive activity, did not take medications which may have affected body water content, and consumed non-diuretic fluids ad libitum.
Athletes underwent the laboratory testing procedures as part of their annual pre-season testing. Participants visited the laboratory in the morning from 8:00 to 10:30 am and the entire protocol was performed on a single day in the following order: urine sample testing, answering a fluid intake and thirst perception questionnaire, and then all soccer players performed a laboratory testing battery (Botek et al., 2016).
The data were collected during January/February 2020, when outside temperatures in the morning ranged between -4.2 and 2.1°C, the laboratory ambient temperature was maintained between 22 to 24°C, and relative humidity between 40 and 60% (for the urine collection and questionnaire completion).
Statistical analysis
Variables are presented as mean ± standard deviation or absolute and relative frequencies. The hydration status of athletes was dichotomized as follows: euhydration (EU, USG≤1.020) and dehydration (DE, USG≥1.021) based on the recommendations of the American College of Sports Medicine (American College of Sports Medicine et al., 2007). The Kolmogorov-Smirnov test was used to verify that the studied variables had a normal distribution. The normal distribution was rejected for all variables, namely USG (p=0.010), daily fluid intake (p<0.001), intake during training (p<0.001), intake perception (p<0.001), and thirst perception (p<0.001). Therefore, nonparametric statistical methods were used. Differences in selected variables between EU and DE were evaluated using the Mann-Whitney U test. Relationships between selected variables and USG were evaluated using the Spearman’s correlation coefficient (rS). For all tests, p<0.05 was considered statistically significant. In addition, Cohen’s d effect size was calculated according to formula 1 published by Lakens (2013). The magnitudes of d and rS were interpreted using the following thresholds (Cohen, 1988): trivial (d<0.2, rS<0.1), small (d≥0.2, rS≥0.1), medium (d≥0.5, rS≥0.3), and large (d≥0.8, rS≥0.5). Statistical analyses were performed using MATLAB with Statistics Toolbox R2020a (MathWorks, Natick, MA, USA).
Results
The histogram for USG is shown in Figure 2. Hydration assessment showed that out of a total of 124 players, 55 (44%) were euhydrated and 69 (56%) were dehydrated. The sample mean for USG was 1.021±0.008. Players reported that the total daily fluid intake was 2.54±0.82L and they drank another 1.02±0.49L during training. Histograms of the fluid intake and thirst perception data, obtained from the questionnaire, are shown in Figure 1.
Figure 1
Histograms of urine specific gravity (USG), intake perception on a 9-point Likert scale, and thirst perception on a 9-point Likert scale in the group of 124 soccer players
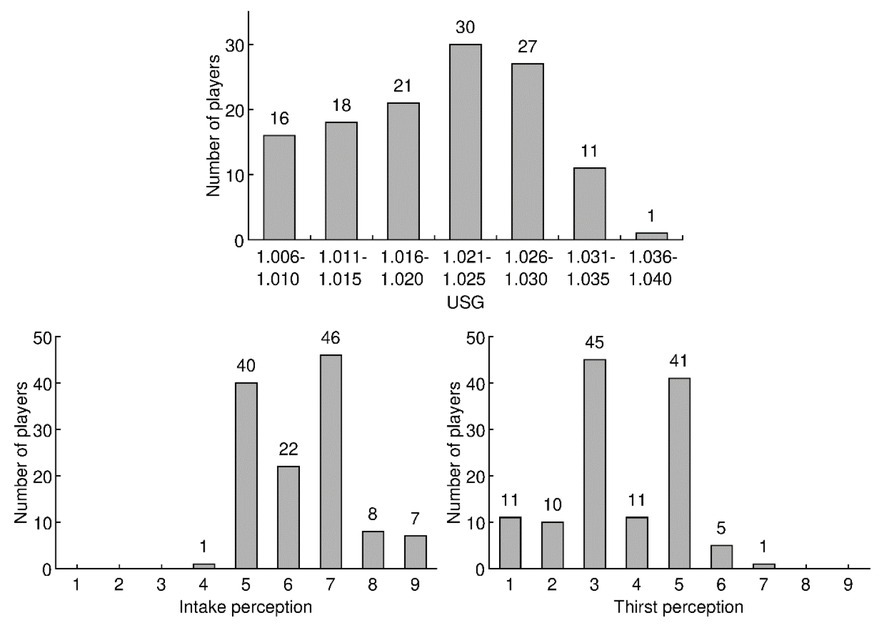
Figure 2
Comparison of daily fluid intake, intake during training, intake perception, and thirst perception between 55 euhydrated (EU) and 69 dehydrated (DE) soccer players.
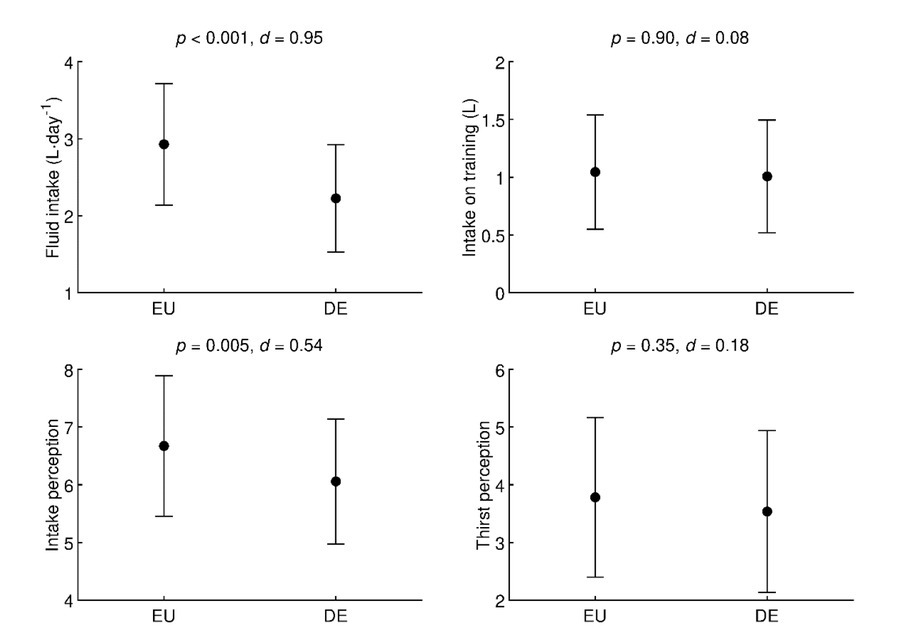
Comparisons of daily fluid intake, intake during training, intake perception, and thirst perception between EU and DE players are shown in Figure 2. Daily fluid intake was significantly (p<0.001, d=0.95, large effect) higher in EU (2.93±0.79L⋅day-1) compared to DE players (2.22±0.70L⋅day-1). Intake during training sessions was not significantly (p=0.90, d=0.08, trivial effect) different between EU (1.05±0.49L) and DE groups (1.01±0.49L). The mean value of reported intake perception scores was significantly (p=0.005, d=0.54, medium effect) better in EU (6.7±1.2) compared to DE players (6.1±1.1). However, there was no significant (p=0.35, d=0.18, trivial effect) difference in scores of thirst perception between EU (3.8±1.4) and DE players (3.5±1.4).
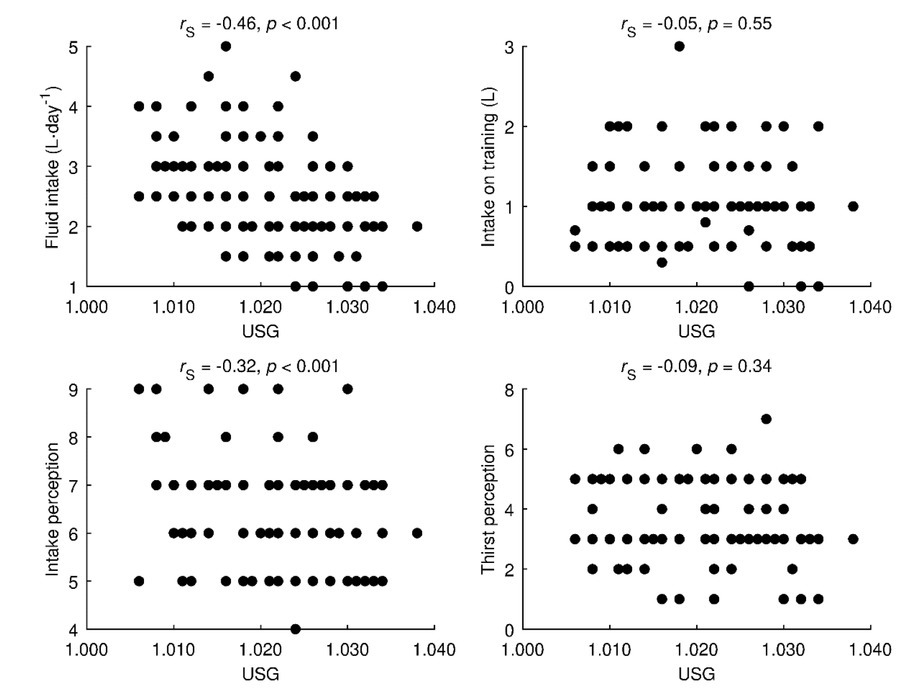
The relationships of daily fluid intake, intake during training, intake perception, and thirst perception on USG are shown in Figure 3. Daily fluid intake correlated with USG (rS=-0.46, p<0.001, medium effect). Intake during training sessions did not correlate with USG (rS=-0.05, p=0.55, trivial effect). Reported intake perception scores were correlated with USG (rS=-0.32, p<0.001, medium effect). However, there was no significant correlation (rS=-0.09, p=0.34, trivial effect) between thirst perception scores and USG.
Discussion
The primary aim of this study was to evaluate the prevalence of dehydration, and compare the reported beverage intake, perceived fluid consumption, and thirst sensation between EU and DE elite male soccer players who attended their annual, winter pre-season laboratory testing. The winter pre-season testing period was chosen, as this allowed for better standardisation, related to consistency in training loads and players’ recovery. We hypothesized that the majority of the soccer players would be dehydrated, and the EU compared to DE players would report higher daily beverage intake, would perceive its drinking as better, and feel less thirsty.
The main findings of this study are as follows: 1) 56% (69 out of 124) of the Czech First League soccer players were categorized as dehydrated based on their morning urine sample; 2) EU compared to DE players reported significantly higher beverage intake; 3) daily fluid intake was negatively associated with USG; 4) reported intake perception scores were negatively associated with USG; and 5) there was no significant correlation between thirst perception scores and USG.
Similarly to our results, dehydration is a common finding in elite soccer players and abundant research has documented the high incidence of dehydration associated with high environmental temperatures (Arnaoutis et al., 2013; Kurdak et al., 2010; Laitano et al., 2014; McDermott et al., 2017; Nuccio et al., 2017). For instance, based on morning USG, it was shown that 89% of soccer players (n=59; age 15.2±1.3 years) during a training camp in the heat (27-29°C) were dehydrated (Arnaoutis et al., 2013). Nevertheless, a high incidence of significant dehydration even in cold climates is described in the literature. One study reported that 65% of first league, male, soccer players (n=40; age 20.5±3.5 years) were dehydrated before training in winter (USG>1.020) (Ozolina et al., 2013). In a soccer field study, Phillips et al. (Phillips et al., 2014) examined the hydration status of 14 male players (age 16.9±0.8 years) during three consecutive training sessions in April and May (approximately 8.9°C and 17.2°C), and based on USG, they found that most participants were dehydrated upon waking (77% on days 1 and 3, and 62% on day 2). More recently, another study demonstrated that 57.5% of Estonian (n=40; age 22.1±3.4 years) and 65.9% of Latvian (n=41; age 20.8±3.4 years) semi-professional soccer players began their training sessions in a dehydrated state (USG>1.020). The weather at the time of training sessions was cool (approximately -5.1°C and 0.2°C, respectively) (Kiitam et al., 2018). The current study was also performed during winter and showed similar results, with most of the players dehydrated. These findings suggest that maintaining optimal hydration during daily soccer training is a challenge, even in a cold climate. For athletes, drinking alkalize water seems to be beneficial to enhance hydration status (Chycki et al., 2018).
In the present study, EU soccer players reported significantly higher daily beverage intake than DE athletes (p<0.001, d=0.95), with no difference between groups relaed to drinking beverages during training. Therefore, it is proposed that the key factor for good hydration is the drinking regime of players outside training sessions. Coaches and dietitians should educate players about the importance of hydration even outside the training field.
Our results also show that fluid intake perception negatively correlated with USG (rS=0.46, p<0.001), and the difference in beverage consumption between EU and DE players was in line with the difference in their evaluation of beverage intake. EU players perceived their consumption as very good in contrast to DE who scored it neither good nor poor. Based on this finding the perceived beverage intake was related to the state of hydration, and players were able to adequately evaluate their hydration needs. However, these results contradict the findings of Love et al. (Love et al., 2018) who examined athletes’ perceived and measured indices of fluid balance during training. They found that the majority of players (78%) had difficulty in accurately perceiving fluid intake and fluid loss during training. Similar findings were also reported in our previous study (Klimesova et al., 2019), where elite deaf athletes perceived their beverage consumption to be better than what the objective laboratory indicator (USG) showed. The reported consistency between the subjective and objective indicators of hydration in the present study may reflect that first league players were well supported in terms of hydration education and access to hydration. Another reason may be related to the long-term cooperation with a physiological laboratory, resulting in the players being educated and better able to perceive their body's reactions to stress and their physiological needs. However, it is true that there was still a high percentage of players who were dehydrated.
To determine the intensity of thirst we used a thirst scale which included statements with an assigned value (Engell et al., 1987). Specifically, a rating of 1 meant “not thirsty at all” and a rating of 3 meant “a little thirsty”. Therefore, all ratings between 1–3 represented no or mild thirst sensations. Interestingly, the mean thirst rating ranged from 3-4 points in both the EU and DE players. With regard to the subjective rating, there was no difference between the mean thirst rating of EU and DE groups, and there was also no significant correlation between thirst and USG perception scores (rS=-0.09, p=0.34). In respect to differences between EU and DE athletes in daily beverage consumption and the perceived beverage consumption, it was surprising that based on perception of thirst intensity, players failed to adequately asses their hydration needs.
Although, it seems intuitive that water intake according to thirst is sufficient to correctly fulfil fluid needs (Armstrong, Ganio, et al., 2014; Machado-Moreira et al., 2006), the National Athletic Trainers’ Association position statement recommends athletes to drink more than thirst dictates (McDermott et al., 2017b). Drinking behaviour is, at its essence, driven by thirst, but it is well documented that at rest, thirst is not perceived until there is a loss of 1-2% of body mass (Adolph, 1947). Therefore, thirst could be considered a later sign of dehydration (McDermott et al., 2017b). These findings may explain why we found no differences between EU and DE players in the perception of thirst. Although most of the players were classified as dehydrated, the sample mean for USG was 1.021 ± 0.008, thus the dehydration level met the lower limit (edge) of dehydration. Therefore, we speculate that players were not yet at a level of dehydration that would affect the perception of thirst. Another explanation is that thirst sensation could be attenuated in the cold. Players were exposed to a cold temperature shortly before coming in to the lab and completing a questionnaire. A reduced sensation of thirst while training in the cold was the explanation provided for the findings of Maughan et al. (Maughan et al., 2005) who focused on sweat loss and drinking behaviour in soccer training in a cool environment. Comparison of fluid intake in players training in cool (5°C, relative humidity 81%) and moderate (25°C, relative humidity 60%) environments, showed that although sweat losses were similar in the two environments (difference less than 9%), fluid intake in the cool condition was approximately 50% of that in the moderate temperature (Maughan et al., 2005).
The current study is limited in that participants were elite male soccer players. This means that the present findings may not be generalized to athletes in other age groups, females, or a sports discipline. Future studies should examine whether our findings can be confidently extrapolated beyond the participants used. Despite this limitation, the study has several strengths. We are aware that the use of USG measurement to quantify hydration status is recognized by some authors as problematic (Zubac et al., 2018), however, the method is frequently used in many field studies because it has demonstrated good sensitivity and specificity compared with osmolality measures (McDermott et al., 2017b). In addition, the use of the USG threshold of >1.020 in the current study is well-accepted to quantify hydration status (American College of Sports Medicine et al., 2007; Buchholz et al., 2003; Cheuvront et al., 2010; Phillips et al., 2014).
To conclude, the results reveal that the prevalence of dehydration is high in a group of Czech male professional soccer players. Both well and poorly hydrated players ingested a comparable amount of fluids during training. The difference between the groups was the amount of fluid ingested outside the training period. These findings suggest that players must be better educated about the importance of fluid intake, not only in relation to performance, but also outside training. In addition, the perception of thirst was not a sufficiently sensitive indicator of the current state of hydration. Based on the findings of the present study, we recommend monitoring the hydration state of soccer players periodically and consistently educating them on the appropriate way to replenish fluids throughout the day.