Introduction
Running demands of professional soccer players during match-play have been widely studied in the last 20 years (Rivilla-García et al., 2019). This increase in time-motion research has improved our understanding of the global match demands (Paul et al., 2015) and position-specific locomotor activity profiles (Dalen et al., 2016; Suarez-Arrones et al., 2015). Most studies have described differences in the activity profile according to the player’s position and its relationship with match performance (Di Salvo et al., 2007; Goncalves et al., 2014; Suarez-Arrones et al., 2015; Torreno et al., 2016; Krosta et al., 2020). As a result of these studies, it is known that central defenders (CD) cover less total distance during the game and less distance at a high-intensity sprint, while both central and wide-midfielders (MF and WM, respectively) run greater total distances. WM is the position that covers more distance during high- and very high-intensity running and, together with S, the one who covers more distance when sprinting (Bradley et al., 2010; Di Salvo et al., 2007; Suarez-Arrones et al., 2015; Torreno et al., 2016).
In addition to the player’s position, other contextual factors must be considered to understand running performance of soccer players (Carling, 2013). The playing formation and competitive level are two aspects that, despite their significance, have received less attention in the literature (Memmert et al., 2019). Research on position-specific running demands remains scarce and inconclusive. While Bradley et al. (2011) showed that running demands were not influenced by the playing formation, Tierney et al. (2016) reached the opposite conclusion. Likewise, there is not a consensus about the running demands of the teams according to their competitive level (Di Salvo et al., 2009; Rampinini et al., 2009). Currently, there are no studies analyzing the team and individual running demands depending on tactical behavior between the teams of the same level. Therefore, the aims of this study were to 1) examine the influence of tactical behaviour on running demands of the three best teams of a highly competitive national soccer league, and 2) to determine differences in running demands of each individual position depending on team characteristics.
Methods
Participants and game data
Match physical performance data were collected from 54 soccer players, from the top three teams of the Spanish La Liga during the 2013–2014 season. All matches of these teams were recorded obtaining 108 games and a total of 816 individual situations of outfield players (goalkeepers excluded) were included in the analysis distributed in 277 individual situations of Team 1, 273 of Team 2 and 266 of Team 3. The inclusion criteria were as follows: (1) matches completed within 90-min, and (2) matches in which players maintained their customary position and the team’s playing formation remained unchanged throughout the game (Carling et al., 2016). Players were categorised into five individual playing positions including fullbacks (FB) (n=12), central-defenders (CD) (n=12), central-midfielders (MF) (n=9), wide-midfielders (WM) (n=14), and strikers (S) (n=7). A group of UEFA-qualified coaches verified each team’s technical–tactical profile and playing formation throughout each game through video analysis (Memmert et al., 2017): Team 1 employed a compact structure distributed in a 1-4-4-2 playing formation. In defensive phases, most of the players were concentrated behind the ball, and direct attacks were the most frequent offensive style. Team 2 employed a standard playing formation of 1-4-3-3. Their style of play was predominantly indirect, using short passes and accumulating several players around the ball in the opposition’s field. Rapid pressure in the area of the possession loss was their defensive style. Team 3 used a 1-4-3-3 playing formation, with an offensive playing style characterised by elaborate attacks and strong counter-attacks. In defence, they prioritised high pressure on the ball on the opponent’s pitch. The study protocol followed the guidelines stated in the Declaration of Helsinki and was approved by the Ethics Committee of the local University.
Data collection and analysis
A multiple-camera, semi-automatic, computerised player-tracking system (MediaPro, Barcelona, Spain) was used to record and evaluate match-running performance (Pons et al., 2019; Rivilla-García et al., 2019). As in previous studies, locomotor performance was examined by distinguishing a set of running activity categories: total distance covered (TD), distance covered above 14km·h-1 (DC>14km·h-1), distance covered above 21km·h-1 (DC>21km·h-1), distance covered above 24km·h-1 (DC>24km·h-1), distance covered in possession of the ball (DC in possession) and distance covered without possession of the ball (DC out possession) (Asian Clemente et al., 2019; Bradley et al., 2011).
Statistical Analysis
Data are presented as mean ± standard deviation (SD). All variables presented normal distribution (Shapiro-Wilk test). A one-way analysis of variance (ANOVA) was used to determine differences between teams and playing positions. In the event of a significant difference, Bonferroni’s post-hoc tests were used to identify any localized effects. The standardized difference or effect size (ES, 90% confidence limit [90%CL]) in the selected variables was calculated. Threshold values for assessing the magnitude of the ES (changes as a fraction or multiple of baseline standard deviation) were <0.20, 0.20, 0.60, 1.2 and 2.0 for trivial, small, moderate, large and very large ES, respectively (Hopkins et al., 2009).
Results
Table 1 and Figure 1 show running activity of each team throughout the season. Team 2 covered a substantially lower distance >14km·h–1 than Team 1 and substantially lower distances >14, >21, and >25km·h–1 than Team 3. No differences in running activity were found between Teams 1 and 3.
Figure 1
Running activity comparison between the three teams. TD=total distance covered; DC=Distance covered; **=p< 0.01; Bars indicate uncertainty in the true mean changes with 90% confidence intervals. The trivial area was calculated from the smallest worthwhile change (SWC).
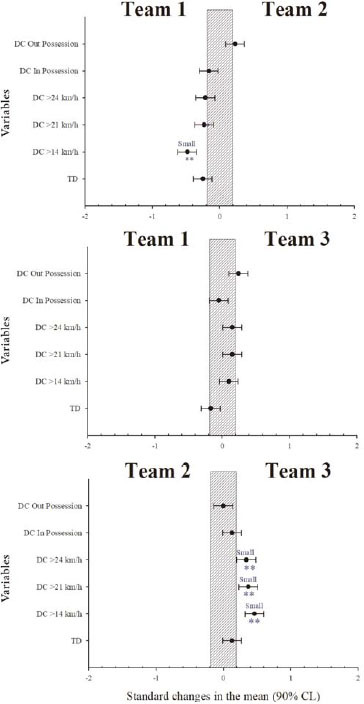
Table 1
Running activity characteristics adjusted by the position and team.
Table 2 and Figures 2–4 show match running activity by the position of the three teams during the season. There were substantial differences between the specific positions of the three teams. CD in Team 1 covered the lowest distance by a substantial margin in almost all variables analysed, whereas MF travelled substantially greater distances than did other positions. WM in Team 1 travelled the greatest DC >18 and >21km·h–1, S in Team 2 had the lowest DC in almost all the variables, and FB in Team 3 showed the lowest total DC and DC >14km·h–1. WM in Team 2 had the greatest DC in possession, while S in Team 3 had the greatest DC out of possession.
Figure 2
Running activity comparison between Teams 1 and 2 according to each position. TD=total distance covered; DC=Distance covered; *=p <0.05; **=p<0.01; Bars indicate uncertainty in the true mean changes with 90% confidence intervals. The trivial area was calculated from the smallest worthwhile change (SWC).
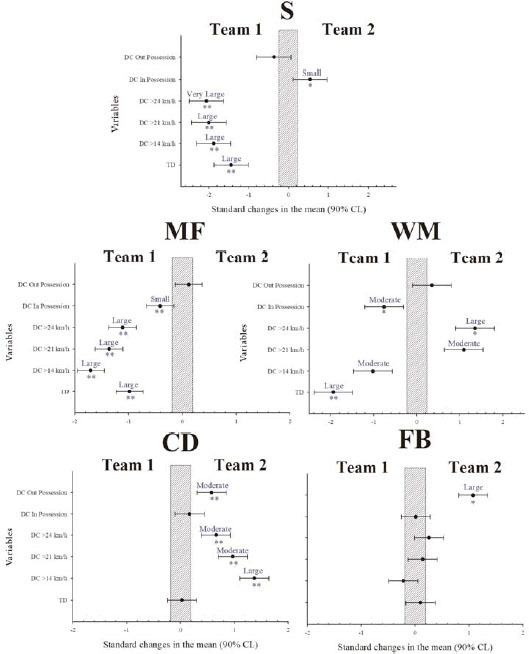
Figure 3
Running activity comparison between Teams 1 and 3 according to each position. TD=total distance covered; DC=Distance covered; *=p<0.05; **=p<0.01; Bars indicate uncertainty in the true mean changes with 90% confidence intervals. The trivial area was calculated from the smallest worthwhile change (SWC).
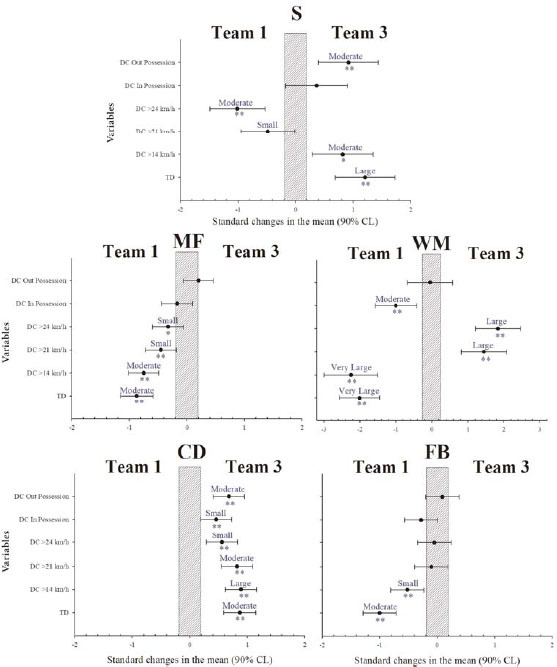
Figure 4
Running activity comparison between Teams 2 and 3 according to each position. TD=total distance covered; DC=Distance covered; *=p<0.05; **=p<0.01; Bars indicate uncertainty in the true mean changes with 90% confidence intervals. The trivial area was calculated from the smallest worthwhile change (SWC).
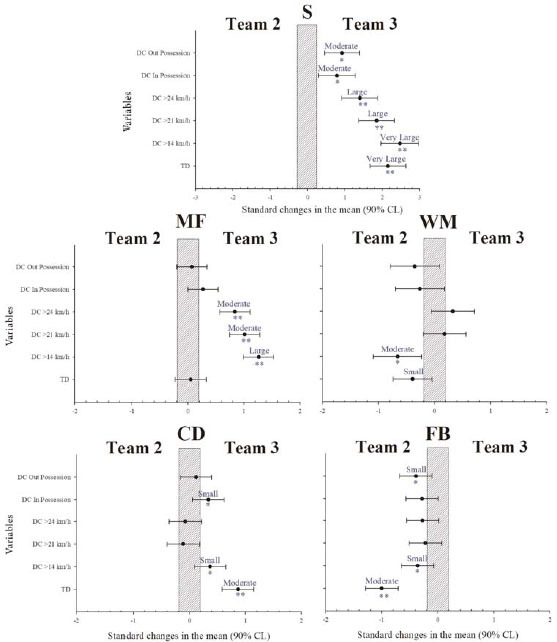
Table 2
Running activity characteristics adjusted by the position and team.
Discussion
The purposes of this study were 1) to analyse the influence of tactical behaviour (i.e., playing formation, playing style, and tactics) on physical performance of competition-level-matched top teams in Europe, and 2) to describe the differences in the locomotor demands of individual positions depending on the team’s characteristics. The results indicated that different team formations and associated tactical demands had significant influence on running performance of elite soccer players.
Outcomes indicated that the running activity of more successful teams in La Liga did not affect their final classification because Team 1 (champion) showed no difference with the third-ranked team (Team 3), and showed differences in only one (distance: >14km·h−1) of six analysed variables with Team 2. These observations corroborate those of previous studies on top national leagues (Bradley et al., 2011; Carling, 2013; Di Salvo et al., 2009; Rampinini et al., 2009) which supported the notion that physical performance is not directly related to the teams’ final ranking. On the other hand, our results align with those of (Bradley et al., 2011) and (Tierney et al., 2016) who revealed that total high-intensity and very-high-intensity running distances did not differ between 1-4-4-2 and 1-4-3-3 configurations.
Results showed differences between Teams 2 and 3 in running performance over DC >14, >18, and >24km·h–1, and between Teams 1 and 2 in DC at >14 km·h1. These differences could be due to the fact that Team 3 typically demonstrated greater counter-attacks covering greater distances at higher speeds. In contrast, Team 2 employed more elaborate attacks using shorter movements and a higher number of passes between teammates. This offensive style could explain the differences seen in DC relative to Team 1, who presented a greater defensive style and expended more time defending and initiating more direct attacks.
The playing position is well known to impact the demands of players during matches (Di Salvo et al., 2009; Suarez-Arrones et al., 2015; Torreno et al., 2016) and our results show that the tactical profile of teams affected individual positions differently. In Teams 2 and 3 CD had higher demands than in Team 1, which could be related to the offensive attitude of these teams who defended farther to their goalkeepers what provoked that their CD accumulated more running activity. For their part, FB in Teams 1 and 2 achieved more TD and DC >14km·h-1 than in Team 3. Team 3 played with WM opened in the wings what could have limited the demands of their FB.
Defensive mentality could explain the greater running demands of MF in Team 1 with respect to Teams 2 and 3 accumulating more TD, DC>14, 21 and 24km·h-1. This defensive attitude was also shown in their WM who occupied central positions in Team 1 while in the other teams WM played more opened. This behaviour could have provoked higher speed running in Teams 2 and 3 (>21 and 24km·h-1) and in Team 1 more TD and distance covered at lower intensity (>14km·h-1).
The playing position is well known to impact the demands of players during matches (Di Salvo et al., 2009; Suarez-Arrones et al., 2015; Torreno et al., 2016) and our results show that the tactical profile of teams affected individual positions differently. In Teams 2 and 3 CD had higher demands than in Team 1, which could be related to the offensive attitude of these teams who defended farther to their goalkeepers what provoked that their CD accumulated more running activity. For their part, FB in Teams 1 and 2 achieved more TD and DC>14km·h-1 than in Team 3. Team 3 played with WM opened in the wings what could have limited the demands of their FB.
Defensive mentality could explain the greater running demands of MF in Team 1 with respect to Teams 2 and 3 accumulating more TD, DC>14, 21 and 24km·h-1. This defensive attitude was also shown in their WM who occupied central positions in Team 1 while in the other teams WM played more opened. This behaviour could have provoked higher speed running in Teams 2 and 3 (>21 and 24km·h-1) and in Team 1 more TD and distance covered at lower intensity (>14 km·h-1).
The offensive and defensive team’s tactics could also have affected running demands of S. S of Teams 1 and 3 achieved greater TD, DC>14, 21 and >24km·h–1 than S of Team 2. In these teams, they employed fast counter-attacks with the intention of attacking the space behind the defensive line of the opponents by mobilizing to the free space. Conversely, S of Team 2 were situated closer to the opponent’s goal during attack and thus performing shorter movements, which may have allowed them to cover smaller distances. DC>24km·h–1 differences between S of Teams 1 and 3 could be because S of Team 1 sometimes began a counterattack farther from the opponent’s goal, placing more responsibility on defensive work.
Despite the results of this study, certain limitations should be considered. We only compared three teams from the Spanish first division; it would be interesting to reproduce this analysis with other top European league teams. Likewise, although an analysis of running performance of teams has been shown, more physical and physiological information, including other locomotor variables (e.g., accelerations and decelerations) or internal load variables (e.g., rating of perceived exertion, heart rate) could be more informative.
Conclusions
The results of the present study showed that the movement patterns of teams and each position were influenced by tactical behaviour chosen by coaches. Technical staff should better understand what are the running demands of their players during competition according to their tactical instructions because in teams of the same competitive level behaviour during matches would be different. With this in mind, coaches should design specific training programs using drills which simulate the specific requirements of the game considering tactical behaviour in order to best prepare soccer players.