Introduction
Flatwater kayaking is an Olympic discipline where athletes are paddling with maximal effort to complete a given distance in the shortest possible time. The ability to efficiently perform the complex paddling movement depends on a number of various kayakers’ physiological and biomechanical factors (Van Someren and Howatson, 2008). It is important to note that upper body muscle mechanical capacities (force, velocity and power) have a great impact on the final results of the competition, especially during shorter distances (i.e., 200 m canoe sprint discipline) (McKean and Burkett, 2014). Different testing protocols are conducted to identify athletes' strengths and weaknesses with respect to the specific demands of a kayak sport discipline and, consequently, to prescribe training according to the individual needs (McGuigan et al., 2013). However, many physical tests do not provide valuable information to guide athletes' training programs (McKean and Burkett, 2010). Therefore, sport scientists are in a continuous quest for tests which could provide meaningful information for enhancing athletes' sport performance.
Besides regular on-water specific drills, developing and achieving optimal kayak performance inevitably include dry-land resistance training of upper body muscles (McKean and Burkett, 2014). One of the reasons for including dry-land exercises is the inability of kayakers to perform their outdoor on-water training sessions during undesirable weather conditions (i.e., low temperatures, rain, etc.). To determine strength of kayakers, basic tests such as the overhead medicine ball throw (López-Plaza et al., 2018), one-repetition maximum (1RM) tests of compound movements including bench press and prone bench pull exercises (McGuigan et al., 2013; McKean and Burkett, 2010, 2014; Ualí et al., 2012), isokinetic tests of elbow flexors (Clarkson et al., 1982), shoulder extension (Tesch, 1983), isometric tests including the hand grip (Hamano et al., 2015), and the bilateral prone bench pull and one arm cable row (Ualí et al., 2012) are used. Several attempts to develop more specific tests consisted of using simulation of the kayak stroke (i.e., to exert a pulling force in the horizontal direction involving trunk rotation, shoulder extension, and elbow flexion in one motion) with an isokinetic device (Van Someren and Howatson, 2008) and tasks under isometric conditions (Steeves et al., 2018). To date, the most specific dry-land test consists of recording maximal power during cycling movements performed on a modified kayak ergometer (kayak Wingate test) (Van Someren and Howatson, 2008). One problem is that the mentioned basic exercises bear little resemblance to the kayak stroke, while the Wingate test reveals peak power, but not the maximal force and velocity capacities. Therefore, it could be important to develop a specific test to evaluate the maximal mechanical capacities of the muscles involved in single kayak strokes.
A testing procedure which has gained popularity over the last years consists of the evaluation of the force-velocity (F-V) relationship. There is compelling evidence that the F-V relationship of multi-joint exercises follows a linear shape (Jaric, 2015). Tests described above (i.e., bench press, bench pull, isokinetic tests, etc.) are limited since they are performed under a single pre-defined movement condition, resulting in a single outcome (e.g., power output, paddling frequency, or exerted force). Consequently, distinguishing among different muscle capacities (Jaric, 2015, 2016) could not be done using the above-mentioned tests. A potential solution could be based on the approximately linear and exceptionally strong F-V relationship typically observed in various functional tasks, such as vertical jumps, the bench press, the bench pull, etc. (García-Ramos et al., 2017; Giroux et al., 2017; Zivkovic et al., 2017). Therefore, a linear regression model [F(V) =F0 – aV] can be used to distinguish between force (F0), velocity (V0) and maximal power (Pmax) producing capacities of the tested muscle groups (Jaric, 2015). In addition to these variables, the F-V slope (i.e., the ratio between F0 and V0) also provides meaningful information to design individualized training programs (Morin and Samozino, 2016). It has been shown that the F-V relationship recorded for the bench press exercise (García-Ramos et al., 2016; Sreckovic et al., 2015), vertical jumps (García-Ramos et al., 2017), as well as the cycling and arm cranking ergometer (Driss and Vandewalle, 1998) enables reliable and valid assessment of mechanical capacities of muscles acting during multi-joint tasks. However, no protocol has been developed to assess the F-V relationship of muscles involved in tasks simulating the kayak stroke.
To address the problems discussed above, we conducted a study to explore the feasibility of a novel test for assessing the muscle mechanical capacities involved in the kayak stroke. Specifically, the aims of this study were to evaluate the shape (i.e., linear or polynomial) and strength (i.e., magnitude of the r coefficient) of the F-V relationship as well as to examine the reliability and external validity of the F-V relationship parameters obtained during the single kayak stroke test (SKST). We hypothesized that (1) the F-V relationship would be highly linear, (2) the F-V relationship parameters would present acceptable reliability, and (3) the F-V relationship parameters obtained during the SKST would present high external validity with respect to the same variables obtained during traditional tests (short Wingate kayak test, bench press and prone bench pull).
Methods
Participants
Fourteen kayakers volunteered to participate in this study [six women (age: 20.3 ± 3.7 years; body height: 1.67 ± 0.05 m; body mass: 65.6 ± 3.5 kg) and eight men (age: 20.8 ± 2.4 years; body height: 1.84 ± 0.05 m; body mass: 81.9 ± 3.5 kg); mean ± standard deviation (SD)]. All of them were high level athletes with more than five years of competitive experience at a national/international senior level. Kayakers performed an average of 8.8 ± 2.5 training sessions per week. None of the participants had recent injuries and all of them attended testing sessions at rest and without musculoskeletal pain which could negatively affect the study results. Prior to testing, all participants were informed about research aims and procedures and they gave their written consent to participate in the study. The parents or legal guardians provided written consent for under-aged kayakers. The study protocol adhered to the tenets of the Declaration of Helsinki and was approved by the Institutional Review Board.
Experimental Design
Participants were tested on two sessions separated by 72-96 h. Both testing sessions were preceded by a general warm-up consisting of 5 min of paddling on a kayak ergometer at a low intensity and a standardised dynamic stretching protocol of 5 min which was always guided by the same investigator. The F-V relationship during the novel SKST was evaluated during both testing sessions. The short kayak Wingate test, bench press, and prone bench pull were evaluated only during one testing session. Even though the order of the exercises was randomised, the bench press and prone bench pull were tested on different sessions because they were expected to induce higher fatigue than the short Wingate kayak test due to overall higher loading conditions. Both testing sessions were conducted simultaneously and participants were instructed to avoid any strenuous exercise the day before testing.
Since multiple tests were performed during the same testing session, a possible fatigue effect was tested through the unloaded countermovement jump height and the maximum velocity reached during the bench press throw performed on a Smith machine against an external load of 20 kg (García-Ramos et al., 2018). Countermovement jump height was evaluated with a mobile application (MyJump2), and the bench press throw with a linear position transducer (Hontko HPS-M1, New Taipei City 23545, Taiwan). Three trials of each exercise were performed before and after the testing session and the average value was used for further comparisons. On average, trivial decreases of 1% in the unloaded countermovement jump height and 1.5% in the bench press throw velocity were observed after the testing procedure, indicating that the testing procedure did not induce meaningful fatigue in our participants.
Testing Procedures
Single kayak stroke test
The novel kayak test was performed on a custom-made device consisting of a lat machine, a roller device, a railing system and a stick which simulated the paddle (Figure 1). The roller device was attached to the lat machine via non-elastic cable. Two types of cables were used, a short one which was used for transmitting the heavy loads, and a six times longer cable which was used to apply the light loads. The roller device was positioned above the railing system which allowed its sliding after the muscle forces overcame the sum of the weight and friction force. Dimensions of the roller device were 120 x 25 x 25 cm, while the railing system was 11 m long and 20 cm wide. The kayak seat was fixed to the roller device with an adjustable part which served to fix the feet after the knee angle reached between 120 and 130⍛, as in the real boat. During testing, participants were instructed to apply force using the stick as they would do in a real kayak competition. The stick was attached to the rails with a 50 cm long rope. Hand positioning was the same for all participants: pulling and pushing hands were at 22 and 90 cm from the same end of the stick, respectively. For the left kayak stroke participants sat on the roller device with their right leg and left arm fully extended, maximal trunk rotation in a clockwise direction, and the right wrist 20-30 cm in front of the nose (and vice versa for the right stroke). None of the participants reported discomfort at the starting position. Thereafter, participants performed a ballistic kayak stroke (as fast as possible) always using the same technique to avoid its potential influence on the magnitude of the F-V relationship parameters, and therefore, the validity analysis. The signal for start was “Ready, Go!”.
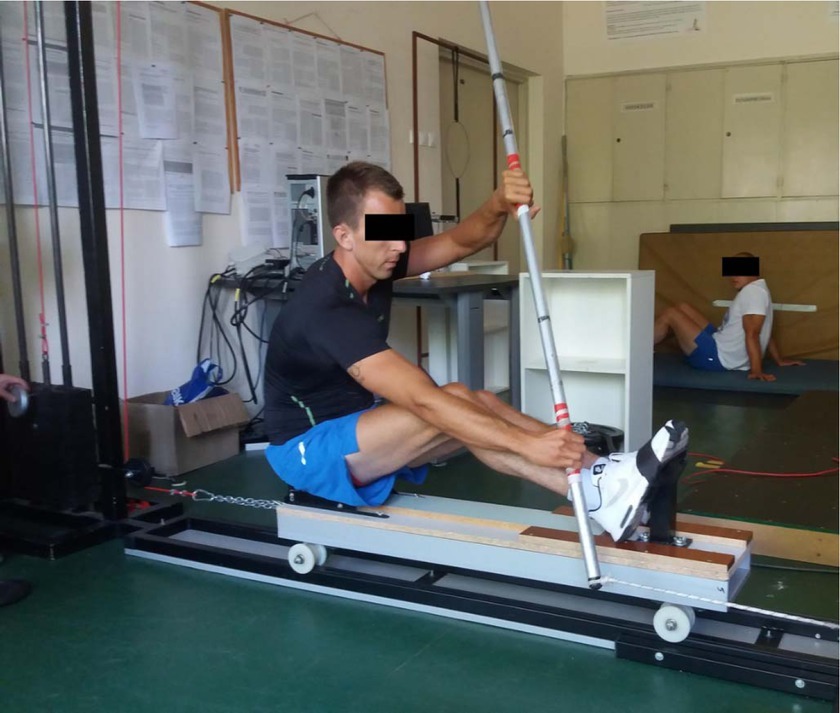
Average values of force and velocity were calculated using data obtained from a linear position transducer (Real Power Pro Globus, Codogne, Italy) positioned to trace the vertical weight displacement with a sampling frequency of 1000 Hz. Prior to testing, the linear position transducer was used to determine the pull-off distance (displacement of the weight from the beginning of the movement until the pulling hand was in line with the trochanter major). Note that the selected stroke endpoint coincided with the point where no active forces could be applied on the paddle during kayaking. The velocity value recorded by the linear position transducer was multiplied by a coefficient of transmission (i.e., 5.935) when the long cable was used. The coefficient of friction force (i.e., μ = 0.086) was measured prior to testing and it was later used to correct the force computations.
Participants performed the single kayak stroke against five different loads. The minimum load (L1) was 1 kg for all participants and the maximum load (L5) was the individual 1RM. The three intermediate loads represented the 20%1RM (L2), 50%1RM (L3), and 80%1RM (L4). Participants performed two repetitions with each load separated by 1 min for light loads (L1-L2) and 3 min for heavy loads (L3-L5). The trials on the left and right side were performed in alternate order and, thus, the rest period between trials with the same side was 2 min for light loads, and 6 min for heavy loads. Therefore, the testing protocol consisted of 20 repetitions (two strokes × five loads × two repetitions). The 1RM load was the maximum weight a participant could lift with a proper technique, while the velocities achieved against the lowest load were close to the velocity intercept. Prior to testing, 1RM was determined using an incremental loading test protocol (three-four trials were needed to reach the 1RM).
Short Wingate kayak test
A modified Wingate test was performed on a kayak ergometer (Dansprint ApS, Strandmarksvej 27 C, DK-2650 Hvidovre). Distance between the seat and the footrest was individually adjusted. The test lasted 10 s since in our pilot testing several kayakers reached maximum power within 7-8 s. Participants were instructed to perform an “all-out” effort from the beginning of the test. They began the exercise with a stroke on their preferred side. Two trials were performed, separated by 3 min, and the trial with the maximum power was used for further statistical analyses.
Bench press and prone bench pull exercises
The incremental loading tests during the bench press and prone bench pull exercises were performed following standard procedures on a Smith machine (Loturco et al., 2018). Five loads were applied during each test: the first load corresponded to the unloaded barbell of the Smith machine (20 kg; L1), second one to 35% of 1RM (L2), third one to 50% of 1RM (L3), fourth one to 65% of 1RM (L4) and fifth one to 80% of 1RM (L5). Participants performed two repetitions against each load. The rest interval was 1 min for the light loads (L1-L2) and 5 min for the heavy loads (L3-L5). A linear position transducer (Hontko HPS-M1, New Taipei City 23545, Taiwan) was attached perpendicularly to the barbell and recorded the displacement-time data at a frequency of 1000 Hz. The mean velocity was calculated from the beginning of the concentric phase until the barbell reached the maximum height.
Force-velocity relationship modelling
The F-V relationship was determined for the SKST as well as for the bench press and prone bench pull exercises. The F-V relationships were determined by fitting both linear and 2nd order polynomial models to the mean force and velocity data. The corresponding 95% confidence intervals (95% CI) were also calculated to compare the strength of the F-V relationships obtained from the linear and polynomial regression models applied to the averaged across the participants’ data. Since corresponding 95% confidence intervals overlapped between these two models, further assessment of the mechanical capacities of tested muscle was done using a linear regression model: [F(V) = F0 – aV], where F0 represented the force-intercept and a was the slope of the F-V relationship (F-V slope). The velocity intercept (V0 = F0/a) and Pmax (Pmax = F0∙V0/4) were also calculated (Jaric, 2015). The trial with the highest mean velocity at each load was used for F-V modelling. Prior to F-V modelling, force values were normalised to body mass applying the allometric scaling procedure (Jaric, 2002).
Statistical Analysis
Descriptive data are presented as mean and SD since they were normally distributed (Shapiro-Wilk test: p > 0.05), while the Pearson's correlation coefficients (r) are presented through their median value and interquartile range. The reliability of the F-V relationship parameters (F0, V0, F-V slope, and Pmax) was assessed through paired sampled t tests, the standard error of measurement (SEM), the coefficient of variation (CV), the intraclass correlation coefficient (ICC, model 3.1), and the corresponding 90% coefficient intervals. Acceptable reliability was defined as a CV < 10% (Hopkins, 2000). The r coefficient was used to explore the external validity of the F-V relationship parameters obtained during the SKST with respect to the same variables obtained during the short kayak Wingate test, bench press and prone bench pull. Qualitative interpretations of the r coefficients as defined by Hopkins et al. (2009) (0.00–0.09 trivial; 0.10–0.29 small; 0.30–0.49 moderate; 0.50–0.69 large; 0.70–0.89 very large; 0.90–0.99 nearly perfect; 1.00 perfect) are provided for all significant correlations. Reliability analyses were performed using a custom Excel spreadsheet (Hopkins, 2000), while other statistical analyses were performed using the software package SPSS (IBM SPSS version 20.0, Chicago, IL, USA). Statistical significance was set at an alpha level of 0.05.
Results
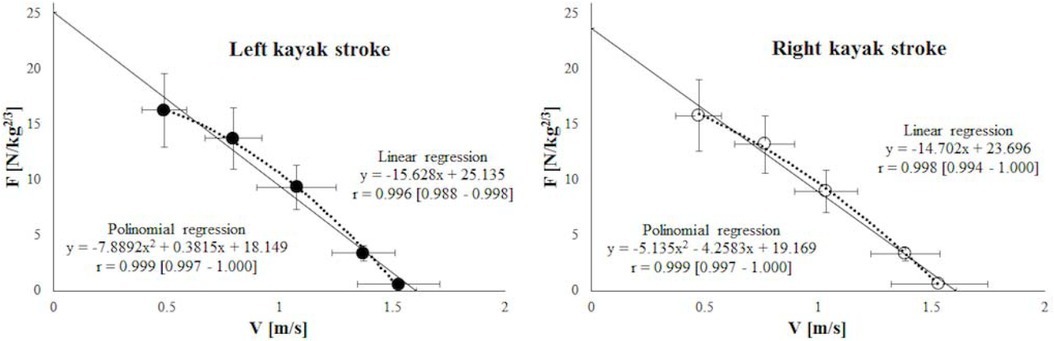
Linear and 2nd order polynomial F-V relationship models obtained from the single kayak stroke test are depicted in Figure 2. Note that all regression models revealed exceptionally high correlation coefficients (r > 0.990) and that none of the coefficients of the linear regression models were below the 95% CI of the correlation coefficients obtained from the corresponding polynomial regression models.
Figure 2
Linear and polynomial force-velocity relationships obtained from the averaged across the participants’ force and velocity data during the single kayak stroke test. The regression equations are shown with the corresponding Pearson's correlation coefficients (r) and 95% confidence intervals.
The within-session and between-session reliability of the F-V relationship parameters was high with the only exception of the between-session reliability observed for the F-V slope (CV = 12.24-13.12%; ICC = 0.28-0.40). In addition, results of the depended t test showed that there were no between- nor within-session differences (all p ≥ 0.10) (Table 1).
Table 1
Reliability of the force-velocity relationship variables obtained during the single kayak stroke test
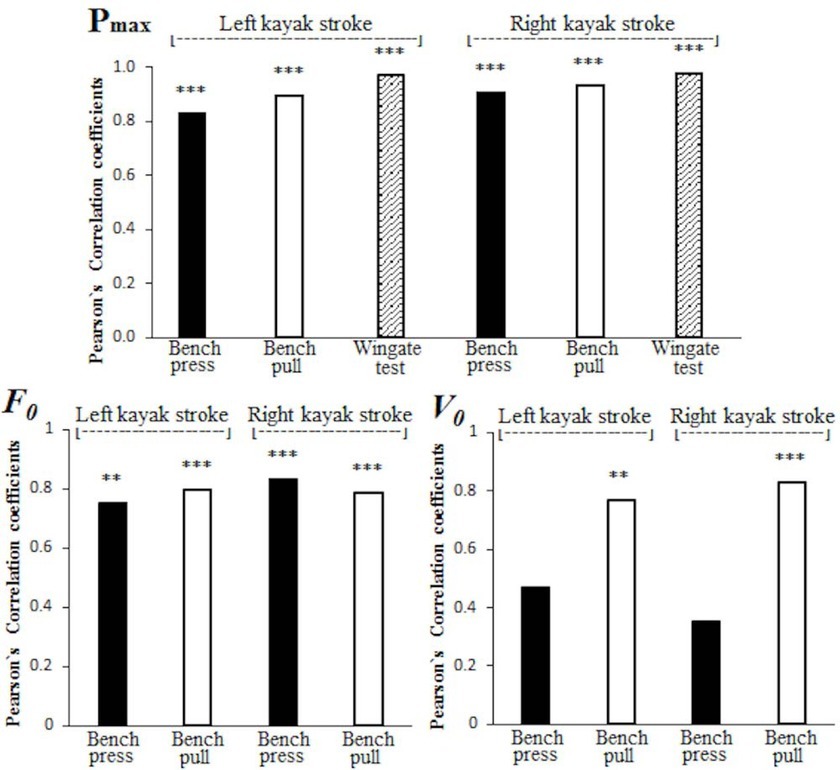
The F-V relationship parameters were generally highly correlated with the same variables obtained from traditional tests. Nearly perfect correlations were observed between the maximal power reached during the bench press, prone bench pull, modified Wingate test and Pmax assessed from the F-V relationships during the single kayak strokes (r range = 0.825-0.975). Correlations between F0 variables were very large (r range = 0.751-0.831), as well as V0 for the prone bench pull (r = 0.770-0.829). Non-significant correlations were observed for the V0 obtained during the bench press exercise (r = 0.355-0.471) (Figure 3).
Figure 3
Association between the force-velocity relationship variables obtained during the single kayak stroke test and the same variables obtained during traditional exercises used for testing of kayakers. Pmax, maximal power; F0, maximal force; V0, maximal velocity; PP, peak power. Significant correlations are presented as: * p<0.05; ** p<0.01; *** p<0.001.
Discussion
This study aimed to explore the feasibility of a novel test for evaluating the F-V relationship of muscles involved in the single kayak stroke. The results with respect to the SKST revealed (1) high linearity of the F-V relationship, (2) acceptable reliability of the obtained F-V relationship parameters, and (3) generally high external validity of the F-V relationship parameters with respect to the same variables obtained from traditional tests (short Wingate kayak test, bench press and prone bench pull). These findings suggest that the SKST can be utilised to evaluate the muscle mechanical capacities of upper body muscles in kayakers.
To our knowledge, this is the first study which has explored the F-V profile in competitive kayakers not only during the SKST, but also during the bench press and prone bench pull exercises. The high linearity of the F-V relationship observed in the present study during the SKST is in line with our first hypothesis and it brings additional support with respect to the high linearity of the F-V relationship obtained during multi-joint exercises (Giroux et al., 2017; Jaric, 2016; Sreckovic et al., 2015; Zivkovic et al., 2017). An important point to consider is that we used a very wide range of loads (from 1 kg until the 1RM load) covering almost the entire spectrum of the F-V relationship (Figure 2). It should be noted that the F-V relationship of the single kayak stroke remains linear even when the experimental points are located very close to the force and velocity intercepts. Similar results were obtained by Riviere et al. (2017) and Cuevas-Aburto et al. (2018) during the squat and bench press exercises, respectively. Therefore, within the range of loads which can be tested during multi-joint exercises (e.g., a squat, a bench press, or a SKST), it seems that the F-V relationship follows a linear relationship.
Our second hypothesis was also confirmed since the F-V relationship parameters obtained during the kayak strokes generally revealed high reliability. Particularly, the within session reliability of all F-V relationships was high. Absolute between session reliability ranged from low (for the F-V slope) to high (for F0 and Pmax). Acceptable reliability of the F-V relationship parameters has also been reported for other multi-joint exercises such as vertical jumps (Cuk et al., 2014; García-Ramos et al., 2017), bench press (García-Ramos et al., 2016; Sreckovic et al., 2015) and the leg cycle ergometer exercise (García-Ramos et al., 2018). It is known that for obtaining the F-V relationship parameters with high reliability, the experimental points should be as close as possible to the axis intercepts (García-Ramos and Jaric, 2018). The addition of one experimental point very close to the velocity-intercept during the SKST could be responsible for the higher reliability of V0 variable observed in the present study compared to the reliability of the same variable in exercises such as the vertical jump and the bench press (Cuevas-Aburto et al., 2018; García-Ramos et al., 2016). Regarding the somewhat lower between-session reliability for the F-V slope and V0, there are still no data to elucidate whether the observed phenomenon originates from the tested task, from the participants’ skill, or from other factors. Nevertheless, the discussed findings generally suggest that obtained variables could be reliable indices of mechanical capacities of the muscles engaged in a single kayak stroke (Van Someren and Howatson, 2008).
Confirming our last hypothesis, the results of the external validity showed high agreement of F0 with corresponding variables obtained from traditional exercises commonly used for testing kayakers (bench press and prone bench pull) and Pmax with the maximal power reached during the modified Wingate test on a kayak ergometer (García-Pallarés et al., 2010; Papandreou et al., 2018; Van Someren and Howatson, 2008). Finally, while the external validity of V0 obtained during the SKST was high with respect to V0 obtained during the prone bench pull, the agreement of V0 with the same variable from the bench press ranged from low to moderate. Since this is the first study evaluating the F-V relationship obtained from single kayak strokes, there are no data regarding agreement of F0, V0 and Pmax with directly measured force, power and velocity obtained from other upper body performance tests. The lower correlations observed for V0 in the bench press (pushing exercise) compared to the bench pull (pulling exercise) could be explained by different movement patterns with respect to the SKST (pulling exercise) and also by the lower reliability of V0 obtained during the bench press exercise when light loads were not used for F-V modelling (Cuevas-Aburto et al., 2018). The high external validity of the F-V relationship parameters suggests that the SKST could be used for routine dry-land testing of kayakers as an alternative to presumably less specific tests, such as the bench pull and bench press exercise.
As a limitation of this study, it is possible that the reliability of the SKST would be reduced with less experienced kayakers and, therefore, the use of this test might be limited to kayakers with a high level of expertise. Although a custom-made machine was built for the present study, coaches interested in assessing the F-V relationship could use the commercially available “Catch Force” machine. However, the “Catch Force” machine has an inclination of 11⍛ with respect to the horizontal plane which can negatively impact the reliability of V0 due to the higher distance between the experimental points and the velocity-intercept (García-Ramos and Jaric, 2018). It should also be noted that the sample size was small (6 women and 8 men). This was due to the restrictive inclusion criteria regarding the level of kayakers and also to the difficulties of elite athletes to attend the laboratory on multiple occasions. Therefore, the sample size was very difficult to increase. Although multicenter reliability studies have been proposed to solve the limitation of the small sample size (García-Ramos and Janicijevic, 2020), this was not possible in the present study due to the custom-made device used to evaluate the novel single kayak stroke test. Finally, this study did not compare the results of the SKST with on-water kayak performance. Future studies should elucidate whether the SKST is able to discriminate between athletes of different competitive levels, disciplines (sprinters vs. endurance) and sexes.
In conclusion the single kayak stroke test is a feasible procedure for testing maximal upper-body mechanical capacities of kayakers. The feasibility of the single kayak stroke test is supported by the high linearity of the F-V relationship as well as by the acceptable reliability and high external validity of the F-V relationship parameters. Due to the higher face validity of the SKST, its implementation can be proposed for obtaining more meaningful information about the maximal mechanical capacities (i.e., F0, V0, F-V slope, and Pmax) of upper-body muscles in comparison to the modified kayak Wingate test (which only provides information on peak power) or traditional resistance training exercises such as the bench press and the bench pull. However, future studies should explore the association between the F-V parameters obtained during the SKST and on-water kayaking performance.