Introduction
Running economy (RE), together with maximal oxygen uptake (VO2max) and the fraction of oxygen uptake that can be utilized over a given period, delineates aerobic performance capacity (Bassett and Howley, 2000). RE is defined as the energy cost of running per unit of distance or time at a given steady state velocity (Saunders et al., 2004) and is an important variable of performance in endurance runners with equally high levels of VO2max (Abad et al., 2016; Morgan et al., 1989). Typically, lower RE indicates a lower energy cost of running which is associated with a lower vertical displacement of the body’s centre of mass (Moore, 2016). One external factor that influences RE is the surface. It appears that running on softer surfaces is more oxygen demanding than running on harder surfaces. It has been observed that oxygen demand is increased by 26% in forest compared to road (Creagh and Reilly, 1997) and by 15 – 40% on sand compared to treadmill running (Zamparo et al., 1992). A study examining the difference in RE between orienteers and track runners showed that both groups displayed the same RE on track, but orienteers showed smaller impairment in RE after transitioning to the terrain (Jensen et al., 1999). This finding could potentially be explained by natural adaptation to be more efficient on their
everyday running surface. A lot of effort has been put into research regarding the exercise intensity and duration that yields the greatest improvements in VO2max (Bacon et al., 2013; Helgerud et al., 2007). RE, however, does not respond in a similar predictable manner as VO2max does to training interventions as RE might be similar (Lake and Cavanagh, 1996; Stöggl and Sperlich, 2014) or improved (Skovgaard et al., 2018) after a period of aerobic training. However, strength-training interventions seem to improve RE more robustly. Plyometric jump training (PJT) is one such strength training method shown to improve RE, with small increases in economy observed in a variety of sports (Balsalobre-Fernandez et al., 2016; Paavolainen et al., 1999; Turner et al., 2003).
Short term PJT (2-3 times per wk for 6-15 wks) can improve power, strength and the stretch shortening cycle in the lower extremities (Markovic and Mikulic, 2010). The typical aim of PJT is to decrease the ground contact time (GCT) in running through improvement of the muscular stretch shortening cycle (SSC) in which elastic energy is transferred to energy for propulsion, thus requiring less muscular force (therefore less oxygen) to be used during reiterated muscle contractions. This improvement of the SSC is probably derived from increased stiffness in tendons resulting in a more efficient storage and subsequent release of elastic energy (Saunders et al., 2004). However, research is inconclusive regarding the mechanism as PJT can improve RE without any significant differences in counter movement jump (CMJ) height (Turner et al., 2003), a test that normally indicates an improvement in the SSC. Most PJT interventions have tested RE on a treadmill before and after the intervention and usually at moderate speeds. GCT is similar on a treadmill and during running on hard surfaces such as an athletic all-weather track or paved surfaces, whereas GCT is considerably longer on softer surfaces (McMahon and Greene, 1978). In several running events such as orienteering, cross-country-, trail-, and obstacle course running athletes run on surfaces of different characteristics and therefore with different GCT. To date, it is unknown whether improvements in RE after PJT are surface-specific, that is, if RE at soft or uneven surfaces can be expected to improve after PJT on hard surfaces.
Only a few studies have compared the effects of PJT conducted on different surfaces, but none of them had RE as an outcome. Interestingly, PJT conducted on grass seems to induce greater improvements in the counter-movement jump whilst PJT on sand had greater improvements in the squat jump (Impellizzeri et al., 2008), thereby indicating that softer surfaces (in this case sand), require more muscular force to be used. In another study, sprint training on sand led to significant improvements in sprint performance tested on both grass and sand. In contrast, sprint training on grass only improved sprint performance on grass (Binnie et al., 2014). Overall, different training surfaces may in the end lead to diverse training effects.
The primary objective of this study was to investigate the effects of short-term PJT on soft or hard surfaces on RE in orienteers, tested both in terrain and laboratory settings. It was hypothesized that PJT conducted on a softer, thus more orienteering specific surface, would lead to greater improvements in RE when running in terrain compared to on a hard surface. RE is in most cases considered independent of running speed (Helgerud et al., 2010; Menier and Pugh, 1968; Morgan et al., 1995), however, RE at low running speeds (< 10 km/h) is more seldom reported. GCT increases with decreasing running speeds and low GCT seems to be associated with good RE (Mooses et al., 2018; Santos-Concejero et al., 2013). Conversely, shortening of GCT mandates a higher rate of force development which explains most of the increased metabolic cost at increasing running speeds (Mooses et al., 2018). In summary, the relationship between running speed and RE is a complex interplay between different metabolic and biomechanical factors. A secondary objective was therefore to assess the effect of PJT on GCT during one-legged drop jumps onto a force plate. It was hypothesized that the effects of PJT on a hard surface would be more effective in shortening GCT than PJT performed on a soft surface.
Methods
Participants
Twenty-five participants were recruited and gave their written informed consent to participate in the study, after approaching orienteering high schools and sport clubs in the metropolitan area of Stockholm, Sweden. The study procedure was approved by the Regional Ethical Review Board in Stockholm according to the principles of the Declaration of Helsinki. All participants were active competitive orienteers with ≥ 3 training sessions per week, > 16 years of age and no current injuries or surgery during the past year. Of the initial 25 participants, 6 dropped out during the intervention due to causes unrelated to the study, thus 19 participants were included in the analysis (Table 1). Two data points were lost concerning the post-test VO2max data due to technical problems or not meeting the VO2max criterion of reaching a plateau.
Measurements
Participants performed the following tests in the same order as described below.
Field tests. Following 5 min of jogging participants were equipped with a chest-worn mobile gas analyser for breath-by-breath analysis (MetaMax 3B, Cortex, Leipzig, Germany), connected to a turbine flowmeter attached to a correctly fitted facemask covering the nose and the mouth (7450 model, Hans Rudolph Inc, Shawnee, USA). Prior to each test, the metabolic cart was calibrated to ambient air conditions and a reference gas (15% O2 and 6% CO2, Air Liquide, Paris, France), as well as a calibration for the turbine’s flow volume using a 3-litre syringe (M9474-C, Medikro OY, Kuopio, Finland) was performed. Participants wore a heart-rate chest belt and wrist-watch equipped with a GPS (Garmin Forerunner 620 and HRM-RunTM, Garmin Ltd, Lenexa, Kansas, USA). Field testing included outdoor running at self-selected moderate speed, the first trail loop consisted of a 1.35 km run on dirt road/asphalt and the second off-trail loop of a 1.2 km run in the forest for the assessment of outdoor RE and the running heart rate on two loops with substantial difference in surfaces, vegetation and obstacles. The two loops were run with one minute of rest in between when a 20μl capillary blood sample was taken from the fingertip for analysis of blood lactate concentration (Biosen C-line Clinic, EKF-diagnostics, Barleben, Germany). The same trail loop of 1.35 km was then run as a time-trial (i.e. at maximal sustained conditions).
Laboratory tests
Following the field tests, GCT and vertical ground reaction force development were assessed during one-leg drop jumps performed on hard and soft-landing surfaces to simulate the softer surface associated with trail running. The tests were performed in a biomechanical laboratory with a floor mounted force plate (type 9281EA Kistler and Kistler BioWare® Software type 2812A, version 5.1.3.0, Winterthur, Switzerland), set to a sampling rate of 1500 Hz. After two preparatory jumps, the participant performed 5 recorded jumps with one leg after a drop of 30 cm height either landing directly on the force plate or on an 8 cm foam rubber mattress firmly attached to the force plate. Prior to the 2 sets of jumps, participants were weighed on the force plate with and without the mattress. The jumps were performed with 15 s of rest between each individual jump and 3 minutes of rest between each set of 5 jumps. The instructions were to perform every jump with the intention to maximize the jump height with the least possible ground contact time, having the hands placed on the hips and to keep the landings constant with stretched legs. The average of the three tests per leg with the highest peak force was used for analysis and the average value of both legs is presented in the result section. The final test consisted of 5 min running stages at 7, 9 and 13 km/h on a motorized treadmill with measurements of oxygen uptake for evaluating RE at different running speeds followed by 3 min of rest and thereafter an incremental running protocol to exhaustion for determination of VO2max. The protocol started with a speed of 13 km/h, which was increased every minute until 16 km/h and thereafter the incline was increased by 1° every minute until voluntary exhaustion. Measures of oxygen uptake were taken breath-by-breath by Oxycon Pro (Erich Jaeger Gmbh, Hoechberg, Germany) connected to a turbine flowmeter attached to an oro-nasal facemask (7450 model, Hans Rudolph Inc, Shawnee, USA). Prior to each measurement, the metabolic cart was calibrated to ambient air conditions and a reference gas (15% O2 and 6% CO2, Air Liquide, Paris, France), calibration for the turbine’s flow volume was also performed. A capillary blood sample was collected after completion of each 5 minute running stage to make sure that the slow component of VO2 above the lactate threshold was not present, and following the maximal test to analyse blood lactate concentration (Biosen C-line Clinic, EKF-diagnostics, Barleben, Germany).
Procedures
Based on sex, age, VO2max and RE two training groups were stratified out of the 25 participants. Both groups performed a 4-week intervention consisting of 2 sessions per week of PJT. One group performed PJT on a standard wooden gym floor (Hard Training Group, HTG; n = 7) and the other group performed PJT on 6 cm thick gymnastics mattresses containing foam rubber (Soft Training Group, STG; n = 12). GCT during the one-legged drop jump was measured on the hard surface and it equalled 299 ± 40 ms and on the soft surface it was 365 ± 42 ms (p < 0.0001). Participants were instructed to maintain their regular training volume concerning running/orienteering with the addition of the 2 sessions of 30 min PJT per week following a low intensity run. RE, VO2max and jumping GCT were assessed at baseline and post intervention, 48 hours into recovery following the last training session.
Training Intervention
PJT was performed during a 4-week period with 2 sessions per week with at least 48 hours of rest in between the sessions. During the first and the third week of the intervention educated instructors supervised the sessions making sure that participants were fully able to perform the various jumping exercises without a flawed technique. The total number of jumps per leg per session gradually increased from 28 in the first two weeks to 50 during the last week of training. Training sessions consisted of 7 exercises that included jumps in the coronal, sagittal and transverse plane. The HTG performed all sessions on a regular gymnastics hall floor unlike the STG who performed PJT on 6 cm gymnastics mattresses to simulate a terrain surface. A mix of one legged and two legged exercises was used. Participants were instructed to perform PJT following a low intensity run, and a typical session lasted approximately 20-30 minutes. The exercises included in PJT were running drills with explosive one-leg knee-lifts every 3rd step, unilateral and bilateral drop jumps from a 35 cm height, ankle jumps, plyometric lunges, lateral jumps and standing triple jumps. The adherence rate to the training intervention among the participants was 100%.
Data Analysis and Statistics
For calculation of RE, the Weir equation was used and RE was expressed in kcal/kg/km. Data were exported from MetaSoft® Studio, Garmin Connect and JLab for statistical analysis in Prism 7 (GraphPad Software, Inc) and SPSS (IBM Corp. Released 2017. IBM SPSS Statistics for Windows, Version 25.0. Armonk, NY: IBM Corp). Normal distribution was checked with a D’Agostino & Pearson normality test. A factorial ANOVA was used for physiological and biomechanical data for time (pre and post), treadmill speed and type of training. If a global effect for ANOVA was observed a Bonferroni post hoc test was further used. All data were analysed for sphericity to avoid type 1 errors. A Greenhouse-Geisser correction was applied if ε < 0.75. Effect size for ANOVA was a partial eta square. The meaningfulness of the results was ranked as low (0.2 – 0.49), medium (0.5 – 0.79) and large (>0.8) (Thomas et al., 1991). Pearson’s correlations were calculated to establish the relationship between physiological and biomechanical variables. The alpha-level was set a priori at 0.05. All data are presented as mean ± standard error of the mean (S.E.M.) except for Table 1 (participants’ characteristics) where data are presented as mean ± standard deviation (SD).
Results
Plyometric jump training improved treadmill and off-trail running economy
First, we wanted to determine baseline RE at both low (7 and 9 km/h) and moderate (13 km/h) running speeds on a treadmill. RE was significantly better at moderate compared to low velocity (F2,36 = 53.9, p < 0.001, η2 = 0.750) (Figure 1a).
Figure 1
1a.) Effect of running velocity on running economy. A higher velocity leads to a reduction in oxygen cost. *** indicates a significant (p < 0.001) effect between all velocities. 1b) Change in RE in percentages compared to the pre-test. HTG (black bars) = the group that trained on a hard surface (n = 7), STG (white bars) = the group that trained on a soft surface (n = 12). The HTG was the only group that significantly improved RE when running off-trail *= p < 0.05. RE was improved significantly among all groups and velocities when tested on the treadmill ***p < 0.001. All data are mean +/- SEM
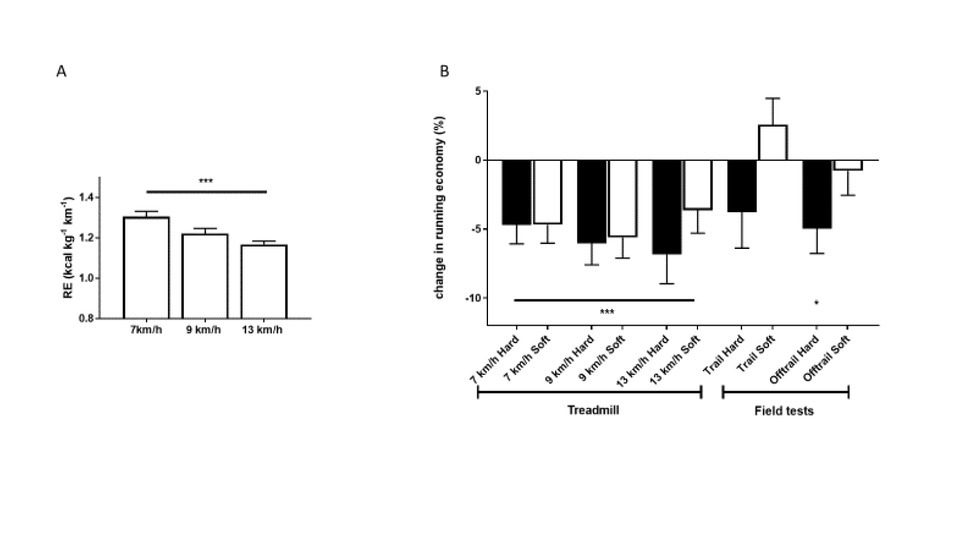
Irrespective of running velocity, PJT resulted in a significant improvement in running economy on the treadmill pre to post (p < 0.001, Figure 1b). RE improved for all treadmill speeds with 13 km/h being the most efficient (F2,34 = 49.7, p < 0.001, η2 = 0.745). Both groups showed the same improved RE as displayed by no interaction of treadmill speed and group (F1,15 = 0.23, p = 0.797, η2 = 0.013, Figure 1b). During the field tests, the HTG improved their running economy at the off-trail loop, but not at the trail loop, whereas the STG did not show any improvement in running economy at the two loops on or off the trail (Figure 1b). There was a trend towards better RE during the trail run for the HTG versus the SFG for pre and post PJT (F2,34 = 3.7, p = 0.07, η2 = 0.181). For the off-trail run there was an improvement in RE pre to post PJT (F1,16 = 4.5, p = 0.05, η2 = 0.219) although no difference between training interventions was observed (F1,16 = 2.2, p = 0.158, η2 = 0.121). The improvement in RE was substantial and ranged between 2-7 % (Figure 1b).
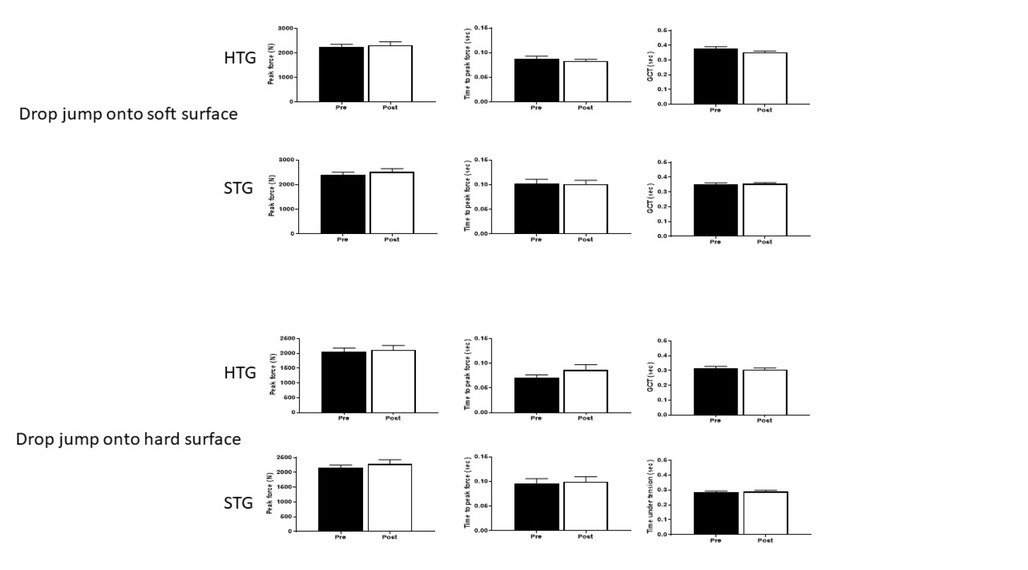
Drop-jump ground reaction force was not improved by plyometric jump training
Prior to the study, it was postulated that the elastic properties and the rate of force production could be enhanced after PJT. We therefore measured peak force development, time to peak force and GCT during one-legged drop jumps from a 38 cm platform onto a force plate. However, as can be seen in Figure 2, the only variable that was improved after the training intervention was GCT for the HTG when they performed drop jumps onto a soft surface (F1,17 = 5.0, p = 0.039, η2 = 0.228). Thus, this marginal improvements in force production could not explain the significant improvements in RE after PJT.
Figure 2
2) Effects of plyometric training on ground reaction force variables. Peak force, time to peak force and time under tension between the HTG and the STG Upper panel: Forces when participants performed one-legged drop jumps onto a soft surface. Lower panel: Forces when participants performed one-legged drop jumps onto a hard surface. All data are mean +/- SEM and the average of both legs are shown.
VO2max decreased after plyometric jump training
VO2max was reduced after PJT in both groups (F1,15 = 18.7, p = 0.001,η2 = 0.55) from 3.42±0.57 to 3.15 ± 0.53 L/min (-8%) in the HTG and from 3.93 ± 0.79 to 3.72 ± 0.97 L/min (-5%) in the STG (Figure 3a). Both groups reduced their VO2max equally as no interaction was present for time and group (F1,15 = 0.17, p = 0.898, η2 = 0.01).
Figure 3
3a) VO2 max pre and post intervention in the HTG (n=7) and STG (n=10). All data are mean +/- SEM. Performance indices before and after plyometric training. 3b) Time to complete a 1.35 km time trail on a trail (TTT) (n=19). * indicates p < 0.05. All data are mean +/- SEM. Figure 3c) Pearson’s correlation between the change in RE and the change in TTT (n=19).
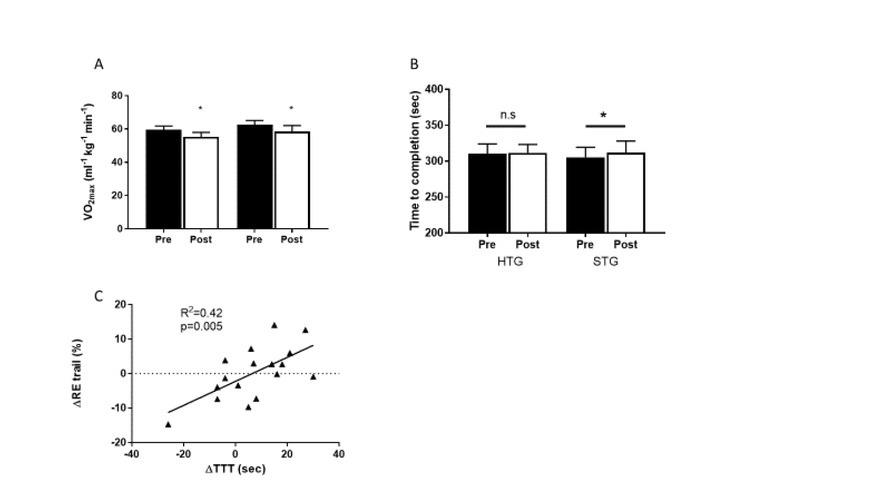
Change in time-trial performance correlated with change in RE
To elucidate whether improvements in RE were associated with changes in performance participants ran a 1350 m trail time-trial (TTT) at maximum effort. Despite lower VO2max, only the STG had decreased performance during the TTT (pre 297 +/- 37 s, post 312 +/- 51 s, p = 0.026), whereas the HTG had similar performance (pre 310 +/- 34 s, post 312 +/- 28 s, p = 0.85, Figure 3b). Overall, there was a trend for increased time to complete the TTT (F1,15 = 3.9, p = 0.066, η2 = 0.196). Although the STG increased their TTT it was not shown in the interaction effect for time and group (F1,15 = 2.8, p = 0.114, η2 = 0.114). A correlation analysis showed an association between changes in RE and changes in TTT performance (R2 = 0.42, p = 0.005, Figure 3c) indicating that RE is a strong factor determining performance and in this case the improvement in RE attenuated the negative effect of reduced VO2max on performance.
Discussion
This study investigated the effect of PJT performed on a soft and a hard surface on RE, VO2max, running performance and drop jump force development in orienteers. We hypothesized that the effects of PJT should be surface specific with training on softer surfaces leading to greater improvements in RE during off-trail running and training on a hard surface being more effective in improving RE at the treadmill and on the trail. Furthermore, it was hypothesized that the effect of PJT would be more substantial at higher running velocities where the improved elastic properties of the muscles become a more crucial aspect of RE. Interestingly, both groups showed significant improvements between 2-7% in RE on the treadmill regardless of speed, but only the HTG improved their RE on the off-trail loop. As this was a short-term plyometric study (4 weeks), it is plausible that the intervention was too short to produce any interaction effects between the groups. Nevertheless, 42% of the change in time-trial performance related to the change in RE, which makes it a key performance indicator independent of VO2max.
Although participants were instructed to continue their normal training in addition to PJT, VO2max was reduced by about 5 (STG) and 8% (HTG) after the intervention. These results were consistent when measured independently with both a stationary and a portable oxygen uptake device. The study was conducted during the fall, which is the endpoint of the competitive orienteering season. This could potentially mean that the training intensity was reduced through less competitions, even though the weekly practice routine continued as instructed. However, VO2max in professional athletes (~63 mL) was unchanged after a 5-week off season period though the exercise tolerance test showed a 24 s decrease when tested after the off season (Edwards et al., 2003). Nor did VO2max change during the course of one year in national track and field runners (~74 mL) (Svedenhag and Sjodin, 1985). It can be interpreted that VO2max is an indicator insensitive to small changes in training status while all out-test efforts are more prone to reductions in training loads. Previous studies have shown that there seems to be a trade-off between efficiency and power in the aerobic energy system so that improvements in metabolic efficiency are accompanied by similar reductions in VO2max and vice versa (Diebel et al., 2017; Fletcher et al., 2009; Pate et al., 1992). The negative association between the two variables has been explained by a shift in mitochondrial oxygen affinity with increasing metabolic efficiency as previously reported (Schiffer et al., 2016) and could form a logical basis for the reduced VO2max in our subjects. Indeed, the magnitude of reduction in VO2max in this study was similar to the improvement seen in running economy which substantiates the trade-off between efficiency and power previously reported (Flockhart and Larsen, 2019; Nilsson et al., 2019; Ronnestad et al., 2019).
The time-trial running performance conducted on a trail declined on average by 5% (p = 0.03) in the STG, while HTG performance was unchanged (<1%) indicating that the improvement in RE fully compensated for the reduction in VO2max in the HTG, but not in the STG.
Interestingly, we did not find any substantial changes in force plate drop-jump variables (Figure 2) indicating a lack of biomechanical adaptations throughout the intervention. An absence of change in jumping performance has previously been reported after short term PJT (Turner et al., 2003). We can therefore only speculate on the physiological changes that were responsible for the improvement in RE. It is unlikely that this kind of training had any beneficial effects on mitochondrial efficiency since the nature of PJT is explosive contractions and the duration of work is merely a few seconds, mitochondrial metabolism is therefore only marginally involved. Instead, it is likely that indices of neuromuscular properties not assessed during the drop-jump measurements were improved after PJT.
During field tests the weather conditions, surface structure and temperature are not controlled as in the laboratory. Nevertheless, these are conditions that athletes are exposed to during normal training and competition. During pre-tests it was raining and during post-tests there was a few centimetres of melting snow on the ground, both conditions made the terrain soft and wet. It has been proposed that during wet and unstable ground conditions the coefficient of friction is reduced, forcing the body to increase muscle activity to stabilize posture and movements with increasing energy cost of running as a result (Fletcher and Macintosh, 2019). Since the improvement in RE on the treadmill is substantially larger than during the field tests, it is likely that the present external conditions affected RE and masked some of the improvements during the field-based post-tests. We measured RE both in controlled laboratory settings and in the field and the comparison between the two training groups was made during the same external conditions.
Practical implications
Regardless of the fact whether PJT was performed on a soft or a hard surface, substantial improvements in RE on the treadmill were found. In the field-test PJT only improved running economy during off-trail running and only for the group that trained on hard surfaces. PJT conducted on a hard surface consistently induced greater improvements in both lab and outdoor settings regardless of terrain that could be meaningful in sports. We therefore recommend runners competing in mixed terrain, including softer surfaces, to incorporate PJT in their normal training. Furthermore, it is not necessary to perform the PJT at soft or surface specific surfaces. In conclusion, we demonstrated that 8 sessions of PJT spread out over 4 weeks improved RE independent of a training surface and the speed at which RE was assessed. The improvement in RE was independent of changes in force production, GCT or the rate of force production as assessed with one-legged drop jumps.