Introduction
The Hoffman reflex (H-reflex) is a tool for assessment of monosynaptic reflex in the spinal cord, modulated by input of 1a afferents to the alpha motoneural pool (MN) (Chen et al., 2012; Gajewski and Mazur-Różycka, 2016; Knikou, 2008; Palmieri et al., 2004; Pierrot-Deseilligny and Mazevet, 2000). Percutaneos electrical stimulation to the mixed peripheral nerve is applied to evoke H-reflex, targetting the monosynaptic reflex arc and efferent motor response (Zehr, 2002). This process begins with gradually increasing low-intensity stimulus that leads to primary depolarization of 1a afferents in the muscle spindle (Palmieri et al., 2004). Stimulation of 1a afferents result to action potentials directed to the spinal cord. Adequate activation of 1a afferents depolarize the presynaptic terminal, releasing neurotransmitters in the synaptic cleft of 1a alpha MN synapse. Then, post synaptic potentials in the MNs occur. When the excitory post synaptic potentials are capable of MN depolarization, acethycholine is released at the neuromuscular junction. This leads to muscle contraction, eliciting noticeable H-reflex tracing on electromyography (EMG) recording. Researchers suggest that regulation of H-reflex happens in the primary motor area of the central nervous system (Rollnik et al., 2000; Tanaka et al., 2015; Tanaka et al., 2012). The H-reflex is a useful technique in clinical, exercise, and sport settings (Gajos et al., 2014; Palmieri et al., 2004; Zehr, 2002).
Heart rate variability biofeedback (HRV BFB) is a non-invasive, visually-guided paced breathing intervention believed to influence autonomic modulation (Lehrer et al., 2000; Mackinnon et al., 2013; Huang et al., 2018). HRV BFB involves breathing at a pace (0.075 – 0.12 Hz or 4.5 – 7.2 breaths/min) known as resonance frequency (RF), that generates rhythmical changes in the baroreflex and activates the resonant properties in the cardiovascular system (Lehrer and Eddie, 2013; Lehrer and Gevirtz, 2013; Lehrer et al., 2000; Vaschillo et al., 2006). The baroreflex plays a crucial role in the regulation of blood pressure that operates in a negative feedback loop, such that increasing blood pressure reduces heat rate and vice versa. Key features in HRV BFB include occurrence of maximal heart rate oscillations and simultaneous oscillations of both heart rate and respiration. Regular HRV BFB practice enhances baroreceptor activity, vagal afferents and efferents that facilitate beneficial health changes (Gevirtz, 2013; Lehrer et al., 2003; McCraty and Shaffer, 2015; Prinsloo et al., 2014).
The application of HRV BFB may influence motor function through the central autonomic network (Beissner et al., 2013; Bennaroch, 1993). However, no study has investigated neural adaptation within HRV BFB context. Examining the magnitude of neural excitability from HRV BFB may provide noteworthy consideration of HRV BFB in neuromuscular settings. Thus, the purpose of this study was to determine motoneural excitability from acute HRV BFB.
Methods
Participants
Twelve healthy males (height: 173.7 ± 7.18 cm; weight: 72.7 ± 17.7 kg; age: 24.0 ± 5.02 yrs) with no reported lower body injury 2 months prior to experimentation were recruited for this pilot study. Participants were asked to avoid any strenuous physical activity and caffeine containing food/beverage 24 hours prior to experimentation. The last meal intake by participants was at least 2 hours before testing. A written informed consent was collected before any further experimentation. Ethical clearance for this study was approved by the University of Tasmania Human Research Ethics Committee (H0016508). The protocol of this study was in adherence with the Declaration of Helsinki for human experimentation.
Procedures
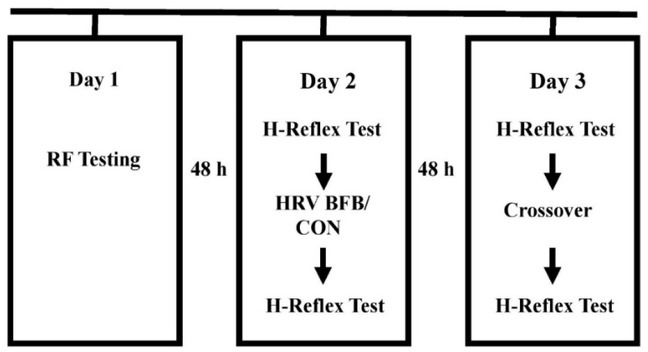
The participants attended three experimentation sessions, separated by 48 hours, at the Exercise Performance Laboratory of University of Taipei. Anthropometric measurements (height and weight), identification of individual RF were administered in the first session. Participants executed a randomized breathing at RF (HRV BFB) or normal breathing (CON) in the second session. A crossover HRV BFB or CON was performed in the third session. HRV BFB was carried out using a commercial HRV BFB equipment (HRV Starter System, Thought Technology, Canada). In CON, participants underwent normal breathing for 10 minutes with gaze focused at the computer screen. Figure 1 displays the experimental protocol for this study. Pre and post H-reflex indices in HRV BFB and CON were subjected for analysis.
Measures
Resonance Frequency
A commercial biofeedback equipment (HRV Starter System, Thought Technology, Canada) measuring respiration and HRV was used to identify RF. The RF testing involved two-minute breathing at various frequencies (6.5, 6.0, 5.5, 5.0, 4.5 times per min). Prior to RF testing, participants underwent a 5-minute familiarization of diaphragmatic breathing with nasal inhalation and pursed lip exhalation. RF was established as the breathing pace that demonstrated the highest amplitude in low frequency HRV (Lehrer et al., 2000; Task Force, 1996).
H-reflex
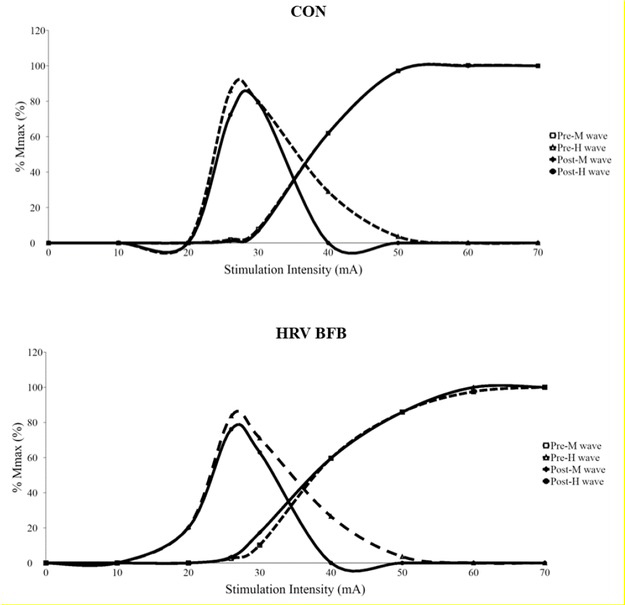
H-reflex was measured from the soleus (SOL) EMG of the dominant leg at resting condition. A surface electrode (TSD150A, Biopac Systems, USA) was placed 2/3 from the medial condyles of the femur to the medial malleolus and central position in the medial-lateral direction of the border of SOL. In addition, a reference electrode was attached on the dominant hand of the participants. Further, an adhesive electrode (10 × 10 mm, FA 25, Gem-Stick, Australia) was placed on the popliteal fossa as cathode and another (50 × 50 mm, Life Care, Taiwan) adhesive electrode was fixed over the patella as the anode. Participants were asked to sit with dominant knee extended at approximately 180 degrees, while non-dominant knee flexed at 90-120 degrees. Hip flexion was 90120 degrees. Recording of EMG signals were acquired using a commercial data acquisition system (MP150, Biopac Systems, USA) filtered with a band-pass range of 10-500 Hz and amplified with a gain of 1,000 times. The common mode rejection ratio for the EMG amplifier was 100 dB. Sampling rate was set to 2.5 kHz. A single electrical impulse was applied to the posterior tibial nerve via an electrical stimulator (DSH7, Digitimer, Herfordshire, UK) with 1000 μs pulse duration to identify SOL H-reflex response. To determine maximal peak-to-peak amplitude of H-wave and M-wave, stimulation intensity was increased with 10 mA increments until maximum M-wave (Mmax) was identified. The stimulation intensity for exhibiting maximum H-wave (Hmax) was determined by using incremental 2 mA until the H-reflex threshold is identified (see Figure 1). The stimulation intensity was set at 10% - 20% Mmax to elicit an H-reflex response in the ascending portion of the recruitment curve (Chen and Zhou, 2011). Each stimulation intensity was applied four times with 10 s inter-stimulation interval. A commercial data acquisition system (Acqknowledge 4.2.1 software, Biopac Inc., USA) with custom-written program was used to synchronize the electrical stimulation trigger and EMG recording. During H-reflex testing, participants were encouraged to breathe normally. A sample of H wave and M wave recruitment curves from one representative participant is displayed on Figure 2.
The following H-reflex indices were measured offline: a) M wave at maximal H-reflex (M wave at Hmax); b) Hmax; c) Mmax; and, d) Hmax/Mmax ratio (maximal Hmax response to normalized Mmax). Hmax estimates motoneuron excitability activated by Іa afferents, elicited from electrical stimulations (Gajewski and Mazur-Różycka, 2016; Knikou, 2008). Mmax represents recruitment of motor axons and provides an estimate of the size of motoneural pool response (Chen et al., 2012; Chen et al., 2015; Palmieri et al., 2004; Pierrot-Deseilligny and Mazevet, 2000). Hmax/Mmax ratio is the proportion of the entire MN pool recruited by Іa afferents (Kipp et al., 2011; Palmieri et al., 2004). M wave at Hmax refers to the proportion of motor fibers activated by electrical stimulations (Chen et al., 2015; Knikou, 2008). Additionally, the M wave at Hmax was utilised as a confirmatory marker to determine the consistency of relative stimulation intensity at the tibial nerve (Zehr, 2002).
Statistical Analysis
Data are expressed as mean ± standard deviation. The Wilcoxon-Signed Rank Test was carried out to determine significant difference in pre and post indices in HRV BFB and CON. Effect size was computed from matched-pairs rank-biserial correlation (r) using the simple difference formula (Kerby, 2014). The r is interpreted as small (0.10), medium (0.30), large (0.50), verylarge (0.70) (Cohen, 1988; Rosenthal, 1996). Statistical analysis was administered using a commercial statistical package (SPSS version 22, IBM Corp, USA) with alpha set at 0.05 level.
Results
The RF of participants ranged from 4.4 to 7.4 breaths per minute (0.09 ± 0.02 Hz). Non-significant difference in of M wave at H max confirmed the same relative stimulation intensity at tibial nerve in HRV BFB (Z = -0.67, p = 0.50) and CON (Z = -0.90, p = 0.37). Table 1 displays the pre and post H-reflex indices in HRV BFB and CON.
Table 1
H-reflex indices in HRV BFB and CON
There was a significant difference in pre-Hmax and post-Hmax at Z = -2.40, p = 0.04, r = - 0.67. No difference was observed in pre-Mmax and post-Mmax at Z = -0.89, p = 0.37, r = -0.30. A significant difference existed in pre-Hmax/Mmax ratio and post-Hmax/Mmax ratio at Z = -2.35, p = 0.02, r = -0.84. The M wave at Hmax/Mmax ratio was not significantly different in pre and post-test conditions at Z = -0.72, p = 0.47, r = 0.25.
Discussion
This novel study examined the effect of an acute HRV BFB on the SOL motoneural pathway using H-reflex. Findings revealed significant reduction in Hmax (r = - 0.67, large) and Hmax/Mmax ratio (r = - 0.87, very large) after HRV BFB.
Indeed, HRV BFB facilitated change in SOL neural transmission in this study. This can be observed by decreased resting Hmax/Mmax after HRV BFB. The alteration in Hmax/Mmax ratio is attributed tom maximal H-reflex amplitude rather than maximal M-wave amplitude, supported by reduced Hmax and non-difference in Mmax (Palmieri et al., 2004). The decreased Hmax/Mmax ratio reflects increased presynaptic inhibition from afferent depolarization (Kipp et al., 2011; Pierrot-Deseilligny and Mazevet, 2000; Zehr, 2002). It seems that the acute HRV BFB reduced the neural excitability between Ia afferents and alpha MNs. However, the exact mechanisms lowering 1a afferent activation after HRV BFB are unclear. A recent study by Bagheri et al. (2018) posted a negative relationship of resting Hmax/Mmax with vertical jump and balance task. This suggests the importance of resting neural excitability in neuromuscular tasks. More work is needed to establish the association of Hmax/Mmax attenuation from HRV BFB in voluntary muscle contraction and proprioception.
Limitations of the current study are acknowledged. First, generalization of results should be avoided as the neural outcomes from acute HRV BFB are only applicable to the sample population involved. Also, assessment of H-reflex was administered at resting condition. Inclusion of voluntary muscle contraction task whilst investigating H-reflex after HRV BFB may exhibit alteration of H-reflex from abolition of post-activation depression, clearer distinction of neural characteristics at lower stimulation intensities, and identification active motoneuron pool (Burke et al., 1989). Lastly, concurrent measurement of HRV with H-reflex after HRV BFB can determine trends in vagal reactivity from neural excitation.
The findings of this study serve as an impetus for future research within the context of HRV BFB and neuromuscular function. In conclusion, an acute HRV BFB facilitated depression of soleus motoneural excitability in the resting condition.