Introduction
Specific physical qualities such as sprinting, change-of-direction (COD) or jump height are determinants of sports performance (Faude et al., 2012; Haugen et al., 2014a; Soler-López et al., 2022). These capacities lead to the ability to reach a specific target in the fastest time possible in linear, curvilinear, or both types of trajectories with or without COD, as well as an athlete's ability to reach great vertical jump heights (Haugen et al., 2014a; Soler-López et al., 2022). As determinants of sports performance, sprinting, COD ability and jump height are part of periodically applied fitness assessment batteries (Soler-López et al., 2022; Willberg et al., 2023). While instantaneous speed is regularly assessed using a radar gun or video-based analysis (Bataller-Cervero et al., 2019; Romero-Franco et al., 2017; Uysal et al., 2023), sprinting time, COD time and jump height are usually measured using photocells.
Photocell systems which work by breaking a light beam are electronic devices that consist of a light emitting module and a receiving module sensitive to changes in brightness intensity; in many cases a mirror is also used to reflect the light beam to the receiving LED (Bond et al., 2017b; Haugen et al., 2014a; Haugen and Buchheit, 2016). Each time an object or subject cuts the beam, the system triggers a signal that activates and introduces a marker or stops the timer. Considering that photocells are practical and easy to use, their implementation to assess the time to cover a distance from point A to point B has become a regular practice for assessing sprinting and COD (Yeadon et al., 1999). In addition, to obtain the time of movements with vertical displacement, these photoelectric systems use an array or a matrix of emitting LEDs (between 10 and 96 LEDs), organized in two parallel bars (one emitting and one receiving) (Attia et al., 2017; García-López et al., 2013; Glatthorn et al., 2011).
There are different types of photocells depending on how they operate (Haugen and Buchheit, 2016): (i) single-beam; (ii) dual-beam; and (iii) split-beam and post-processing. A pair of single-beam photocells is characterized by the use of a transmitter emitting an infrared beam to a reflector (positioned directly opposite) that reflects the beam back to the transmitter (Haugen and Buchheit, 2016). This can be used for situations in which any part of the body can be used to trigger the photocell. Dual-beam photocells (also termed as double-beam) consist of positioning two photocells at different heights and both beams must be broken to work the trigger, thus it is useful to avoid specific situations of triggering with lifted knees or swinging arms (Haugen and Buchheit, 2016). Because they condition the requirements for triggering, dual-beam systems ensure greater accuracy and reliability (Yeadon et al., 1999), thus being more recommended for scientific research.
As an alternative to single or dual-beam, split-beam photocells consist of using the same infrared beam that is split by a metallic device which will emit this infrared beam in two reflectors interspaced vertically by 20 to 30 cm (Haugen and Buchheit, 2016). Both beams should also be broken to trigger the photocell. However, this process seems to produce greater noise than when using dual-beam photocells (Haugen et al., 2014b; McBride et al., 2002; Wong et al., 2010). Another approach can be to use post-processing timing systems in which software scans all signals and processes the information to remove false signals.
As mentioned before, the use of photocells may constrain the accuracy and precision of data collection (Haugen et al., 2014b). However, the device itself can be also a determinant of reducing the bias and ensuring proper conditions for assessing human performance (Enoksen et al., 2009). In fact, in any performance analysis, reducing the error of the device should be ensured, otherwise, the inference about performance can be erroneous, based on the error of the device and not the variability of human performance (Hopkins, 2000; Hopkins et al., 2009). Experimental conditions should also be considered since, for example, different starting positions and experimental procedures may affect the accuracy and precision of results (Haugen et al., 2012).
Therefore, knowing the accuracy and precision of photocell timing can be a determinant of ensuring a higher quality interpretation of results and of selecting the most appropriate devices for specific objectives. In spite of the relevance of the topic, there has been no systematic review that summarizes the evidence about concurrent validity and reliability of photocells for use in sports analysis. This can be decisive for helping coaches and sports scientists to identify the accuracy and precision levels of different models, brands, and experimental conditions. For this reason, the purpose of this systematic review was two-fold: (i) to summarize the evidence about the concurrent validity of photocell timing for sports analysis; and (ii) to summarize the evidence about the reliability of photocell timing for sports analysis. Particular attention was also paid to the applied experimental procedures.
Methods
Experimental Approach to the Problem
A systematic review was performed in accordance with PRISMA (Preferred Reporting Items for Systematic Reviews and Meta Analyses) guidelines for performing systematic reviews in sports science (Moher et al., 2015).
Search Strategy
A systematic search of three databases (PubMed, Web of Sciences and SPORTDiscus) was performed to identify articles published prior to October 22, 2022. The PICO (Patient, Problem, or Population − Intervention or Exposure − Comparison, Control, or Comparator − Outcome/s) design was used to provide an explicit statement of the state of the question.
Priority was given to studies focused on the assessment of photocells. Three main groups of words were established: (1) population: “athletics”, “team sport”, “sprinter”; (2) intervention: “assessment”, “assessing”, “evaluation”, “method”, “protocols”, “test*”; (3) outcomes: “jump height”, “sprint time”, “contact time”, “running speed”. Words from different groups were combined to extract as many items as possible by adding Boolean markers. Clusters of keywords (population, intervention, and outcome) were connected with OR within each cluster and AND was used to combine the three groups: (athletics or “team sport” or sprinter) AND (assessment OR assessing OR evaluation OR method OR protocol* OR test) AND (“jump height” or “sprint time” or “contact time” or “running speed”). Additionally, the reference lists of the studies retrieved were manually searched to identify potentially eligible studies not captured by the electronic searches.
Screening Strategy and Study Selection
When the referred authors had completed the search (M.R.-G., A.M.-V. and J.P.-O.), they compared the results among themselves to ensure that the same articles were identified. Then, one of the authors (M.R.-G) downloaded the main data from the articles (title, authors, journal, date and databases) and put them onto an Excel spreadsheet (Microsoft Excel, Microsoft, Redmond, USA). Then, two authors (A.M.-V. and J.P.-O.) removed duplicates. The remaining articles were screened and checked by two authors independently (A.M.-V. and J.P.-O.) against the inclusion and exclusion criteria (Table 1). There were discussions with a third author (A.S.-L.) in the event of discrepancies regarding the selection process. Possible errata for the included articles were considered. Moreover, relevant articles not previously identified were also screened in an identical manner and further studies that complied with the inclusion and exclusion criteria were included and labelled as ‘included from external sources’.
Table 1
Inclusion/exclusion criteria.
Data Analysis
The information collected from the selected studies addressed the following aspects: (1) anthropometric characteristics of the sample (sex, age, body mass, height); (2) characteristics of the assessment protocols (location of photocells, photocell technology, measurement variables, assessment test and tools used); (3) results obtained with the tests carried out; (4) conclusions endowed with scientific rigor and objectivity, which helped in the analysis of the casuistry of the data obtained.
Quality of Studies
The methodological assessment process was performed by two authors (A.M.-V. and M.R.-G.) using an adapted version of the STROBE assessment criteria for cross-sectional research (O’Reilly et al., 2018), looking for studies that were eligible for inclusion. Each article was assessed based on 10 specific criteria (Table 2). Any disagreement was discussed and solved by consensus. Each item was evaluated using numerical characterization (1 = completed; 2 = non-completed). As suggested by O’Reilly et al. (2018), each study rating was qualitatively interpreted using the following law: the study has a risk of bias or low quality with a score lower or equal to 7 points, while those studies with higher scores are considered as of low risk of bias or high quality.
Table 2
Methodological assessment of the included studies.
| Reference | 1 | 2 | 3 | 4 | 5 | 6 | 7 | 8 | 9 | 10 | Quality |
|---|---|---|---|---|---|---|---|---|---|---|---|
| Altmann et al. (2018a) | 1 | 1 | 0 | 1 | 1 | 1 | 1 | 1 | 1 | 1 | High |
| Altmann et al. (2018b) | 1 | 1 | 0 | 1 | 1 | 1 | 1 | 1 | 1 | 0 | High |
| Attia et al. (2017) | 1 | 0 | 1 | 1 | 1 | 1 | 1 | 0 | 1 | 1 | High |
| Bastida Castillo et al. (2017) | 1 | 0 | 1 | 1 | 1 | 0 | 1 | 1 | 1 | 1 | High |
| Bond et al. (2017) | 1 | 1 | 0 | 1 | 1 | 1 | 1 | 1 | 1 | 1 | High |
| Bond et al. (2017b) | 1 | 1 | 1 | 1 | 1 | 1 | 1 | 1 | 1 | 1 | High |
| Cronin and Templeton (2008) | 1 | 0 | 1 | 1 | 1 | 1 | 1 | 0 | 1 | 0 | Low |
| Enoksen et al. (2009) | 1 | 0 | 1 | 1 | 1 | 1 | 1 | 0 | 1 | 0 | Low |
| García-López et al. (2012) | 1 | 0 | 1 | 1 | 1 | 1 | 1 | 1 | 0 | 0 | Low |
| García-López et al. (2013) | 1 | 1 | 1 | 1 | 1 | 1 | 1 | 0 | 0 | 1 | High |
| Glatthorn et al. (2011) | 1 | 0 | 1 | 1 | 1 | 1 | 1 | 0 | 0 | 1 | Low |
| Hanley and Tucker (2019) | 1 | 0 | 1 | 1 | 1 | 1 | 1 | 0 | 1 | 0 | Low |
| Haugen et al. (2014b) | 1 | 0 | 1 | 1 | 1 | 1 | 1 | 1 | 1 | 0 | High |
| Heredia-Jimenez and Orantes-Gonzalez (2020) | 1 | 1 | 1 | 1 | 1 | 1 | 1 | 1 | 0 | 1 | High |
| Viitasalo et al. (1997) | 1 | 0 | 0 | 1 | 1 | 1 | 1 | 0 | 0 | 0 | Low |
| Yeadon et al. (1999) | 1 | 0 | 1 | 1 | 1 | 1 | 1 | 0 | 0 | 1 | Low |
[i] Note: Provide in the abstract an informative and balanced summary of what was done and what was found (item 1); state specific objectives, including any prespecified hypotheses (item 2); define the eligibility criteria, and the sources and methods of selection of participants (item 3); for each variable of interest, provide sources of data and details of methods of assessment (measurement). Describe comparability of assessment methods if there is more than one group (item 4); explain how quantitative variables were handled in analyses. If applicable, describe which groupings were chosen and why (item 5); provide characteristics of study participants (item 6); summarize key results with reference to study objectives (item 7); discuss limitations of the study, considering sources of potential bias or imprecision. Discuss both direction and magnitude of any potential bias (item 8); give a cautious overall interpretation of results considering objectives, limitations, multiplicity of analyses, results from similar studies, and other relevant evidence (item 9); give the source of funding and the role of the funders for the present study and, if applicable, for the original study on which the present article was based (item 10).
Effect Measures
The data validity was interpreted according to the concordance value of the data collected by the photocell measurement systems compared to the gold standard (Hopkins et al., 2009). For this purpose, the intraclass correlation coefficient (ICC) was assessed according to the following scale of values: <0.50 (poor), 0.5–0.75 (moderate), 0.75–0.9 (good) and >0.90 (excellent) (Koo and Li, 2016), as well as Pearson's correlation coefficient (r) analysis was conducted with the interpretation as follows: non-significant (r < 0.10), low (0.10–0.30), moderate (0.30–0.50), high (0.50–0.70), very high (0.70–0.90), almost perfect (r > 0.90) and perfect (r = 1.00) (Hopkins et al., 2009).
Results
Identification and Selection of Studies
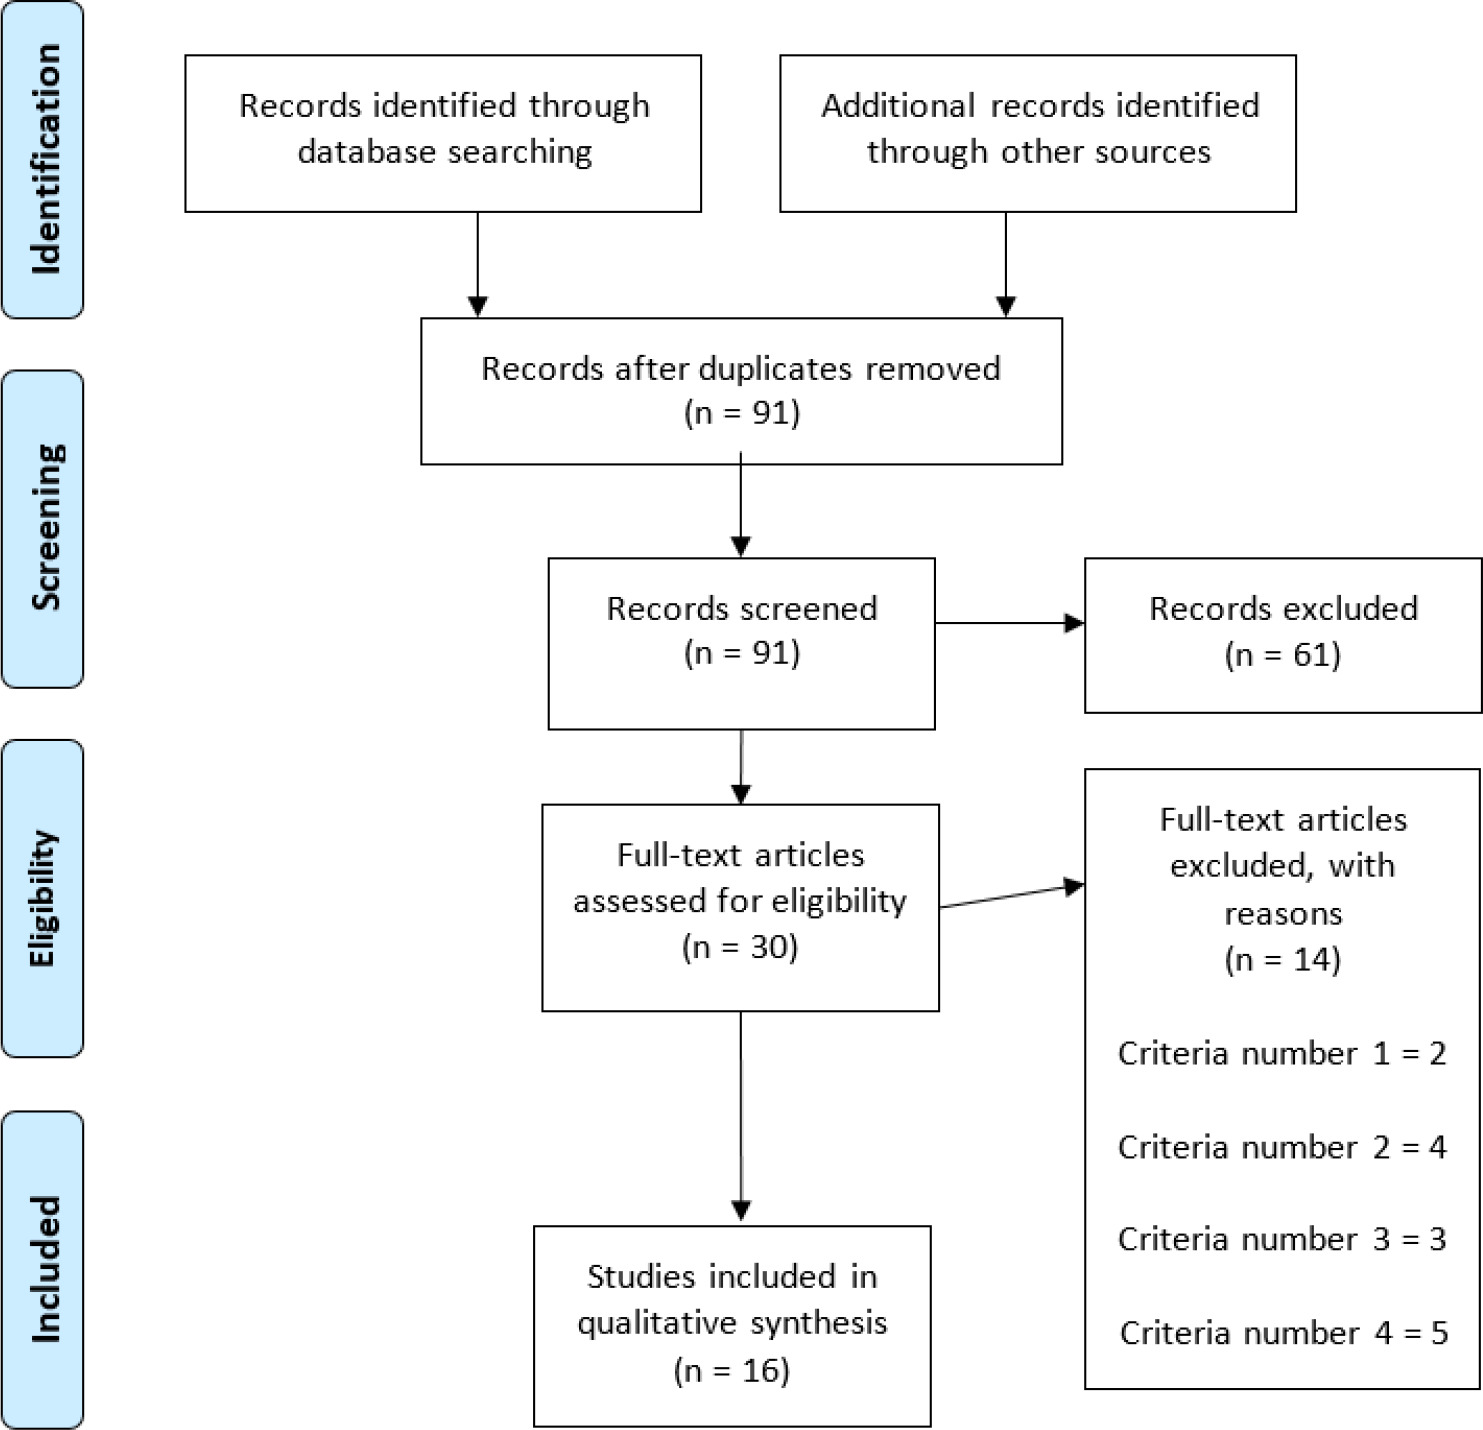
The database search identified a total of 164 titles (PubMed = 61; Web of Science = 48 and, SPORTDiscus = 55). These studies were then exported to reference manager software (EndNoteTM X9, Clarivate Analytics, Philadelphia, PA, USA). Duplicates (73 references) were subsequently removed either automatically or manually. The remaining 91 articles were screened for their relevance based on titles and abstracts, resulting in the removal of further 61 studies. Following the screening procedure, 30 articles were selected for in-depth reading and analysis. After reading full texts, further 14 studies were excluded due to not meeting the eligibility criteria (Figure 1).
Methodological Quality
The overall methodological quality of the cross-sectional studies can be found in Table 2.
Study Characteristics
Tables 3–5 summarize the characteristics of the studies, the validity of photocells for assessing sports movements and the reliability of photocells for assessing sports movements, respectively.
Table 3a
Characteristics of included studies.
| Study | Sport | OT | TV TR | DT | PT | |||||||
|---|---|---|---|---|---|---|---|---|---|---|---|---|
| Horizontal displacement measurement photocells | ||||||||||||
| Altmann et al. (2018a) | Team sports | Sprint time | Yes | No | TAG Heuer (La-Chaux-de-Fonds, Switzerland) | Single-beam | ||||||
| Altmann et al. (2018b) | Team sports | Sprint time | Yes | No | TAG Heuer (La-Chaux-de-Fonds, Switzerland) | Single-beam | ||||||
| Bastida Castillo et al. (2017) | Athletics | Run time | Yes | No | Chronojump (infrared cell) + WIMU PRO (RealTrack Systems) | 100 and 1000 Hz sample rate; Post-processing (S PRO software) Single-beam | ||||||
| Bond et al. (2017) | Hockey | Sprint time | No | Yes | TCi Photogate (Brower Timing System LLC, Draper, UT, USA) | Laser photocell Single-beam | ||||||
| Bond et al. (2017b) | Ice hockey | Sprint time | No | Yes | TCi Photogate (Brower Timing System LLC, Draper, UT, USA) | Laser photocell Single-beam | ||||||
| Cronin and Templeton (2008) | Athletics | Sprint time | No | Yes | Swift Performance Equipment (Lismore, Australia) | Dual-beam (Accuracy 0.01 s) | ||||||
| García-López et al. (2012) | Physically active | Sprint time | No | Yes | DSD Laser System (DSD Inc., León, Spain) | Single-beam (laser light) Dual-beam (laser light) Sport SPEED-v2.0 (500 Hz) software | ||||||
| Haugen et al. (2014b) | Athletics | Sprint time | No | Yes | Brower Timing System LLC, (Draper, UT, USA) Biomekanikk AS (Oslo, Norway) | Single-beam (Accuracy 0.01 s) Dual-beam (Accuracy 0.01 s) | ||||||
| Yeadon et al. (1999) | Physically active | Running speed | Yes | No | Not specified | Single-beam Dual-beam | ||||||
Table 3b
Characteristics of included studies.
| Study | Sport | OT | TV | TR | DT | PT | ||||||
|---|---|---|---|---|---|---|---|---|---|---|---|---|
| Vertical displacement measurement photocells | ||||||||||||
| Attia et al. (2017) | Physically active | Jump height | Yes | Yes | Optojump (Microgate, Bolzano, Italy) | 1000 Hz sampling rate; Post-processing (Microgate v.3.01.0001) 32 light-emitting diodes | ||||||
| García-López et al. (2013) | Athletics | Jump height | Yes | Yes | Study 1: SportJump System Pro (DSD Inc., León, Spain) ErgoJump Plus (Bosco System, Byomedic SCP, Barcelona, Spain) | Photocell mat, laser rays, 1000 Hz sample rate (SportJump v1.0 software). Photocell mat, infrared rays, 1000 Hz sample rate. 96 infrared leds | ||||||
| García-López et al. (2012) | Athletics | Jump height | No | Yes | Study 2: SportJump System Pro (DSD Inc., León, Spain) | Photocell mat | ||||||
| Glatthorn et al. (2011) | Physically active | Jump height | Yes | Yes | Optojump (Microgate, Bolzano, Italy) | 1000 Hz sample rate (Optojump, v. 3.01.0001 software) | ||||||
| Hanley and Tucker (2019) | Racewalking | Flight and contact time | No | Yes | OptoJump Next (Microgate, Bolzano, Italy) | 1000 Hz sample rate (5 baseline LED settings) | ||||||
| Heredia-Jimenez and Orantes-Gonzalez (2020) | Physically active | Jump height | Yes | No | Sport Jump System Pro (DSD Inc., León, Spain) | Laser rays, 1000 Hz sample rate (SportJump v 2.0 software) | ||||||
| Viitasalo et al. (1997) | Sprint and marathon | Contact time | No | Yes | Photocell contact mat (no trademark provided) | 3000 Hz sample rate | ||||||
| Horizontal and vertical displacement measurement photocells | ||||||||||||
| Enoksen et al. (2009) | Soccer | Sprint time | Yes | Yes | Photocells and mat Newtest Powertimer 300-series (Newtest Oy, Finland) | − | ||||||
Table 3c
Characteristics of included studies.
| Study | GS | PC | Experimental protocol | ||
|---|---|---|---|---|---|
| Test | Location of photocells | ||||
| D | H | ||||
| Horizontal displacement measurement photocells | |||||
| Altmann et al. (2018a) | High speed video cameras (100 Hz sampling rate) | 15 males (Age: 24.3 ± 1.8 yr.; 178.5 ± 7.4 cm; 74.6 ± 8.7 kg) | 3 x 30 m sprint | 5, 10 and 30 m System 1: 0.3 m System 2: 0.3 m | 1 m 0.64 m (knee) 0.25 m (ankle) |
| Altmann et al. (2018b) | High speed video cameras (100 Hz sampling rate) | 15 males (Age: 24.3 ± 1.8 yr.; 178.5 ± 7.4 cm; 74.6 ± 8.7 kg) | 3 x 20 m flying sprint (10–30 m) | 10 and 30 m | System 1: 0.64 m (knee) System 2: 1 m (hip) |
| Bastida Castillo et al. (2017) | Photocell (Chronojump software) | 3 males (−) | x6 attempts of 100 Hz (x3) and 1000 Hz (x3) 20 m and 400 m at maximum speed 150 m at different speeds | 0, 20, 150 m and 400 m | − |
| Bond et al. (2017) | 3D motion capture (240 Hz sampling rate) | 15 males (Age: 18.9 ± 0.7 yr.; 183 ± 7 cm; 86.5 ± 4.7 kg) | 5 x 18 m sprint Start at 0.3 m from the starting line. | 0, 9 and 18 m | 0.99 m |
| Bond et al. (2017b) | − | 17 males (Age: 19.0 ± 0.7 yr.; 184 ± 4 cm; 86.3 ± 6.4 kg) | 5 x 9.15 m sprint Start at 0.3 m from the starting line | 0 and 9,15 m | 0.99 m |
| (Cronin and Templeton, 2008) | − | 9 males and 6 females (Age: 22.7 ± 3.6 yr.; 172 ± 9 cm, 71.8 ± 12.2 kg) | 6 x 20 m sprint Start at 0.3 m from the starting line. | 10 or 20 m (x3 repetitions each time) | System 1: 0.60 m System 2: 0.80 m |
| García-López et al. (2012) | − | 25 males (Age: 20.5 ± 0.5 yr.; 178 ± 2 cm; 77.5 ± 1.8 kg) | 3 x 15 m sprint Start with three supports on the ground: 2 feet and one hand. 3 x 15 m flying sprint (20 m pre−acceleration) | 0, 5, 10 and 15m | 0.90 (hip), 1.10 m and 1.30 m in each distance |
| Haugen et al. (2014b) | − | 10 males and 15 females (Age: 19 ± 1 yr.; 174 ± 8 cm; 67 ± 10 kg) | 2 x 40 m sprint; standing stationary position start | 0.5, 20 and 40 m | Single-beam: 1 m. Dual-beam: 1.1 and 1.3 m at the start, 1.3 and 1.5 m at 20 and 40 m |
| Yeadon et al. (1999) | Panasonic F−15 (sVHS) camera at 50 Hz sampling rate Sony Handycam Pro (Hi−8) camera at 50 Hz sampling rate | 1 healthy and physically fit male athlete (Age: unspecified; 190 cm; 80.7 kg) | 5 x 9 m at 5, 6, 7, 8 and 9 m·s−1 | 1.6, 1.8, 2.0, 2.2 and 2.4 m | Single-beam: 1.05 m Dual-beam: 1.05 and 1.25 m |
Table 3d
Characteristics of included studies.
| Study | GS | PC | Experimental protocol | ||
|---|---|---|---|---|---|
| Test | Location of photocells | ||||
| D | H | ||||
| Vertical displacement measurement photocells | |||||
| Attia et al. (2017) | Force plate Quattro-Jump (500 Hz sample rate) | 20 males (Age: 22.50 ± 1.24 yr.; 177.05 ± 7.04 cm; 75.77 ± 13.22 kg) | 3−5 attempts SJ, CMJ and CMJ+ | − | − |
| García-López et al. (2013) | Force plate (1000 Hz sample rate) | 62 males and 27 females (Age: 20.5 ± 1.4 yr.; 170.5 ± 4.7 cm; 67.8 ± 5.6 kg) | x3 CMJ | − | Ground level |
| García-López et al. (2012) | − | 63 males and 19 females (Age: 20 ± 1.6 yr.; 170.9 ± 5.8 cm; 64.3 ± 7.5 kg) | x3 CMJ | − | Ground level |
| Glatthorn et al. (2011) | Force plate Quattro-Jump (500 Hz sample rate) | Validity: 20 males (Age: 22 ± 2 yr.; 180 ± 9 cm; 75 ± 10 kg) Reliability: 20 males (Age: 30 ± 5 yr.; 175 ± 10 cm; 68 ± 14 kg) | x3 attempts of SJ, CMJ and CMJ+ | − | Ground level |
| Hanley and Tucker. 2019) | Force plate Kistler (1000 Hz sample rate) | 11 males and 7 females (Age: 25.8 ± 4.1 yr.; 172 ± 8 cm; 60.5 ± 7.8 kg) | Running on treadmill and on the ground (11, 12, 13, 14 and 15 km/h in men; −1 km/h in each phase for women) | − | − |
| Heredia-Jimenez and Orantes-Gonzalez (2020) | Force plate Kistler (200 Hz sample rate) | 20 males (Age: 23.4 ± 2.9 yr.; 179 ± 6 cm; 75.2 ± 9.4 kg) | x2 CMJ | − | Ground level |
| Viitasalo et al. (1997) | Force plate Kistler (400 Hz sample rate) and force plate TR Testy Oy (170 Hz sample rate) | 2 males (1 sprinter and 1 marathoner) | 4–6 repetitions of running at 4, 5,5 km/h and at maximum speed | − | 10, 23, 37 and 46 mm |
| Horizontal and vertical displacement measurement photocells | |||||
| Enoksen et al. (2009) | Force plate (1000 Hz) + Dual-beam photocells | 20 males (Age: 19.1 ± 3.5 yr.; 179 ± 8 cm; 72.6 ± 7.8 kg) | x3 CMJ and SJ (Photocell mat) | − | − |
| 3 x 40 m sprint Standing start | 20 and 40 m | - | |||
Table 4a
Validity of photocells for assessing sports movements.
| Study | Device | Exercise | Measured variable | ICC | r | LoA (95%) | Lessons learned and concluding remarks |
|---|---|---|---|---|---|---|---|
| Horizontal displacement measurement photocells | |||||||
| Altmann et al. (2018a) | TAG Heuer | Standing start sprint (30 m) | 0.64 m height, time at: 5 m 10 m 30 m 1 m height, time at: 5 m 10 m 30 m | 0.134 0.278 0.657 0.008 0.400 0.869 | 0.351** 0.597** 0.848** 0.449 0.904 0.905* | −0.267–0.089 s −0.280–0.080 s −0.276–0.066 s 0.037–0.193 s 0.038–0.128 s 0.006–0.120 s | Questionable validity at 5 and 10 m Acceptable validity in 30 m, especially at 1 m height Data not interchangeable at different heights |
| Altmann et al. (2018b) | TAG Heuer | Flying start sprint (20 m) | 0.64 m height 1 m height | 0.978 0.969 | 0.985 0.991* | −0.060–0.120 m/s −0.013–0.121 m/s | Device valid at both heights for a 20 m sprint with a flying start |
| Bastida Castillo et al. (2017) | Chronojump + WIMU PRO | Standing start maximal runs (20 and 400 m), and a 150 m simulated circuit | At 100 Hz sample rate: 20 m 150 m 400 m At 1000 Hz sample rate: 20 m 150 m 400 m | 1.000 1.000 1.000 | 1.000** 1.000** 1.000** | Integration of the two devices obtained valid results | |
| 1.000 1.000 1.000 | 1.000** 1.000** 1.000** | ||||||
Table 4b
Validity of photocells for assessing sports movements.
| Study | Device | Exercise | Measured variable | ICC | r | LoA (95%) | Lessons learned and concluding remarks |
|---|---|---|---|---|---|---|---|
| Vertical displacement measurement photocells | |||||||
| Attia et al. (2017) | Optojump | Squat jump CMJ CMJ+ | Jump height | 0.989 0.994 0.982 | 0.978** 0.990** 0.968** | −12.29; −11,04 cm −11.56; −10.61 cm −5.74; −13.25 cm | Valid device but not interchangeable with a force plate |
| García-López et al. (2013) | SportJump System Pro ErgoJump Plus | CMJ | Flight time Jump height | 0.95−0.97 | 10.4–10.9 ms 0.013–0.015 m 45.1–56.5 ms 0.052–0.065 m | SportJump System Pro was a valid device. Ergojump Plus obtained questionable validity. None of the devices is interchangeable with a force plate | |
| Flight time Jump height | 0.45−0.57 | ||||||
| Glatthorn et al. (2011) | OptoJump | Squat jump CMJ CMJ+ | Jump height | 0.997 0.998 0.998 | Systematic bias 0.9 cm 1.0 cm 1.3 cm | Valid device | |
| Heredia-Jimenez and Orantes-Gonzalez (2020) | Sport Jump System Pro | CMJ | Flight time Numerical integration | 0.960 0.82 | 0.8–2.9 cm −6–10 cm | Valid device | |
| Horizontal and vertical displacement measurement photocells | |||||||
| Enoksen et al. (2009) | Newtest Powertimer 300−series | Squat jump CMJ | Jump height Jump height 0–20 m time 20–40 m time 0–40 m time | 0.65* 0.75** | −3.4–6.8 cm −2.4–8.0 cm | Device validity could not be confirmed | |
| 0.33 0.34 0.17** | 0.3%–2.1% −0.04–0.05 s −0.02–0.10 s | ||||||
| Sprint (40 m) | |||||||
Table 5a
Reliability of photocells for assessing sports movements.
| Study | Device | Reliability type | Measured variable | ICC | CV | Measurement errors | Lessons learned and concluding remarks by authors |
|---|---|---|---|---|---|---|---|
| Horizontal displacement measurement photocells | |||||||
| Bond et al. (2017) | TC Photogate | Intra-session and intra-device | Sprint time: 0–3 m 3–6 m 6–9 m 0–9 m 0–18 m | TE: 0.03 s 0.03 s 0.01 s 0.05 s 0.05 s | Reliable system, but sensitive to factors such as body tilt, body segments, and device height. | ||
| Bond et al. (2017b) | TC Photogate | Intra-session and intra-device | Sprint time | TE: 0.03–0.06 s | Reliable system TE lowers as the number of repetitions performed increased | ||
| Cronin and Templeton (2008) | Dual beam (Swift Performance Equipment, Lismore, Australia) | Intra-session and intra-device | Sprint time (0.60 m height): 10 m time 20 m time Sprint time (0.80 m height): 10 m time 20 m time | 1.1 % 0.69 % 1.2 % 0.83 % | Reliable device at both heights and distances | ||
| García-López et al. (2012) | DSD Laser System | Intra-session and intra-device | Sprint time (SB): 5 m 10 m 15 m Sprint time (DB): 5 m 10 m 15 m Flying sprint time (SB): 5 m 10 m 15 m Flying sprint time (DB): 5 m 10 m 15 m | 0.71 0.80 0.89 0.84 0.89 0.95 0.53 0.71 0.81 0.74 0.87 0.93 | 1.58 ± 1.83 % 1.07 ± 1.10 % 0.88 ± 0.77 % 1.29 ± 1.58 % 0.95 ± 0.95 % 0.71 ± 0.63 % 1.69 ± 1.56 % 1.51 ± 1.12 % 1.33 ± 0.85 % 1.48 ± 1.09 % 0.85 ± 0.74 % 0.74 ± 0.47 % | Reliable SB at all distances and races, especially from 10 m in acceleration races and 15 m in flying sprints Reliable DB at all distances and races, especially from 5 m in acceleration races and 10 m in flying sprints | |
| Haugen et al. (2014b) | Brower Timing System Biomekanikk | Intra-session and intra-device | Sprint time SB vs DB: 0–20 m 20–40 m | 1.4 % 1.2 % | SEM 0.02 s 0.02 s | ||
Table 5b
Reliability of photocells for assessing sports movements.
| Study | Device | Reliability type | Measured variable | ICC | CV | Measurement errors | Lessons learned and concluding remarks by authors |
|---|---|---|---|---|---|---|---|
| Vertical displacement measurement photocells | |||||||
| Attia et al. (2017) | Optojump | Intra-session and intra-device | Jump height (SJ) Jump height (CMJ) Jump height (CMJ+) | 0.980 0.992 0.999 | 6.47 % 3.70 % 1.76 % | SEM: 1.16 cm 0.79 cm 0.45 cm | Highly reliable device in the three exercises evaluated |
| García-López et al. (2013) | SportJump System Pro ErgoJump Plus | Intra-session and intra-device | Flight time (CMJ) Jump height (CMJ) Flight time (CMJ) Jump height (CMJ) | 1.21 ± 0.81 % 2.98 ± 2.01 % 6.61 ± 4.81 % 15.94 ± 11.48 % | SportJump System Pro is a reliable device ErgpJump Plus showed questionable reliability | ||
| SportJump System Pro | Intra-session and intra-device | Flight time (CMJ) Jump height (CMJ) | 1.14 ± 0.56 % 2.28 ± 1.13 % | Reliable device | |||
| Glatthorn et al. (2011) | Optojump | Inter-session and intra-device | Jump height (SJ) Jump height (CMJ) Jump height (CMJ+) | 0.982 0.989 0.984 | 3.1 % 2.2 % 2.8 % | Systematic bias −0.32 cm −0.11 cm 0.36 cm | Reliable device |
| Hanley and Tucker (2019) | OptoJump Next | Intra-session and intra-device | Contact time (RW): Treadmill Overground Flight time (RW): Treadmill Overground | 0.599–0.968 0.552– 0.984 0.311– 0.934 0.867– 0.995 | Systematic bias −0.04–0.042 s −0.011–0.024 s −0.042–0.04 s −0.024–0.010 s | Reliable device, especially the 2−2 configuration on treadmill and the 0−0 configuration on the surface | |
| Viitasalo et al. (1997) | Photocell contact mat | Intra-session and intra-device | Contact time (sprint−marathon: 10 mm height 23 mm height 37 mm height 46 mm height | 1.25–- 1.64 % 2.49–- 1.42 % 2.67–- 2.53 % 2.33–- 2.97 % | Reliable device, especially when placed 10 mm above the ground | ||
| Horizontal and vertical displacement measurement photocells | |||||||
| Enoksen et al. (2009) | Newtest Powertimer 300-series | Intra−session and intra−device | Jump height (SJ) Jump height (CMJ) 0–20 m sprint time 0–40 m sprint time | 0.7 % 0.2 % 0.4 % 0.4 % | Reliable device | ||
Discussion
Photocells have been widely used in sports to measure performance in both vertical and horizontal displacements (Haugen and Buchheit, 2016; Viitasalo et al., 1997). However, it is essential to ensure that the tools used are valid and reliable, to allow an objective interpretation of performance changes. Therefore, the aim of the present systematic review was to summarize and analyze the concurrent validity and reliability of photocells in sports, specifically when assessing horizontal displacements (i.e., sprinting time and velocity) and vertical displacements (i.e., flight time and jump height). The main findings revealed that quantifying the timing of vertical displacement is valid and reliable, whilst assessing horizontal displacements in an appropriate manner is a delicate task, especially when dealing with extremely small-time intervals such as in the first meters of a sprint. Nevertheless, the majority of articles indexed in this review have not reported the adjustment of the sensitivity of the infrared sensor, which controls the trigger sensitivity of the signal (Altmann et al., 2018a, 2018b; Haugen et al., 2014a; Haugen and Buchheit, 2016).
Factors Affecting the Validity and Reliability of Photocells for Monitoring Horizontal Displacement
It is well known that during sprinting the movement of the arms and legs is wider and faster than that of the trunk and the total center of mass, which might cause the timing gate to be prematurely or repeatedly triggered when using single beam photocells (Doma et al., 2023; Haugen and Buchheit, 2016). Altmann et al. (2018) showed that measuring horizontal displacement speed from a standing starting position with single beam photocells yielded a poor ICC (ICC = 0.278) in the first 10 m, likely because the lower running speeds and shorter time frames during the acceleration phase increased the magnitude of this error (Altmann et al., 2018; García-López et al., 2012). When starting from a crouched position, another source of error in the first meters is added because the body tends to tilt forward at least until the 13th step (or approximately 18.5 m) (Nagahara et al., 2014) which would also trigger the photocell beam before the center of mass reaches that position. For sprints longer than 20 m or with a flying start, validity of single beam photocells has been proven excellent (Altmann et al., 2018; Bastida Castillo et al., 2017). Another factor to consider is the photocell height, for instance, they can be placed near the ground to measure the start in standing position starting sprints (Altmann et al., 2018b) or at a height varying from knee to head height to detect the runner breaking the beam. This height can be adjusted to match specific needs (i.e., different athletes’ heights, different starting positions etc.). Photocells at lower beam heights (< 0.64 m) correspond to the shortest times, due to the fact that on many occasions the light beam is cut by the thigh, being sometimes difficult to detect by dual-beam or split-beam and post-processing systems. However, it has been shown that there were no significant differences between 0.64 and 1 m single beam photocell heights for a 20-m flying start sprint, decreasing the relative error (Altmann et al., 2018b), but there were differences with a split start (standing with one foot in front of the other) (Altmann et al., 2018a). This discrepancy is attributed to the fact that, for an initial distance of 0.30 m from the first timing gate, the ankle of the back foot could pass the initial timing gate simultaneously with the hip. Therefore, placing initial timing gates below the knee could improve their accuracy (Altmann et al., 2018b).
As it has been observed, during the acceleration phase over the first 10 m, the way of starting (standing or 3-point or 4-point) is a decisive factor, and the utmost rigor should be applied when deciding on the type of start to use as they are not comparable and cannot be used interchangeably (Haugen and Buchheit, 2016). To avoid these issues, the use of dual-beam or post-processing tools has been suggested (Altmann et al., 2018b), although the sensitivity of the infrared receiver should also be considered, providing further evidence of the superior validity of dual-beam systems compared to single-beam systems when aiming to avoid false triggering produced by swinging arms or legs (Haugen and Buchheit, 2016). This factor is not generally reported, but in some measuring devices it can be adjusted so that the light beam can identify small segments such as fingers, arms or the trunk, in order to consider only the segment of interest and avoid false triggering. However, 0.60 m height dual-beam photocells produce significantly faster times than 0.80-m height photocells for 10- and 20-m standing start sprints (Cronin and Templeton, 2008). Cronin and Templeton (2008) did not report whether these heights corresponded to the upper or the lower photocell, nor the distance between the two beams. Surprisingly, we found no investigations that aimed to assess the ideal distance between both beams in a dual-beam system, although there seems to be a consensus to place them 0.2 m apart. The results show that the relative error decreases considerably from 30 m onwards, likely because the photocell beam is no longer triggered early by the forward-leaning trunk as it becomes upright after just 16 steps from a block start (Nagahara et al., 2014).
Factors Affecting the Validity and Reliability of Photocells for Monitoring Vertical Displacement
Similarly as for horizontal displacements, photocell systems have been used for vertical displacement measurement, and were generally compared to force plates with sampling rates between 500 and 1000 Hz (Attia et al., 2017; Cronin and Templeton, 2008; García-López et al., 2013; Hanley and Tucker, 2019). The tests used were a squat jump (SJ), a counter-movement jump (CMJ) and a loaded counter-movement jump (CMJ+). The inter-trial intraclass correlation coefficient (ICC) of SJ, CMJ and CMJ+ heights obtained in the studies included in this review (range: 0.93 to 0.99) was in agreement (ICC: 0.95) with that reported by Nuzzo et al. (2011) measured with a Myotest accelerometer. Furthermore, if data are homoscedastic as in the study by Attia et al. (2017), SEM analyses may be more useful to establish absolute reliability (Atkinson and Nevill, 1998). In heteroscedastic data analyses including the coefficient of variation (CV) are recommended (Atkinson and Nevill, 1998). These results obtained from different manuscripts suggest that photocells are a reliable instrument for measuring vertical jump height estimated from flight time when compared to the gold standard (force plates).
Regarding validity, the different indexed studies (Attia et al., 2017; García-López et al., 2013; Glatthorn et al., 2011; Heredia-Jimenez and Orantes-Gonzalez, 2020) show a certain degree of agreement that photocells are valid systems for measuring vertical displacement when compared to force plates (gold standard). Despite ICCs for validity very close to 1 in all manuscripts, it is important to point out that it is a system that presents a certain systematic error of underestimation (Attia et al., 2017; García-López et al., 2013; Glatthorn et al., 2011) in jump height recorded by photocells. These findings could be attributed to the number of LEDs (32 LEDs), an adequate sampling frequency (1000 Hz), as well as the height of the LED barrier with respect to the ground, because the higher the photocells are, the lower the measured flight time will be. For example, for a gravitational value of 9.81 m·s−2 and a jump of 0.5 s, the jump distance can be calculated as 30.656 cm. Photocells with a small variation of 1 cm in height with respect to the ground would measure a time of flight of 0.49191 s, thus giving a jump height of 29.672 cm (i.e., 0.98 cm less). Despite these significant underestimates of the jump height data recorded by photocells, these systems appear to be valid and reliable, since there were significant correlations and systematic errors among the methods, and it was possible to establish prediction equations to overcome the underestimates shown by photocells versus force plates.
Conclusions
Based on this review, the method aiming at assessing vertical jump height through flight time with photocells appears to show a strong agreement with force plates (gold standard), yet is not interchangeable. The risk of collecting confusing data leads to misinterpretations that can affect the quality of training, and therefore athletes’ health and performance; therefore, coaches and trainers should be cautious when selecting the measuring instrument to assess and monitor athletes’ jump performance. Regarding the validity and reliability of photocells for monitoring horizontal displacement, it seems that double-beam systems, compared to single-beam systems, are more valid and reliable when it comes to avoiding false triggers caused by swinging arms or legs. This difference is particularly noticeable in the acceleration phase (first 10 m), in which the starting position (flying start, standing start) presents a marked relevance.