Introduction
The process of talent identification may have a decisive influence in sports. In soccer, the selection of youth males and females may be related to early physical maturation, and this could influence some physiological variables (Figueiredo et al., 2009; Gil et al., 2014; Gravina et al., 2008; Sedano et al., 2015; Wong et al., 2009). Additionally, it has been demonstrated that young people with accelerated maturational stages present advantages in sports performance (Duarte et al., 2019; Figueiredo et al., 2009; Gil et al., 2014; Práxedes et al., 2017; Wong et al., 2009).
The majority of countries select the birth year as a criterion for grouping of competitive categories, adopting the rules of the International Federation of Associated Football (FIFA) (Helsen et al., 2005). Thus, young people born in the first months of the calendar seem to benefit, as they present greater chronological age and, consequently, are more likely to be in more advanced stages of biological maturation (Altimari et al., 2018, 2011; Costa et al., 2012; Duarte et al., 2019). Various studies have demonstrated the advantages in physical abilities, cognitive knowledge, and psychological capacity in individuals with a greater chronological age (Cobley et al., 2009; Delorme et al., 2013; Malina et al., 2007; Sherar et al., 2007; Vincent and Glamser, 2006). Furthermore, it has been shown that the month of birth exerts influence on differences in body size (Carling et al., 2009; Duarte et al., 2019).
Therefore, early maturing players are favored in the process of selection (Carling et al., 2009; González-Víllora et al., 2015; Hirose, 2009). This phenomenon has been called relative age effect (RAE) in the literature, and is observed in some sports (Carling et al., 2009; Cobley et al., 2009; Delorme et al., 2013; Hirose, 2009; López de Subijana and Lorenzo, 2018; Musch and Grondin, 2001; Wrang et al., 2018). In addition, RAE is present in the selection of Brazilian players with progressive growth over the last decades (Altimari et al., 2018, 2011; Costa et al., 2012).
Although studies have analyzed the relationship between the month of birth and body structures (e.g. body mass and stature), few have analyzed the influence of months of birth on motor skills, power, and endurance performance. Furthermore, no studies have investigated how muscle fatigue can be influenced by months of birth. Thus, the objective of this study was to analyze the influence of months of birth on anthropometric, body composition, biological maturation, and motor performance in young Brazilian soccer players.
Methods
Participants
Initially, the sample size was calculated from the stature variable presented in the study by Carling et al. (2009) considering a statistical power of 80% and an alpha error of 0.05, which indicated the need for between 45 and 51 athletes per category, distributed between 15 and 17 athletes separated according to the categorization of chronological age in four-month periods. Thus, the sample was composed of 146 young Brazilian soccer players from the Under-13 (U-13, n = 50; 13.6 ± 0.3 years), Under-15 (U-15, n = 50; 15.5 ± 0.4 years), and Under-17 categories (U-17, n = 46; 17.7 ± 0.3 years) who were evaluated over a period of three years. Athletes had been involved in a soccer training program for more than 6 years, with participation in regional and state competitions, and at least four training sessions per week, in addition to official competitive games on weekends. The evaluations were carried out at the beginning of the preparation phase of the annual training cycle. All parents of the participants were aware of the procedures and risks of the experimental protocol and signed an informed consent form. This study was approved by the local Ethics Research Committee in accordance with the Declaration of Helsinki (CAAE: 25223313.0.0000.5231).
Determination of the tertiles according to the months of birth
Soccer players were divided according to categorization of chronological age, i.e., birth date, every four months, 1st tertile (1st TR), players born between January and April; 2nd tertile (2 nd TR), born between May and August, and 3rd tertile (3 rd TR), born between September and December. Initially, participants were submitted to anthropometric evaluation (stature and body mass) and skinfold thickness measurements to estimate body composition. In the following session, motor tests were applied. Participants were previously submitted to the tests used for familiarization with the test protocols and equipment. Subsequently, radiographs of the wrist region were taken to evaluate bone maturation.
Anthropometry and body composition
Body mass was measured on a PS 180® (Urano™, Brazil), and the stature was determined using a Standard Sanny® (Sanny™, Brazil) aluminum stadiometer. The values of lean body mass (LM) and relative body fat (%BF) were estimated from measurements of the triceps and mid-calf thickness measured on the right side of the body with a Lange® scientific adipometer (Cambridge Scientific Instruments™, USA), by an experienced evaluator. The %BF was calculated from specific equations according to the age group (Heyward and Wagner, 2004).
Biological maturation
The biological maturation (bone age) was determined from radiographs of the left wrist and hand region of each player (Greulich and Pyle, 1959). Participants were grouped into categories of advanced, normal, and delayed maturation based on the difference between bone age (BA) and chronological age (CA). The classification criteria used were similar to previous studies (Figueiredo et al., 2009; Malina et al., 2004), whereby: subjects who presented a difference between BA and CA within ± 1 year were classified as normal; subjects with a more advanced bone age relative to their chronological age by more than one year were classified as advanced; and subjects whose bone age was lagging behind their chronological age by more than one year were classified as late.
Motor performance
Aerobic fitness was measured by the Yo-Yo Intermittent Recovery Level 1 (YYIR1) and the estimated VO2max was calculated for each athlete (Bangsbo et al., 2008).
For the velocity evaluation, a running test with fixed distances of 10 and 30 m was used (Le Gall et al., 2002). Players began the test from a standing position. The test consisted of running as fast as possible. To record the times of the 10 (T10m) and 30 m (T30m), a photoelectric cell Multi Sprint® (Hidrofit™, MG, Brazil) was utilized with a fixed height of approximately 0.6 m. The rest interval between the T10m and T30m tests was at least 30 minutes, and athletes were allowed two attempts of each test, with a 10-min rest interval between the following attempts. The best result of the two trials was recorded for further analysis.
Three different vertical jumping techniques were followed: maximum vertical jump starting from the semi-squat position, without the aid of the upper limbs (Squat Jump; SJ); maximum vertical jump, with countermovement without the aid of the upper limbs (Countermovement Jump; CMJ); and maximum vertical jump, with countermovement with the aid of the upper limbs (Countermovement Jump Arms; CMJA). For the jump tests, a Multi Sprint® contact mat was used (Hidrofit™, Brazil). All participants performed three attempts of each type of the jump and the best result was registered for further analysis. The rest interval between each type of the jump was approximately 1 min.
The repeated sprint ability (RSA) test consisted of six sprints of 40 m (20 m + 20 m, shuttle-run) using a Multi Sprint® photocell (Hidrofit ™, Brazil), separated by 20 s of passive recovery (Impellizzeri et al., 2008). The variables analyzed were the mean sprint time (RSAmean) and the performance drop between the sprints (fatigue index). The fatigue index of RSA (FIRSA) was calculated by dividing the RSAmean by the RSAbest, expressed as a percentage.
The interval between the following testing sessions was 48 h. All the tests were carried out on a soccer field with individuals performing the tests wearing soccer boots and appropriate clothes in order to reproduce as closely as possible the real situation of a practice/game. In addition, participants were instructed not to perform training or any other vigorous physical activity, as well as not to ingest caffeinated substances (coffee, chocolate, mate, guarana power, and coke), or alcoholic substances in the 24 hours before the test to avoid possible interferences.
Statistical Analysis
Data are presented as means ± standard deviation (SD). The Gaussian distribution was observed through the Shapiro-Wilk test. The anthropometric data, body composition, and motor performance variables were analyzed using a two-way ANOVA. When significant differences were found, the Scheffé post-hoc test was used. To analyze the distribution of the soccer players according to the birth date every four months and the biological maturational classification, the chi-square test (X2) was used. The significance level adopted for all analyses was p ≤ 0.05. Statistical analyses were carried out using SPSS 21.0 software.
Results
Table 1 shows the distribution of young soccer players in the U-13, U-15, and U-17 age categories, according to the birth tertiles. No significant differences were found between the U-13, U-15, and U-17 categories, and birth tertiles (X2 = 3.42; p > 0.05).
Table 1
Absolute (AF) and relative (RF) frequency (%) values of the distribution of the participants studied in each age category according to the birth tertiles.
| 1st TR (Jan-Apr) | 2nd TR (May-Aug) | 3rd TR (Sept-Dec) | Total | ||||
|---|---|---|---|---|---|---|---|
| AF | RF | AF | RF | AF | RF | ||
| U-13 | 16 | 32.0% | 18 | 36.0% | 16 | 32.0% | 50 |
| U-15 | 17 | 34.0% | 17 | 34.0% | 16 | 32.0% | 50 |
| U-17 | 15 | 32.6% | 16 | 34.8% | 15 | 32.6% | 46 |
In relation to anthropometry and body composition, significant differences were observed between the age categories and birth tertiles for the stature, body mass, and lean body mass (F = 10.21, F = 9.29 and F = 9.67, respectively; p < 0.05) (Table 2). Additionally, it was found that players from the U-13 category presented significantly lower values for the stature, body mass, and lean body mass when compared to players from the U-15 and U-17 categories in the different tertiles (p < 0.05) (Table 2). Furthermore, there were significant differences between the 1st TR and the 3rd TR for the stature, body mass, and lean body mass of the players of the U-13 and U-15 categories (p < 0.05) (Table 2). However, there were no significant differences in the relative body fat between the analyzed age categories and birth tertiles (F = 3.47; p > 0.05) (Table 2).
Table 2
Values (mean ± SD) of anthropometric variables and body composition.
Table 3 presents the absolute and relative frequency values for the classification of the maturational status of soccer players grouped in the 1st, 2nd, and 3rd TR. Significant differences were observed in maturational status between the age categories, and birth tertiles (X2 = 30.48; p < 0.05). In the three categories analyzed, significant prevalence was observed of soccer players presenting normal maturational status independent of the birth month (p < 0.05), being that the U-17 presented higher prevalence than the U-13 and U-15 categories (95.0%; 72.0 and 78.0%, respectively; p < 0.05).
Table 3
Absolute (AF) and relative (RF) frequency (%) values of the biological maturation classification.
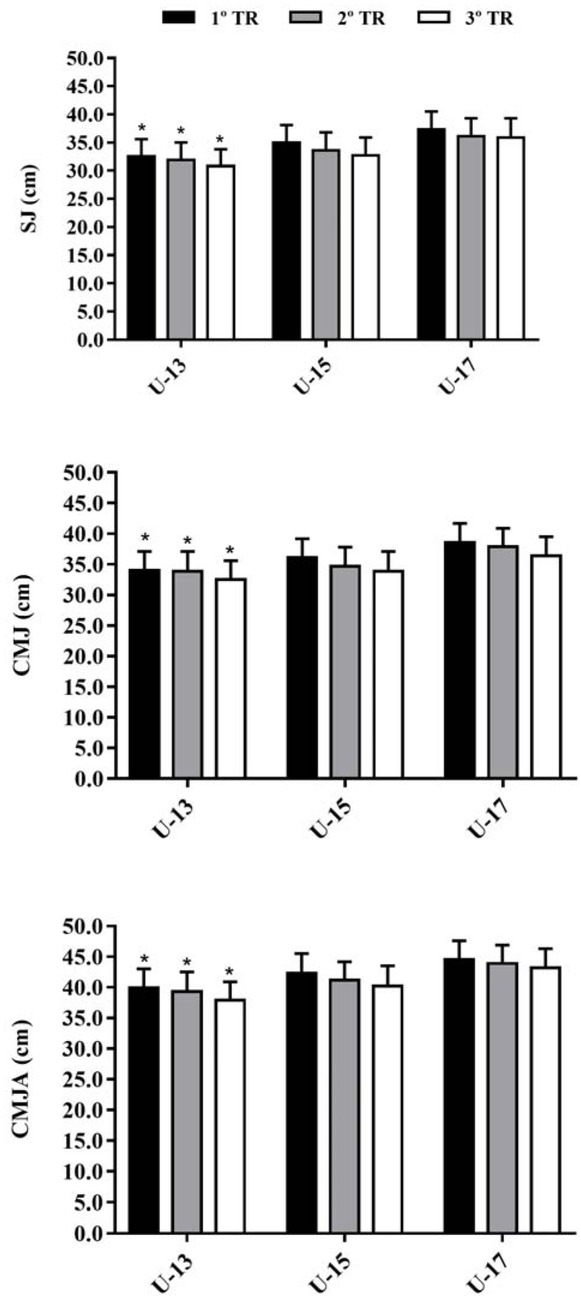
Performances in the lower limb power test obtained from the SJ, CMJ, and CMJA tests are shown in Figure 1. No significant differences were found between the birth tertiles for the SJ, CMJ, and CMJA tests (F = 2.37, F = 1.98 and F = 2.00, respectively; p > 0.05), although a significant difference was observed in age categories in the SJ, CMJ, and CMJA tests (F = 7.12, F = 6.58 and F = 6.95, respectively; p < 0.05). Players in the U-13 category demonstrated significantly lower values in the SJ, CMJ, and CMJA when compared to the U-15 and U-17 players in different tertiles (p < 0.05).
Figure 1
Values (mean ± SD) of performance in the tests of evaluation of the power of lower limbs. SJ = Squat Jump, CMJ = Countermovement Jump, CMJA = Countermovement Jump Arms. *Statistically significant differences between U-13 and U-17 categories (p < 0.05).
In relation to aerobic fitness, there was no significant difference in aerobic fitness between the birth tertiles (F = 3.85; p > 0.05), yet a significant difference was observed in age categories (F = 7.81; p < 0.05) (Table 4). Players in the U-13 category presented lower aerobic fitness compared to U-17 players in the different tertiles (p < 0.05) (Table 4). In the RSA test, significant differences were found between the age categories and birth tertiles (F = 7.35; p < 0.05) (Table 4). Values in the RSA test were significantly better for U-17 players when compared to U-13 and U-15 players in different tertiles (p < 0.05) (Table 4). In addition, significant differences between the 1st and the 3rd TR were observed for players of the U-13 and U-15 categories (p < 0.05) (Table 4). Furthermore, when analyzing the fatigue index obtained in the RSA test (FIRSA), there were no significant differences between the birth tertiles in all categories analyzed (F = 1.08; p > 0.05) (Figure 2).
Figure 2
Values (mean ± SD) of performance in speed tests of 10 and 30 m and fatigue index of repeated sprint ability test (FIRSA).
*Statistically significant differences between categories U-13 and U-17 (p < 0.05).
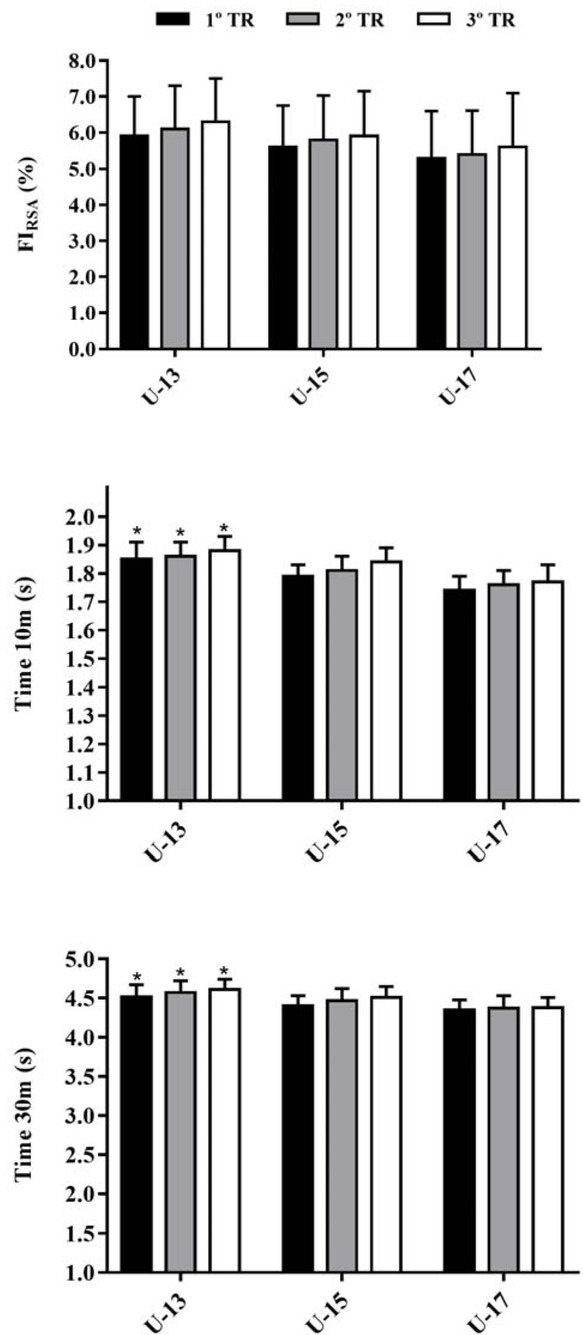
Table 4
Performance (mean ± SD) in aerobic endurance (YYIR1) and repeated sprint ability (RSA) tests.
Figure 2 shows the data obtained from the speed tests for the U-13, U-15 and U-17 categories, grouped into the 1st, 2nd, and 3rd TR. No significant differences were observed between the birth tertiles for the T10m and T30m (F = 1.68 and F = 1.56, respectively; p > 0.05), although a significant difference in age categories was observed in the T10m and T30m (F = 8.89 and F = 10.21, respectively; p < 0.05). U-13 players presented worse values in the T10m and T30m when compared to U-15 and U-17 players, in all birth tertiles (p < 0.05).
Discussion
The objective of this study was to analyze the influence of the relative age effect (RAE) on anthropometry, body composition, biological maturation, and motor performance in young Brazilian soccer players. The main results of the present study revealed that i) there were differences between age categories and birth tertiles for the stature, body mass, and lean body mass; ii) in the three categories analyzed, significant prevalence of soccer players presenting normal maturational status independent of the birth month was observed; and iii) there was a difference in motor performance between the birth tertiles only for RSA variables, and this difference was observed between age categories.
We did not find any differences in values of the distribution of players in each age category according to the birth tertiles. These results are different from studies that demonstrate higher prevalence of players born in the first tertile of the competitive year in European soccer players from U-15 to U-18 (Helsen et al., 2005), young amateur soccer players and professionals competing in European championships (González-Víllora et al., 2015; Helsen et al., 2012; Williams, 2009). In addition, these results were different from a previous study in our laboratory with the Brazilian soccer teams from U-14 to U-18, who presented a higher number of athletes born in the first four months (Altimari et al., 2011).
The present study verified that the stature, body mass, and lean body mass were different between the 1st and the 3rd TR in the U-13 and U-15 categories (p < 0.05). These results corroborate with other studies that demonstrated the influence of the birth date on the anthropometric characteristics of these young players (Altimari et al., 2018; Gil et al., 2014). In addition, anthropometric variables (body mass, stature, and lean body mass) were lower in U-13 players in the different tertiles when compared to U-15 and U-17. These results were similar to those from the study of Vaeyens et al. (2006), who demonstrated lower values of anthropometric variables in U-13 players when compared to U-14, U-15, and U-16 players.
Physical growth is a continuous process which occurs over the years, thus individuals born earlier in the year may benefit (months and/or years longer undergoing this growth process) when compared to those born towards the end of the year (Gil et al., 2014), which could explain the results found in this study.
Interestingly, the three categories analyzed in this study showed prevalence of soccer players presenting normal maturity in the three tertiles (U-13 = 72.0%; U-15 = 78.0%; U-17 = 95.0%), indicating that influence of the biological maturation may not be determinant for changing physical growth. Similarly, Hirose (2009) found that the stature of young Japanese soccer players born in the final three months of the year was lower than those born in the first trimester, for the U-11, U-13, and U-14 categories, although there was no difference between maturational status and distribution of the birth month in the categories. Perhaps this can be explained by the great biological variability within groups of the same chronological age (Baxter-Jones et al., 2005). Previous studies have shown that soccer players presenting advanced biological maturation are taller, heavier, and demonstrate better motor performance (e.g., running speed, aerobic power, and anaerobic capacity) than normal and delayed athletes (Duarte et al., 2019; Malina et al., 2007; Sherar et al., 2007).
In relation to motor performance, only performance in the RSA test showed significant differences between the first and third tertiles of the U-13 and U-15 players (p < 0.05). There were no significant differences between the birth tertiles in other variables. In addition, U-17 players presented better performance in some variables (SJ, CMJ, CMY, YYIR1, RSAmean, T10m, and T30m) compared to U-13 players in the different tertiles (p < 0.05).
Although RSA is directly related to performance in soccer (Rampinini et al., 2007), few studies have investigated the RAE on RSA in youth soccer players. In the study of Bliss and Brickley (2011), the influence of RAE on RSA was investigated, and RAE on performance during sprints was observed, although there was no difference in the fatigue index. These findings corroborate our results. However, recently Duarte et al. (2019) observed influence of RAE and predicted maturity status on RSA and the RSA fatigue index in soccer players aged 13-14 years, suggesting that being relatively older and, simultaneously, advanced in maturity status corresponded to a substantial advantage in characteristics related to soccer-specific fitness.
In addition, in the present study, no significant differences were found in performance in the YYIR1 between birth tertiles. This result is in line with the study of Deprez et al. (2012). Moreover, difference in motor performance was found between the age categories, which is similar to the study of Vaeyens et al. (2006). This difference may be explained by the greater muscular mass presented by older players when compared with their younger counterparts, and differences in resynthesis rates of energetic substrates as well as in rates of removal of exercise metabolites (Ratel et al., 2003).
The present study provides interesting data to sports professionals as the results demonstrated that RAE can be detrimental to player selection, because early maturing players (larger body size) are favored in the process of selection (Carling et al., 2009; Duarte et al., 2019; Hirose, 2009; Práxedes et al., 2017). The results indicate that the process based only on anthropometric aspects is a poor indicator of physical performance, and because of this, younger players equally capable (in physical performance) may be underestimated in the selection process due they have lower body size. Therefore, it is extremely important that professionals of sports and health assess players considering several aspects (anthropometry, maturational status and physical performance) during the process of selection, to prevent the loss of talents due to inadequate data.
Finally, the present experiment has some limitations due to the proposed methodology. It was not possible to identify causalities by analyzing associations. In addition, the study did not consider in the analysis the time of practice of young soccer players in the sport, which can be an intervening variable for this type of study. Only male athletes were also investigated, limiting the generalization of findings to female teams.
Conclusions
The stature, body mass, lean body mass, and repeated sprint ability in the U-13 and U-15 categories were influenced by the birth date. The other variables were not influenced by months of birth. In addition, U-13 players presented lower values in anthropometric variables and motor performance when compared with players of other categories. Thus, care should be taken during the process of talent selection, as many young players may be underestimated due to their date of birth and consequent inferior morphological attributes.
We suggest new longitudinal studies with monitoring players’ training, considering their morphological, physical, maturational, technical and cognitive attributes related to performance in the real game environment, as well as studies that quantify the number of young players, identified as potential talents who have become professional athletes in teams at the high competitive level.