Introduction
A flywheel resistance training device consists of one or more (fly-) wheels connected to a rotating shaft (Petré et al., 2018). The movement involves pulling a cord or strap wound around a traction shaft (Petré et al., 2018), while force is applied against a footplate during vertical movements, thus impairing the delivery of kinetic energy to the flywheel (Berg and Tesch, 1998). Basically, the athlete produces kinetic energy during the concentric phase, allowing a short period of increased resistance in the eccentric phase (Petré et al., 2018). Some reviews and meta-analysis have highlighted the benefits of using flywheel devices for improving muscle strength and power (Petré et al., 2018; Vicens-Bordas et al., 2018). A unique characteristic of these devices is the provision of the maximal resistance load during all phases of movement (Núñez and Sáez de Villarreal, 2017). In addition, a primary focus of research relates to the capacity of flywheel devices to produce higher eccentric mechanical output and muscle electrical activity compared to traditional devices (Carroll et al., 2019b; MarotoIzquierdo et al., 2017; Tesch et al., 2017), which has an important link with athletic performance and injury prevention programs (de Hoyo et al., 2015; Tesch et al., 2017). Higher eccentric than concentric mechanical output (i.e., peak force) has been defined in many studies as an eccentric overload (Berg and Tesch, 1998; Martínez-Aranda and Fernández-Gonzalo, 2017; Petré et al., 2018; Vicens-Bordas et al., 2018).
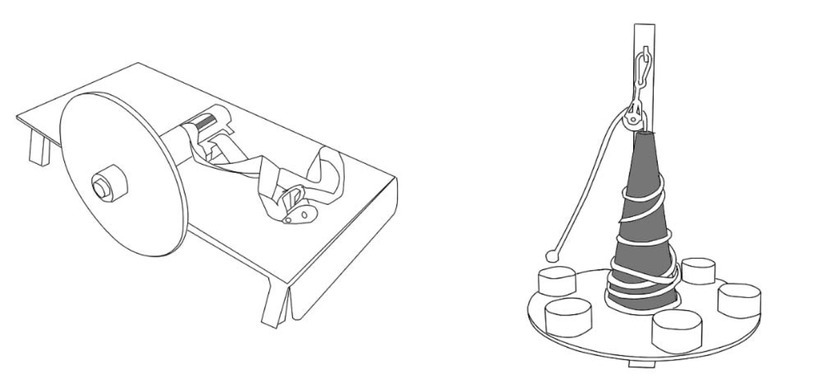
Flywheel devices can be classified into two different categories: vertical-cone (VC) shaped (Gonzalo-Skok et al., 2017; Núñez et al., 2019, 2020) and horizontal-cylinder (HC) shaped (Cuenca-Fernández et al., 2019) (Figure 1). The main difference between them is the rotating shaft shape; while in the VC shaped device the shaft has a decreasing radius from the base to the top, in the HC shaped device, the radius increases due to the strap winding around the rotating shaft (Núñez et al., 2020). Hence, a VC device offers a higher variation in the radius during the movement compared to a HC device. Besides, the base of the cone can be changed by attaching the closer round pulley to that base (Moras and Vázquez-Guerrero, 2015). During rotary movements, the shaft radius (and its shape) of both the disk and the rotating shaft determines the device workload (Carroll et al., 2019; Moras and Vázquez-Guerrero, 2015; Núñez et al., 2020). Hence, by definition, the lower the radius, the higher the amount of torque (≈ force) that can be applied for a given velocity (Núñez et al., 2020).
Figure 1
Horizontal cylinder (left) and vertical cone (right) manufacturing characteristics. The grey colour represents the shaft shape for each device.
To date, research has focused on the description of the mechanical output of different exercises with flywheel devices using force (Carroll et al., 2019b; Martínez-Aranda and Fernández-Gonzalo, 2017; Núñez et al., 2020), velocity (Carroll et al., 2019b; Moras and Vázquez-Guerrero, 2015; Núñez et al., 2020; Timon et al., 2019) or power (Martínez-Aranda and Fernández-Gonzalo, 2017; Núñez et al., 2019; Sabido et al., 2018). What is more, data have been described and compared through different absolute intensities (Carroll et al., 2019b; Martínez-Aranda and Fernández-Gonzalo, 2017; Sabido et al., 2018), which is in accordance with the overload principle (Stone et al., 2000). The overload principle establishes that after the application of an appropriate stimulus, internal homeostasis is disrupted and the athlete can elicit improved levels of physical performance (Stone et al., 2000). For this purpose, many studies have used different external loads (e.g. intensities) in different resistance training (RT) programs using flywheel devices (Martínez-Aranda and Fernández-Gonzalo, 2017; Núñez et al., 2020; Sabido et al., 2018).
Given the amount of research to date using flywheel devices, it is very important to understand the applied force and, as a result, the movement velocity used in them (Núñez et al., 2020; Núñez and Sáez de Villarreal, 2017; Petré et al., 2018; Vicens-Bordas et al., 2018). Some studies used the moment of inertia that maximizes the peak power output during a progressive loading test (de Hoyo et al., 2015; Núñez et al., 2019). The quantities of the moments of inertia used in the literature vary from 0.0125 (Martínez-Aranda and Fernández-Gonzalo, 2017) up to 0.33 kg·m2 (Núñez et al., 2020). Tous-Fajardo et al. (2006) showed that by increasing by 0.1 kg·m2 in the inertia used with a HC device, the athlete applied a higher force, but achieved lower movement velocity and power. Recently, Martínez-Aranda and Fernández-Gonzalo (2017) showed that when using a HC device, the higher the inertia, the higher the force, with an inverse response in velocity and power variables. Therefore, regardless of the power output, understanding the force and velocity which can be achieved using each moment of inertia could help determine an optimal training workload (external load) to enhance each conditional sport demands during physical training.
Recently it has been shown that the VC device offers less resistance to accelerate-decelerate the movement compared to the HC flywheel device (Núñez et al., 2020). Those authors observed that the mechanical impulse was the only variable capable of differentiating between moments of inertia and flywheel systems, recommending its use to quantify the training load. The impulse is determined by calculating the area under the force-time curve and this can be used to calculate the motion velocity using the impulse-moment theorem (Linthorne, 2001). Consequently, analyzing the force- and velocity-time data series would provide information on how mechanical impulse is generated to overcome the moment of inertia of the flywheel device and ultimately produce movement velocity.
The purpose of this study was to compare the force- and velocity-time waveforms between HC and VC devices with three different progressive moments of inertia, to characterize how these varied across the movement in the half squat exercise. It was hypothesized that there would be differences between the flywheel devices in the force- and velocity-time waveforms despite the same moment of inertia being used (Núñez et al., 2020), due to variations in the shaft shape and the radius width.
Methods
Participants
Thirty-nine healthy active men voluntarily participated in this study (mean ± SD; age: 23 ± 4 years, height: 1.75 ± 0.06 m, and body mass: 74 ± 10 kg). All participants had at least one year of experience in the flywheel exercises used in this study. A priori power analysis was conducted using software (G*Power 3.1.9.4; Heinrich-Heine-Universität Düsseldorf, Germany) to estimate the required sample size to identify differences between two dependent means. The minimal number of participants required to achieve a power of 0.85 with an alpha level of 0.05 was at least 38 participants. We conducted the study according to the Declaration of Helsinki, and the local research ethics committee fully approved the protocol before recruitment. After a detailed explanation of the aims, benefits, and risks involved in this investigation, all participants provided written informed consent. The main inclusion criteria were not to have any injury or illness that could interact against the results, to have a minimum of a year of experience using flywheel devices in resistance training programs, and to be physically active.
Design and Procedures
This was an observational, randomized cross-sectional study. We randomized the participants using simple randomization to execute several half-squat exercises using a VC and an HC flywheel device with the same three progressive moments of inertia (Figure 1). We also encouraged them not to intake any substance that might enhance their performance (i.e., caffeine, stimulants or creatine), nor to change their daily life or diet. In addition, we instructed the participants not to perform any physical activity 48 h before each intervention. The execution was voluntary and maximal throughout the concentric phase, while we instructed the participants to decelerate the kinetic energy at the end of the final third of the eccentric phase to increase the eccentric activation, as previously recommended (Núñez et al., 2019). An experienced strength and conditioning coach using flywheel devices supervised the execution technique: participants were asked and controlled to do a minimum of 90º of knee flexion, with the back almost perpendicular to the floor.
The tests were performed on two different days, at the same hour, with a minimum recovery period of 72 h. The exercise protocol consisted of a half squat incremental test performed using a VC flywheel device (Twister Pulley: Element Sport, Cádiz, Spain) and a HC flywheel device (YoYo Squat; YoYo™ Technology AB, Stockholm, Sweden). Prior to the exercise protocol, participant completed a 7-min standardized general warm-up including jogging, mobility exercises, and two sets of seven repetitions of the half squat exercise. The incremental test consisted of one set of nine repetitions with three different moments of inertia, with three minutes of recovery between sets. Participants were encouraged to push as hard as possible during the concentric phase. The first two repetitions were discarded from the analyses, as previously recommended (Sabido et al., 2018). The inertias used were: 0.11 kg·m2 (low), 0.22 kg·m2 (medium), and 0.33 kg·m2 (large) for both devices. This increment was chosen as it has been shown that a difference of 0.10 kg·m2 resulted in different force and velocity output (Tous-Fajardo et al., 2006). Vertical ground reaction force data were recorded using two force plates (SmartCoach Europe AB, Stockholm, Sweden), with the participant standing with one leg on each plate. Vertical velocity was measured with a linear encoder (Smartcoach Power Encoder, SmartCoach Europe AB, Stockholm, Sweden) attached to a harness (fastened on both shoulders and the waist) worn by the tested subject. Vertical velocity and vertical force data were sampled at 100 Hz and synchronized using an analog-to-digital converter (SmartCoach Europe AB, Stockholm, Sweden).
Statistical Analysis
All calculations were carried out in a custom-written Matlab code (MatlabWorks Inc., Natick, MA, USA). Vertical velocity and vertical time-series data for each set were segmented into seven maximal repetitions based on the time course of vertical velocity. A maximal repetition was defined as the event between the initiation of upward movement and the end of downward movement during half-squat execution. A positive vertical velocity indicated an upward movement, while a negative vertical velocity indicated a downward movement. Vertical force and velocity data for each maximal repetition were normalized to 101 points using a cubic spline interpolation technique. This enabled all force- and velocity-time waveforms to be expressed over normalized periods (percentage time), so that individual data could be aligned. Subsequently, data were averaged across the seven maximal repetitions performed for each participant, each load, and each flywheel device.
Statistical parametric mapping (SPM) (Friston, 2007) was used to compare the flywheel devices statistically. Specifically, an SPM two-tailed paired t-test was used to detect significant differences in force- and velocity-time waveforms between both devices used (α = 5%), considering each inertia as independent analysis. For paired t-test analyses, SPM involved two steps (Pataky, 2010). The first was to compute a scalar output statistic at each point in the normalized time series (SPM{t}). The SPM{t} indicated the magnitude of the differences in the flywheel devices; therefore, with this variable alone, we could not accept or reject our null hypothesis. The second step was to compute the critical threshold, which only α % (5%) of smooth random curves would be expected to traverse.
Due to the inter-dependence of neighboring points, multiple adjacent points of the SPM{t} curves often exceed the critical threshold, these are referred to as supra-threshold clusters. Supra-threshold clusters along the SPM curve were identified and the associated p-values were calculated using Random Field Theory (Adler and Taylor, 2007) and have been validated for 1D data (Pataky et al., 2016). All SPM analyses were implemented using the open-source spm1d code (v.M0.1, www.spm1d.org) in Matlab.
Results
SPM analysis of force and velocity curves of HC and VC flywheel devices, regardless of the inertia used, is shown in Figures 2 and 3.
Figure 2
Mean ± standard deviation vertical ground reaction forces (right panels) for the vertical cone-shaped shaft (blue) and horizontal cylinder-shaped shaft (red) and SPM two-tailed paired t-test (left panels) for the three moments of inertia used: low (a), medium (b), and high (c). The SPM{t} curves describe the differences between flywheel systems. Where the SPM{t} curve exceeds the critical threshold (dotted line), this area is shaded, and a statistically significant difference is present at those nodes marked by P. Vertical lines limit the concentric and eccentric phases.
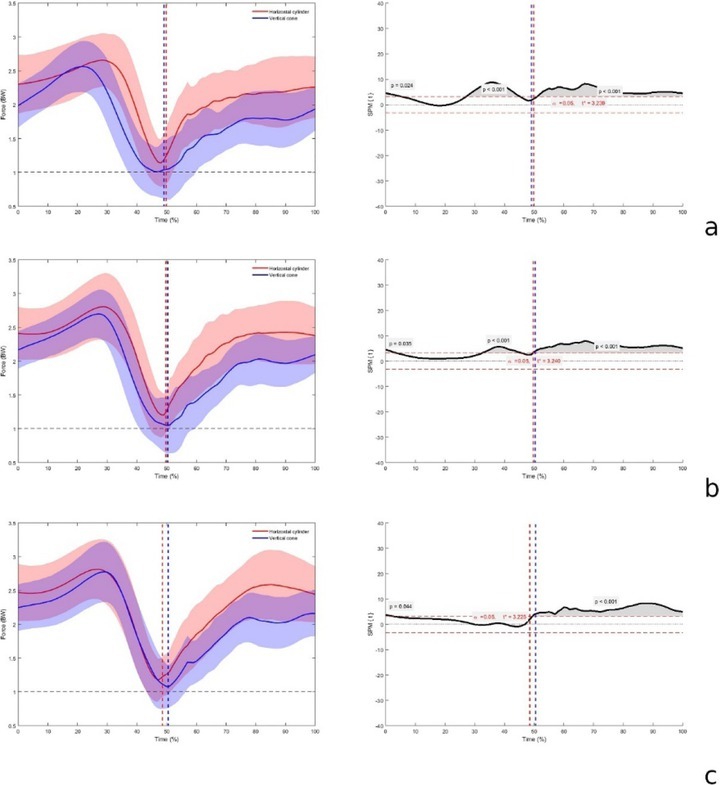
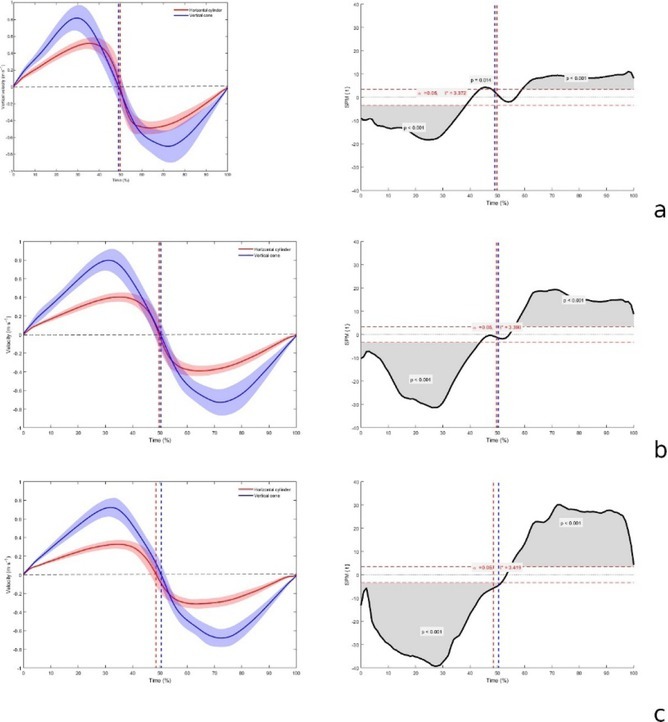
Figure 3
Mean ± standard deviation vertical velocity (right panels) for the vertical cone-shaped shaft (blue) and horizontal cylinder-shaped shaft (red) and SPM two-tailed paired t-test (left panels) for the three moments of inertia used: low (a), medium (b), and high (c). The SPM{t} curves describe the differences between flywheel systems. Where the SPM{t} curve exceeds the critical threshold (dotted line), this area is shaded, and a statistically significant difference is present at those nodes marked by P. Vertical lines limit the concentric and eccentric phases.
Average force-time and 95% confidence intervals for each moment of inertia used are shown in Figure 2. The results revealed a significantly higher force applied during the majority of the eccentric phase for the HC compared to the VC device, irrespective of the inertia used. For the three inertias, significant differences (p < 0.001) were found in the eccentric phase, between 57 and 100% of the half squat (Table 1). In contrast, the time interval in which differences were found during the concentric phase decreased as the inertia increased, becoming almost similar when the largest inertia was used (0.33 kg·m2). In the concentric phase, there were significant differences (p < 0.001) between 28 and 45% for the lowest moment of inertia (0.11 kg·m2), and between 33 and 45% for the medium moment of inertia (Table 1), with the HC being consistently higher.
Table 1
Average and peak force and velocity for each time interval where differences (p < 0.05) between flywheel systems were found for concentric and eccentric phases.
Average vertical velocity-time and 95% confidence intervals for each moment of inertia used are shown in Figure 3. Results revealed significantly higher velocity during the majority of the movement for the VC compared to the HC device, with all inertias. For all three inertias, significant differences (p < 0.001) were found between 0 and 39% (corresponding to the concentric phase) and between 60 and 100% (corresponding to the eccentric phase) of the repetition (Table 1). However, higher vertical velocity was found in the HC compared to the VC device during a short time interval in the concentric phase, although this was only observed when the lowest inertia was used. There were significant differences (p = 0.014) between 40 and 42% of the half squat (Table 1).
Discussion
The purpose of this study was to compare the force- and velocity-time waveforms between HC and VC devices with three different progressive moments of inertia, to characterize how these varied across the movement in the half squat exercise. Our results confirmed our initial hypothesis that the force- and velocity-time waveforms differed during the concentric and eccentric phases between devices, despite equal inertias being used. The HC device allowed higher force applications, especially during the eccentric phase, while the VC device resulted in higher velocities at all times during the exercise.
Strength and conditioning coaches commonly use the magnitude of the inertia to describe the exercise intensity when using flywheel devices (Carroll et al., 2019a; Martínez-Aranda and Fernández-Gonzalo, 2017; Sabido et al., 2018).
Previously, it has been shown that using a VC device will result in less resistance to accelerate the movement and brake it, compared to a HC device, and that the impulse is a valid variable to show differences among devices (Núñez et al., 2020). Our results show that, using different flywheel devices (classified as different shaft shapes), resulted in significant differences in the force application and subsequent velocity output in the half squat exercise. Thus, the way force is applied among those devices is different. Recent research has shown that, while during an exercise performed with a HC device the peak power output (Martínez-Aranda and Fernández-Gonzalo, 2017) and peak velocity (Carroll et al., 2019b) can be achieved with very low inertias (≈ 0.01 kg·m2), these were achieved using greater inertias (≈ 0.2 kg·m2) (Gonzalo-Skok et al., 2017; Moras and Vázquez-Guerrero, 2015) in the squat exercise while using VC devices. This agrees with our results which suggest that the wider the radius, the higher the power output, even though higher inertias were used in our study. For example, we showed that the higher the inertia used, the higher the differences in velocity between devices during both concentric and eccentric phases (Figure 3), in favor of the VC device. However, in force, these differences decreased in the concentric phase, in favor of the HC device, but were almost the same for the eccentric phase, again in favor of the HC device (Figure 2). These results suggest that the differences between the devices remained, regardless of the inertia used, in the eccentric force and especially in velocity. In consequence, when the impulse shows differences among devices (Núñez et al., 2020), it is because of the way force is produced at the end of the concentric phase (Figure 2).
Force- and velocity-time waveforms demonstrated opposite behaviors with regard to the inertia progression (Figures 2 and 3); in particular, the larger the inertia, the lower the differences in concentric force application in both devices (Figure 2). In contrast, there were greater differences in velocity during both phases. The differences in the eccentric force application were the same as in the concentric force application, with the larger the inertia, the lower the differences. The main differences in force between devices occurred at the end of the concentric phase (from 28 to 45% with the lower, and from 33 to 45%, normalized time, Table 1). However, there were no significant differences in the concentric phase when using the larger inertia (≈ 0.3 kg·m2) (Figure 2). Hence, using this intensity appears to elicit no differences, regardless of the device used. These results can be explained by the HC device shaft which is narrower, resulting in lower torque and the need to apply higher force to move the same inertia. These results are in agreement with Carroll et al. (2018), even though those authors used different moments of inertia and a different HC device.
Our results showed that, in addition to the inertia per se, the shaft shape determines the velocity of both concentric and eccentric phases. The HC device used in this study has a constant variation and narrower shaft radius of 0.01 m, while the VC device has a variable shaft radius with a maximum radius of 0.05 m and a minimum radius of 0.01 m. Although this looks very simple and the physics is quite clear in these definitions, to our knowledge, this feature has received no attention in the literature for flywheel devices. The larger VC shaft radius could explain the higher velocities achieved in this device in both phases (almost double the velocity, ≈ 0.48 m·s-1 vs. 0.26 m·s-1; Table 1). In addition to the radius, other features such as the shaft orientation (vertical vs. horizontal) and/or the distance from the rope fixing point to the flywheel could explain the mechanical output differences found between devices, although these characteristics have received little attention in the literature and were also not considered in the current study. Consequently, further studies are needed to understand in detail the biomechanics underlying the use of flywheel devices. Thus, professionals must be aware of basic physics concepts when new training devices such as flywheels are implemented in their daily strength training routines (Figure 1).
In the eccentric phase, the HC showed higher mean forces (≈ 2.15 N·kg, Table 1) compared to the VC device (≈ 1.74 N·kg, Table 1) for all the inertias used. Using a flywheel we could achieve higher muscle mechanical output during the eccentric phase of the movement compared to the same exercise with free weights (Norrbrand et al., 2010; Núñez et al., 2017). Previous researchers have commented that this could be attributed to its unique loading features, which was confirmed by our results. However, the differences in velocity highlighted another practical and previously unknown application. Despite the higher eccentric forces shown in the HC device, the higher velocities evident at all inertias in both the concentric and eccentric phases for the VC suggest that higher eccentric activation is achieved at lower velocities (almost half velocity, ≈ 0.48 m·s-1 vs. 0.26 m·s-1, Table 1). In contrast to velocity, the HC device showed higher values of applied force along with lower displacement velocities. Higher forces were observed in the eccentric phase when using the HC compared to the VC device. In contrast to the HC device, the VC device showed higher velocities in the concentric and eccentric phases. In addition, during the concentric phase, higher velocities were achieved by applying similar force values to those recorded for the HC device, especially when large inertia was used. Training at high velocities by applying high forces can have a positive impact on performance (Rabita et al., 2015). Therefore, more studies are needed to compare both flywheel devices in order to induce specific neuromuscular adaptations.
As previously shown, the shaft-type influences mechanical output in flywheel devices (Núñez et al., 2020). Hence, a limitation of this study is that it is difficult to compare our data with previous research in this line when different manufacturers are used. Thus, future research can focus on analyzing whether the differences found in our study are also present in different manufacturers' devices using the same moments of inertia and the same shaft-type devices. Therefore, further research is needed to understand whether the force application and resultant velocity using different manufacturers and/or flywheel types are comparable or not. In addition, different exercises in different devices and other levels of sport can be studied to contrast the presented information.
In conclusion, the design of a flywheel device determines the way force is applied by healthy adults when executing a half squat, and this determines the subsequent velocity of the movement. Our results showed that while HC devices elicited higher forces, especially at the end of the concentric phase and during almost the entire eccentric phase, the VC device was more suitable for producing higher velocities given the same inertia. In addition, the HC resulted in greater eccentric activation in relation to force in contrast to higher eccentric velocities in the VC device. Therefore, coaches and practitioners should acknowledge that the inertia itself must not be the only variable considered when planning exercises using flywheel devices during RT programs. The same inertia magnitude may not be interchangeable or comparable between VC and HC flywheel devices; both types of devices present unique properties during the squat exercise.