Introduction
Swimming is a popular and highly competitive sport requiring a combination of physical capabilities (Smith et al., 2002). There is a variety of swimming events in terms of distances (from 50 m in the pool to 25 km in open water) and styles (Baldassarre et al., 2017; Vescovi et al 2011). Freestyle swimming events in the pool range from 50 to 1500 m and last from about 20 s (50 m) to 15 min (1500 m) (Vescovi et al., 2011). 100-m swimming events are central in competitive schedules. In particular, the 100-m freestyle is a key event in competitions ranging from early age to the Olympics (Post et al., 2020). Furthermore, coaches have a special interest in their athletes’ performance in this event because of the inclusion of the 4 × 100-m freestyle relay in all swimming competitions. Consequently, the development of training practices for 100-m freestyle performance is of great importance for swimming coaches and supporting sport scientists (Durden, 2012).
Lasting less than one minute, the 100-m freestyle event depends on both anaerobic and aerobic metabolic efficiency, with comparable contributions from both metabolic pathways (Hellard et al., 2018; Mougios, 2020; Ribeiro et al., 2015). It is thus crucial for swimmers competing in the 100-m freestyle event to maximize lactate production capacity (Maglischo, 2003). To achieve that, they typically perform swimming sets consisting of repeated short distances at maximal intensity, with long rest intervals; 50 m has been proposed as one of the most suitable distances for such purposes (Maglischo, 2003). Sprint interval training (SIT) is characterized by repeated supramaximal efforts lasting 10 to 30 s, with recovery periods of about five times as much (Maclnnis and Gibala 2017; Sloth et al., 2013). Therefore, the aforementioned swimming sets for improvement of lactate production capacity can be defined as SIT. SIT has been found to improve aerobic exercise performance and VO2max, as well as anaerobic capacity (Gist et al., 2014; McKie et al., 2018; Nalcakan, 2014; Sloth et al., 2013). Thus, this kind of training might improve 100-m freestyle performance through the enhancement of both anaerobic and aerobic metabolism. Results from our previous studies have shown that SIT increases a large number of metabolic markers in swimmers’ blood (Kabasakalis et al., 2014, 2019, 2020a, 2020b; Nikolaidis et al., 2016a).
Blood lactate concentration is widely used as a metric of exercise intensity (Beneke et al., 2011), exhibiting high reliability in swimming tests (Nikolaidis et al., 2016a, 2016b, 2017). Intensity is a critical variable of SIT (Sloth et al., 2013), possibly due to the implication of lactate in both anaerobic and aerobic adaptations (Brooks, 2016; Nalbandian and Takeda, 2016). Different SIT sets of freestyle swimming, such as 4 × 50 m, 6 × 50 m, and 8 × 50 m, with various recovery periods induce high blood lactate concentrations (ranging from 12 to 18 mmol·L-1), which may be responsible for the effectiveness of SIT (Kabasakalis et al., 2014, 2019, 2020a, 2020b; Nikolaidis et al., 2016a). Likewise, 100-m freestyle swimming elicits the highest blood lactate concentration (around 14 mmol·L-1) among swimming events, along with 200-m freestyle swimming (Vescovi et al., 2011). These comparable lactate values between SIT sets and 100-m freestyle swimming suggest that the former are suitable to preparation for the latter. However, as far as we know, there are no data concerning the possible relationship between SIT sets and 100-m freestyle swimming.
Apart from metabolic efficiency, kinematic factors play an important role in swimming performance (Maglischo, 2003; Troup, 1999). The stroke rate (SR) (i.e., the number of stroke cycles a swimmer performs per minute) and the stroke index (SI) (i.e., the product of speed by stroke length, an index of swimming efficiency) are two variables used to describe swimming performance with regard to technique and efficiency (Dormehl and Osborough, 2015). Lätt et al. (2010) found that the SR and the SI explained most of the variability in 100-m front crawl performance of adolescent swimmers. Moreover, the SR and the SI are thought to distinguish between swimmers of different levels, with faster swimmers in 100 m or shorter distances exhibiting higher SR and SI values than slower ones (Chollet et al., 1997; Figueiredo et al., 2016; Seifert et al., 2007). Α recent study reported that swimming speed, the SR, and the SI decreased during maximal repeated distances of 50 m freestyle (Santos et al., 2020). Similarly, 100-m freestyle performance declined in the second 50-m lap compared to the first one, regardless of the performance level of swimmers (McGibbon et al., 2018). It is therefore understood that SIT sets used in swimming training should be in harmony with 100-m freestyle so as to improve the SR, the SI, and performance in this event.
Although sufficient literature exists regarding training for the 100-m swimming events and the physiological and biomechanical responses to various swimming sets, data on the possible relationship between variables of a SIT set and those of an event are scarce. Thus, the purpose of the present study was to examine the relevance of a maximal 4 × 50-m freestyle training set to the 100-m freestyle performance variables (i.e., speed, blood lactate, SR, SI). We hypothesized that performance variables (namely, speed, blood lactate, SR, and SI) in a maximal 4 × 50-m freestyle set and a maximal 100-m freestyle bout would be positively correlated.
Methods
To examine if a 4 × 50-m freestyle swimming set is relevant to the 100-m freestyle event, we assessed and compared speed, blood lactate, the SR, and the SI in competitive national-level swimmers who performed two tests on separate days under the same conditions in a cross-sectional design. The high level of the swimmers and the extended experience of three of the authors as competitive coaches ensured the applicability of the findings to high-level competition.
Participants
Twenty-seven competitive adolescent swimmers took part in the study, comprising 11 males, whose age, body mass, and height were 16.0 ± 1.3 years, 68.6 ± 7.7 kg, and 1.77 ± 0.04 m, respectively, and 16 females, whose age, body mass, and height were 16.2 ± 1.0 years, 59.5 ± 16.2 kg, and 1.66 ± 0.04 m, respectively (mean ± SD throughout). The males’ current personal best times in 50-m and 100-m freestyle were 26.34 ± 1.28 s and 56.63 ± 2.89 s, respectively; the corresponding values for females were 28.91 ± 1.03 s and 61.79 ± 1.93 s. These performances corresponded to 79%, 82%, 82%, and 84% of the world records, respectively. All swimmers trained at least six times a week, had training experience of more than 4 years, and were at the same training phase.
Athletes and their parents were informed orally and in writing about the details of the experimental procedure, after which they provided written consent. Procedures were in accordance with the Declaration of Helsinki and were approved by the Institutional Review Board.
Procedures
Measurements were carried out in an Olympic-size indoor pool at a water temperature of 27°C. After a light 10-min warm-up, swimmers completed a 4 × 50-m set with 2 min of rest between bouts and a 100-m bout on different days, at the same time of day (afternoon), and in random and counterbalanced order. Both tests were in freestyle, with a push-off start from inside the pool, and at maximal intensity. Swimming times were recorded with the use of an electronic stopwatch (Stopwatch Selecta, W10710, Waterfly). Before the first test, body mass was measured to the nearest 0.1 kg by an electronic balance (Seca, Hamburg, Germany), and body height was measured to the nearest 0.1 cm by a stadiometer fixed to the balance. Swimmers were instructed to follow the same diet on each testing day and to avoid training during the 24 h before each test (Kabasakalis et al., 2014). During both tests, lap time and time for three hand cycles in the middle of the pool in each lap were recorded with electronic stopwatches by experienced coaches-authors. From these times, speed, the SR, and the SI were calculated according to the formulas, speed (m · s-1) = distance (m) / time (s), SR (cycles · min-1) = 60 × 3 / time of 3 cycles (s), and SI (m2 · cycles-1 · s-1) = speed2 × 60 / SR (Bielec and Makar, 2010). Maximal blood lactate was measured with a portable analyzer (Lactate Scout 4, EKF Diagnostics, Germany) after each test. Specifically, a finger was pierced with a lancet, and a drop of capillary blood was analyzed every 2 min after the end of the test until the analyzer produced a reading that was lower than the previous one. Then the previous value was declared to be the maximal one (Kabasakalis et al., 2014).
Statistical Analyses
Results are presented as mean ± SD. We confirmed normality of distribution of all data sets through the Shapiro-Wilk test. We used two-way analysis of variance (test × gender) with repeated measures and Pearson’s correlation analysis to explore differences and correlations, respectively, of the performance variables between tests. Generalized eta squared
Results
Time, swimming speed, blood lactate, SR, and SI in the 4 × 50-m and 100-m tests are presented in Table 1. Significant main effects of the test (p < 0.001, 95% CI 32.256-33.680 s,
Table 1
Time, average swimming speed, blood lactate concentration, average stroke rate (SR), and average stroke index (SI) in 4 × 50-m and 100-m freestyle (mean ± SD) with 95% confidence intervals (CI) and effect sizes
| 4 × 50 m | 100 m | |||
|---|---|---|---|---|
| Males | Females | Males | Females | |
| Time (s)a, b | 29.13 ± 1.01 | 32.25 ± 1.16 | 60.37 ± 2.38 | 66.94 ± 2.55 |
| Tests | 95% CI: 32.256-33.680 | | ||
| Genders | 95% CI: 3.471-6.222 | | ||
| Speed (m·s-1)a, b | 1.72 ± 0.06 | 1.55 ± 0.06 | 1.66 ± 0.06 | 1.50 ± 0.06 |
| Tests | 95% CI: 0.043-0.074 | | ||
| Genders | 95% CI: 0.120-0.209 | | ||
| Lactate (mmol·L-1)a | 14.1 ± 3.1 | 15.3 ± 3.1 | 10.0 ± 3.1 | 11.6 ± 3.4 |
| Tests | 95% CI: 2.841-5.086 | | ||
| Genders | 95% CI: -0.894-3.746 | | ||
| SR (cycles·min-1)a | 48.8 ± 3.01 | 45.9 ± 3.5 | 45.1 ± 1.5 | 44.1 ± 3.9 |
| Tests | 95% CI: 2.028-3.421 | | ||
| Genders | 95% CI: -0.585-4.470 | | ||
| SI (m2·cycles-1·s-1)b | 3.65 ± 0.39 | 3.17 ± 0.33 | 3.68 ± 0.36 | 3.07 ± 0.32 |
| Tests | 95% CI: -0.016-0.102 | | ||
| Genders | 95% CI: 0.273-0.817 | | ||
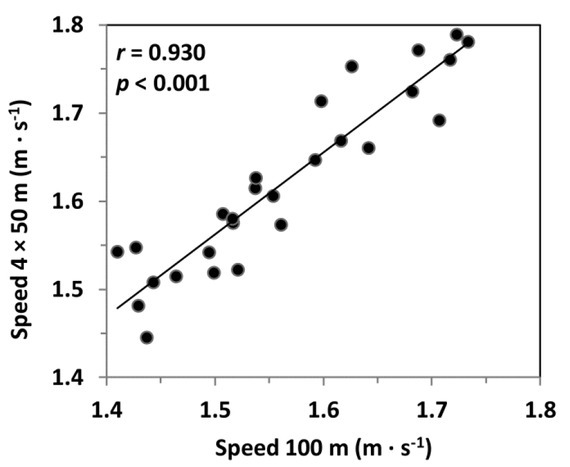
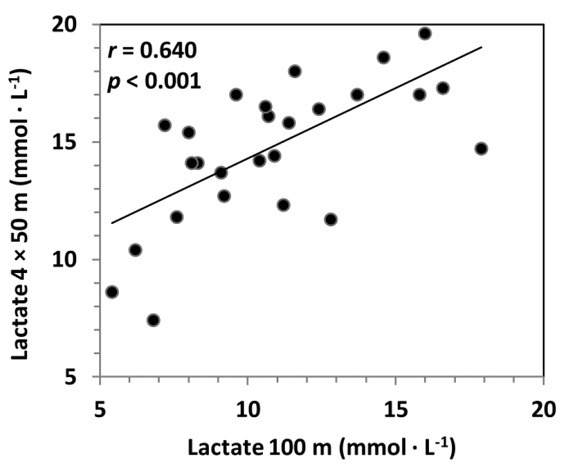
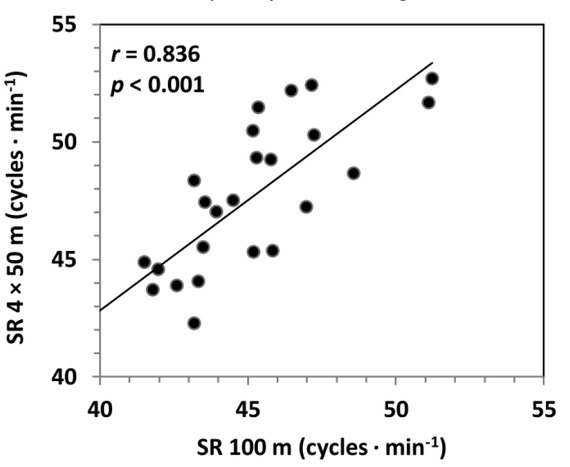
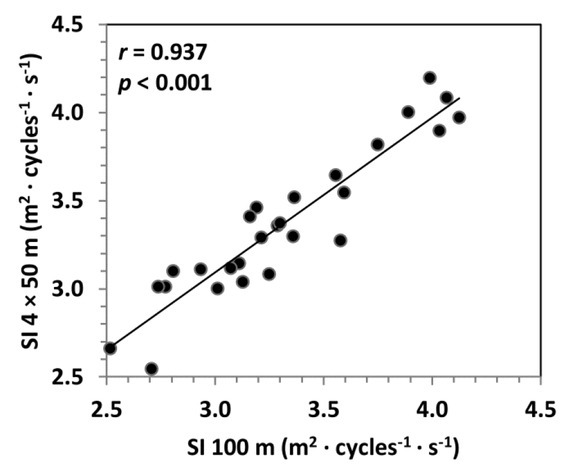
Correlations of speed, lactate, the SR, and the SI between 4 × 50 m and 100-m freestyle swimming are depicted in Figures 1-4. Significant correlations were found in all variables, that is, speed (r = 0.930, p < 0.001), blood lactate (r = 0.640, p < 0.001), SR (r = 0.836, p < 0.001), and SI (r = 0.937, p < 0.001).
Discussion
In the present study, we examined the presence of differences and correlations in swimming speed, blood lactate concentration, SR, and SI between a SIT set of 4 × 50 m and a 100-m freestyle bout. We found that speed, lactate, and the SR were higher in the SIT set, while all studied variables correlated highly between tests (with r values ranging from 0.640 to 0.937). This means that swimmers who displayed better performance variables during this SIT set were also the ones who performed better in the 100-m freestyle test.
Blood lactate concentration after the SIT set was comparable to that measured after similar sets used in other studies (Buchheit et al., 2010; Kabasakalis et al., 2019, 2020a, 2020b), although blood lactate after the 100-m freestyle test was somewhat lower than that reported in major competition (Vescovi et al., 2011). The difference in blood lactate between the SIT set and the 100-m freestyle test (with a large effect size of 0.29) is probably due to the higher work output or to the higher SR in the former (Morouço et al., 2014; Mougios, 2020). In a recent study, an ultra-short race-pace training session was examined, where swimmers were required to maintain the speed of their 100-m personal best and the post-exercise blood lactate concentration was found to be between the values found in the present study (Williamson et al., 2020). Training for the 100-m freestyle probably requires sets inducing blood lactate concentrations equal to or higher than the ones found after the 100-m event. The absence of a significant difference in the SI between tests implies that swimmers adjusted stroke length or other technical attributes to their chosen swimming speed (Mezzaroba and Machado, 2014).
As previously reported, the 100-m freestyle swimming event requires substantial energy contribution from both anaerobic and aerobic metabolism (Hellard et al., 2018; Mougios, 2020; Ribeiro et al., 2015). SIT regulates mitochondrial biogenesis by promoting activation of peroxisome proliferator-activated receptor gamma coactivator 1α (Li et al., 2020). Also, SIT freestyle swimming sets stimulate anaerobic metabolism to a great extent, as indicated by high circulating post-exercise uric acid, glucose, and lactate concentrations measured in competitive adolescent swimmers (Kabasakalis et al., 2014, 2019, 2020a; Nikolaidis et al., 2016a). Previous findings combined with the current ones of high positive correlation between tests with regard to all four measured performance variables (r = 0.930, 0.640, 0.836, and 0.937 for speed, lactate, SR, and SI, respectively, p < 0.001 for all) and higher values in the 4 × 50-m set, compared with the 100-m freestyle bout, in regard to three of them (with medium to large effect sizes), suggest that the 4 × 50-m set is a suitable and adequate training stimulus for improving performance in 100-m freestyle swimming. This is so because, for improved performance in the 100-m freestyle event, it is important to give swimmers appropriate stimuli to improve technical variables, such as the SR and the SI, and cope with metabolic ones such as acidification accompanying lactate production (Ribeiro et al., 2017; Vitor and Böhme, 2010). Moreover, the present findings support previous ones that performance variables, like the SI and anaerobic capacity/power, can predict performance in 100 m (Mezzaroba and Machado, 2014; Vitor and Böhme, 2010), as all studied variables correlated between sets, indicating that swimmers exhibiting higher qualities in the SIT set were more likely to do so in the 100-m freestyle event as well. In particular, average speed in the 4 × 50-m set explained 86% of the variability in the 100-m test.
As probably expected, male swimmers were faster than female ones and had a higher SI, with large effect sizes. These variables are usually higher in males due to anthropometric and force characteristics (Silva et al., 2019). The absence of a significant difference in blood lactate concentration between genders adds to the equivocal results on this matter (Kabasakalis et al., 2014, 2019, 2020a, 2020b).
Our findings encourage further research regarding the effects of long-term use of the SIT set on performance in the 100-m freestyle event, in accordance with the conclusion of a systematic review (Nugent et al., 2017) that implementing low-volume, high-intensity interval training in swimming is promising but needs further research. Overall, the present results encourage swimming coaches to include the SIT set of 4 x 50 m in training routines for the 100-m freestyle event. Additionally, coaches can use this set to predict performance in an upcoming 100-m competition.
In conclusion, competitive swimmers were faster, had higher post-exercise blood lactate concentration, and had a higher SR in the 4 × 50-m set compared to the 100-m freestyle event, while speed, lactate, the SR, and the SI correlated highly between tests. Thus, this SIT set is highly relevant to the 100-m freestyle event and, thanks to its higher performance variables, can be used in training for this event.