Introduction
Field hockey is a fast-paced intermittent team sport that involves physical actions such as walking, jogging, running, sprinting, changes of direction, passing, and hitting. These physical actions require a high level of both anaerobic and aerobic fitness, and both strength and power to complete the tasks (Lythe and Kilding, 2011). These physical actions have been extensively reported in field hockey through the use of time motion analysis (TMA) carried out using global positioning systems (GPS). Time motion analysis is a method that is used to quantify the movement patterns which athletes perform in training or matches (Delaney et al., 2017). Those analyses have found that elite male hockey players cover total distances between 8,000 and 10,000 m in a field hockey match (Jennings et al., 2012a, 2012b; Lythe and Kilding, 2011; White and MacFarlane, 2015). The use of these action profiles has helped coaches to understand the match demands of field hockey and gives them the ability to design training programmes around the physical demands of the sport. Time motion analysis systems do not actually measure the demands of a sport, rather they measure the output of players through measuring their external work. External work is defined as the load which is external from the body, including such activities as running, jumping, tackling, and kicking (Delaney et al., 2017).
The governing body for field hockey, the International Field Hockey Federation (FIH, 2017) has recently made changes to the rules of field hockey, which makes previous research in this sport less applicable to the modern game. The major rule change in the structure of matches changed the game from two 35-min halves to four 15-min quarters, reducing the total match length from 70 to 60 min and introducing two additional
rest periods. These changes have potentially influenced the physical demands of field hockey.
Three studies have explored the effect of the recent changes to field hockey rules on the demands of the game. Ihsan et al. (2018) found the total distance covered by players over each of the four quarters of the match to have significant differences, with Q1 (2171 ± 195 m) significantly higher than all of the following quarters Q2 (2072 ± 141 m), Q3 (2090 ± 135 m), and Q4 (2055 ± 212 m). There was a slight increase in the total distance from the second to the third quarter, which could suggest that after a longer break the physical capability of the player increases.
Delves et al. (2019) looked at quantifying the peak output during a whole match for each position. They found no statistically significant difference between any positions, and reported 1-min average output of players ranging from 200 to 210 m·min-1. These results are 50-65% higher than in previous studies, which found that speeds ranged from 120 m·min-1for defenders to 137 m·min-1for midfielders and 129 m·min-1for forwards (Polglaze et al., 2015). The higher output reported by Delves et al. (2019), when compared with that of Polglaze et al. (2015) could be due to the former researchers using a moving average to calculate the intensity of the match, rather than dividing the total distance by match time or by minutes played.
More recently, a time motion analysis of elite female field hockey was performed and found significant positional differences for 1-minute peak output with maximum speeds ranging from 100.7 m·min-1for defenders to 106.8 m·min-1for midfielders and 119.3 m·min-1for forwards (McGuinness et al., 2020).
Field hockey is also a highly tactical game, with decisions such as positioning of players on the field, how the substitutions are used, and team structures being pivotal to success (Linke and Lames, 2016). These factors will often influence and be influenced by the team’s physical capabilities and their skill level. The substitution rule permitting unlimited substitutions allows players extra time to recover during the match reducing physical fatigue which players will incur, which means they can potentially have higher physical output throughout the match (Forouhandeh, 2020).
There are three main positional groups in field hockey, i.e., attackers, midfielders and defenders, all of them with different match demands. During match play the aim for each position is different. Common themes between positions are that they all have offensive tasks and then must switch suddenly to defence. These role switches can often occur very quickly and then rapidly switch back again (Anders and Myers, 1999).
Due to the nature of invasion sports such as field hockey, it would be expected that there would be fluctuations in the running intensity during a match. The use of halves to calculate the demands of a match cannot pick up subtle fluctuations that occur throughout a match. Therefore the use of shorter segments, such as 10-min intervals (Jones et al., 2015), 5-min intervals (Varley et al., 2012), and minute by minute analysis (Granatelli et al., 2014) will provide a greater insight into demands of the sport. There are limitations due to using predefined periods of play because one intense period of play might not entirely fall into one of the predefined time periods, but rather fit across one or more periods of play, therefore the peak intensity of the passage of play might be underestimated. Varley et al. (2012) suggest that using a moving average method to calculate the peak running intensity of a match could give a more accurate representation of the data.
The aim of this study was to investigate positional peak running periods during a field hockey match using a moving average method. The secondary aim of this study was to investigate how the peak periods changed between quarters and positions. The results of this study can help inform players, coaches, and other support staff about the physical demands that field hockey players go through in match play so that physical training can be appropriately periodized, planned and prescribed.
Methods
Participants
Fifteen semi-elite male hockey players (age 24.3 ± 4.9 years; age range 18-35, body height 180.3 ± 4.6 cm; and body mass 80.4 ± 9.9 kg, mean ± standard deviation) volunteered to participate in the study. Data were taken while players competed in the 2018 national hockey league, where they played eight games over a two-week period, giving a total of 120 (15 x 8) individual match observations. Players were divided into three positional groups, forwards (40 match files; n = 5), midfielders (32 match files; n = 4), and defenders (48 match files; n = 6). As the tournament was a regional representative competition, players were regarded as semi-elite. Players were informed of the benefits and potential risks of participation in this study, and all provided written consent prior to the start of data collection. This study was approved by the University of Canterbury Human Ethics Committee.
Design and Procedures
An observational methodology was used to determine the peak running intensities of each position in field hockey. This method was used because it captures the dynamic and temporal nature of sport where it naturally happens, out on the field (Anders and Myers, 1999). The data were collected using global positioning system units. These were used as they provide a valid and reliable, non-invasive method to collect the information.
During each match players wore Apex 10-Hz GPS units (STATSports Apex, Northern Ireland). These were housed in specifically designed sports bibs worn under the playing tops, which positioned the units in between the players’ shoulder blades. To minimise errors in data collection, each player always used the same unit. Apex 10-Hz GPS units have been shown to provide a valid and reliable method for data collection on the physical output of field hockey players (Beato et al., 2018).
Statistical analysis
During data collection the starting and finishing times were recorded manually at the ground using UTC +12. The data were then edited into match play times, removing any data collected during the warm-up and break times, thus only match time was analysed. The data were then converted into 1-min time periods, using the manufacturer’s software (STATSports Apex Software, Version 5.0, STATSports Northern Ireland), and exported into a Microsoft excel spreadsheet. Data were checked in manufacturer’s software to verify whether there were any anomalies in the data due to lack of satellite connection or signal quality. No anomalies were found during match time, only during the warm-up and half time, and these were removed.
Statistical analysis was conducted using Microsoft Excel (version 1803), and RStudio (version 1.1.463). A total of 480 quarters of hockey were analysed (8 matches x 15 players x 4 quarters). Data for a quarter were excluded from analysis if a player did not take the field during that quarter. Reasons for not taking the field during a quarter included team tactics, injury, illness and other coaching decisions.
Moving averages were calculated from the 1-min periods for each player. For example, the 5-min average was calculated by averaging the first five 1-min periods (minutes 1-5), then for the next 5 min by moving the calculation down (minutes 2–6). Moving averages were also calculated for 2 to 10-min periods. The peak period for each time period was then calculated for each quarter.
Data are presented as mean ± standard deviation (SD), along with 95% confidence intervals. Cohen’s D effect sizes were calculated and evaluated as <0.2 trivial, 0.21–0.6 small, 0.61– 1.2 moderate, 1.21–2.00 large, and 2.0–4.0 very large (Hopkins et al., 2009).
A mixed effect model was used to control for the random variation that all of the players would create in the data set. The fixed effects were time, quarter and match, with the random effect being the player. With having players as a random effect this accounted for there being multiple measures on the same player in the same position. The model also controlled for differences that could occur during quarters and games. The mixed effect model controlled for the effect between each game and the effects of having a large number of games in a short period of time. The model showed that there was no statistically significant effect on peak running intensities between matches. Statistical significance tests were conducted for each position between quarters, and then between the position and the quarter; p values ≤ 0.05 were accepted as statistically significant. With the large amount of significance tests there was a possibility of false positive tests. Therefore, to assess whether the data would have practical significance the p value was required to be significant over multiple consecutive periods and a moderate effect size was required for the same periods.
Results
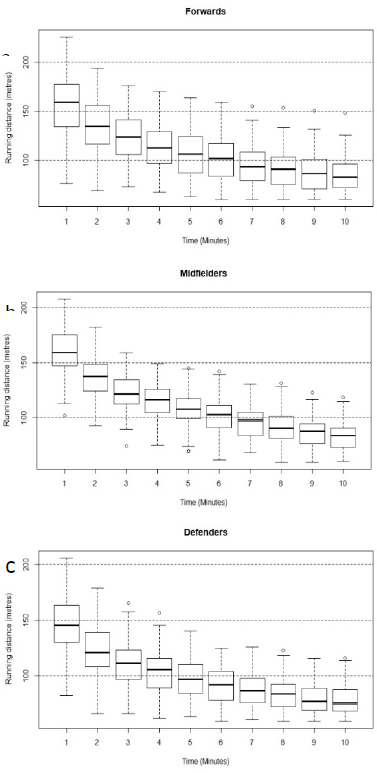
Figure 1 shows how the peak running intensities changed over the ten moving average periods for each position. It is evident that they started to plateau after 7–8 min, and also that both midfielders and forwards decreased their output at a faster rate than defenders.
A mixed effect model was used to calculate if there was a statistically significant difference between players for all positions. It found a p value of p = 0.001, which shows that there was a statistical difference between all of the players which was to be expected. The model was then used to calculate the differences between positions. When looking at the time periods as a whole, there was a statistically significant difference (p = 0.0025) between forwards and defenders. For forwards, the average distance covered in each quarter decreased by 1.53 m per time period. Midfielders decreased their output by 2.63 m per time period, while for defenders this decrease in distance covered was about 2.90 m per time period.
Figure 1
a) Running output for each minute period for forwards showing the mean with the box showing 25% (lower) and 75% (upper) of data. The dots above the error bars are potential outliers in the data.
b) Running output for each minute period for midfielders showing the mean with the box showing 25% (lower) and 75% (upper) of data. The dots above the error bars are potential outliers in the data.
c) Running output for each minute period for defenders showing the mean with the box showing 25% (lower) and 75% (upper) of data. The dots above the error bars are potential outliers in the data.
The distances covered in each moving average time period by quarter for each position are shown in Table 1. Forwards had the highest 1-min period in all four quarters compared to both midfielders and defenders. Forwards also produced their highest 1-min period in the first quarter, whereas both defenders and midfielders produced their highest 1-min period in the second quarter. For all three positions, the fourth quarter produced the lowest 1-min distance across the four quarters. Table 2 displays the significance value, effect sizes and a qualitative description of the effect size across all four quarters comparing performance of forwards, midfielders and defenders. There was a moderate effect between forwards and defenders in the first, third and fourth quarters.
Table 1
The mean ± standard deviation (SD) for all of the rolling average periods for forwards, midfielders and defenders during all four quarters of matches
Table 2
Presents p values and effect sizes with descriptions for comparison between each position, for each peak period (time) for each quarter of the match
Discussion
The aim of this study was to investigate the positional peak running periods during a field hockey match using a moving average method. The secondary aim of this study was to investigate how the peak periods changed between quarters and playing positions.
A moving average method was used, which demonstrated that in a 1-min period of the game, the peak running of a forward was 194.1 ± 24.2 m per minute (m·min-1), while the averages for longer periods were 131.6 ± 17.3 m·min-1 for a 5-min moving average period, and 98.2 ± 14.3 m·min-1 for a 10-min period. All these values were recorded during the first quarters of the matches. The 1-min peak running intensity of midfielders during a match was 189.0 ± 11.9 m·min-1 (peak), 126.0 ± 5.6 m·min-1 for a 5-min moving average period, and 98.5 ± 9.5 m·min-1 for a 10-min moving average period. The highest 1-min period was collected during the second quarter, whereas the highest five and ten minute moving average periods occurred in the first quarter. For defenders, the highest 1-min speed was 182. 0 ± 17.9 m·min-1, 122.6 ± 7.7 m·min-1 for a 5-min moving average period, and 99.0 ± 10.1 m·min-1 for a 10-min moving average period. The defenders’ peaks occurred with the same patterns as the midfielders, with the 1-min peak occurring in the second quarter and the highest 5 and 10-min periods during the first quarter. The highest distance covered in a single minute during a field hockey match shows the need for players to have high aerobic and anaerobic capacities. This supports other recent studies which demonstrate that field hockey is a physically demanding sport requiring high physical capabilities (Ihsan et al., 2018; Lythe and Kilding, 2011).
The secondary aim of this study was to investigate how the peak periods changed between quarters and positions. No statistically significant difference was found between the moving average periods for forwards for any quarters apart from between the first and the last quarter where one moderate effect (0.65) occurred, though with a non-significant p value of 0.26, between the first minutes of Q1 and Q4.
For midfielders there were several significant differences. Between Q1 and Q4, there were statistically significant differences between the 3-, 4-, 5-, and 6-min moving average periods; p values were all below 0.001, and effect sizes ranged between 1.44 and 2.02, showing either large or very large effects. This suggests that midfielders were unable to maintain the level of physical output they produced in the previous three quarters. This decrease could ultimately affect the outcome of the game.
Comparing output of defenders, a range of effect sizes was observed, from trivial to moderate, with one moderate (1.13, p = 1.13) and one large effect (1.69, p = 0.01) when comparing Q1 with Q4. These difference occurred in the 4 and 6 min periods, respectively. Since the physical output decreased in the fourth quarter, this could suggest that coaches need to improve physical conditioning so that players can sustain the same level of physical output, and should consider altering tactical variables such as the use of substitutions. Linke and Lames (2016) found that when a substitute came onto the field there was a significant decrease in the total distance covered in the 4th (141.1 ± 35.2 m·min-1) and the 5th min (130.5 ± 37.8 m·min-1) by that player after their arrival. While these results are based on individual minute periods, they are still useful to coaches in planning their substitution methods. This knowledge can support coaches to optimise the timing of their substitutions to both optimise the playing time for their strongest players while also enabling them to recover through the tactical use of substitutions. Through this approach, teams could be able to individualize the amount of physical fatigue which each player incurs whilst out on the field, therefore maximising the overall efficiency of the team’s physical output.
The only statistically significant positional difference in the movement profile was found between forwards and defenders (p = 0.0025). This indicates that the peak positional demands of these two positions are significantly different and suggests that forwards and defenders should be trained at different intensities.
The mixed effect model showed few statistically significant differences between distances covered per minute or in multiple- minute time periods by forwards and midfielders. In the first quarter the 2-min period had a p value of 0.01 and a large effect size of 1.85. When comparing the fourth quarter, there were two consecutive periods with statistically significant significant result of p = 0.03, with effect sizes of 1.31 and 1.39, respectively. These data suggest that forwards and midfielders have differing levels of output during the fourth quarter of a match, but no other time periods. When looking at the performance difference between Q1 and Q4, we found that forwards decreased their performance by 6.6%, while midfielders by 1.5%. This could have a major effect on the outcome of the match because if one positional group is not performing at their full output the team could miss opportunities to be successful in matches.
When breaking the positional comparisons down into the quarters, we can see that there is a significant difference consistently over a 5-min moving average period during the second quarter between forwards and defenders. During this period p values ranged between 0.01 and 0.04, and effect sizes ranged between 1.21 and 1.64. With this being over a 5-min period, we can assume that defenders were fatigued later in the second quarter.
When looking at the differences shown by the mixed effect model over the smaller time periods, it is important to remember that each position has a different role to play in terms of team structure and tactics. Additionally, as there were a large number of tests for statistical significance, there could be some false positive results.
Delves et al. (2019) also looked at moving average periods in elite field hockey. Their study analysed the whole match data, and found 1-min peak periods of 210 ± 15 m·min-1(forwards), 209 ± 19 m·min-1(midfielders), and 199 ± 15 m·min-1(defenders), consistent with the current study. This is in disagreement with another study which found peak physical output of 129 m·min-1for forwards, 137 m·min-1for midfielders and 120 m·min-1for defenders (Polglaze et al., 2015). The difference increase in reported output between the current study and Delves et al. (2019), is potentially due to Delves et al. (2019) using a moving average method to analyse physical output, in contrast to the method of Polglaze et al. (2015) in which the total distance was divided by total match time (minutes played). Additionally, a team’s tactical approach to the game may also influence the physical output of teams. The results of the current study also support Vinson et al. results, the 4 and 5-min periods showed a (2018) who reported finding a difference between midfielders and defenders, but no significant difference between midfielders and forwards. This suggests that there is a position-dependent difference in the running output of players irrespective of sex or match length.
Delaney et al. (2017) found when using the rolling average method with rugby union players that after periods longer than 5-7 min, the peak match running intensity seemed to plateau. This is similar to the findings of the current study (Figure 1). McGuinness et al. (2020) reported a similar finding, with no improvement between the 9 and 10-min rolling averages. It is also consistent with a study conducted on Australia Rules football, which found that as the time spent on the field increased, the running capacity of the players decreased up to 11 min and then plateaued until 17 min (Montgomery and Wisbey, 2016).
Recent studies have suggested that forwards occupy the most demanding position on a hockey field. Ihsan et al. (2018) found that forwards were subjected to the greatest amount of running compared to midfielders and defenders, with defenders undertaking the lowest running load. While the metrics in the current study are different, the trends shown are still comparable, and agree from a physical point of view. The present study found that forwards had the highest 1, 5, and 10-min moving average periods (194.1 ± 24.2, 131.6 ± 17.3, and 105.7 ± 11.3 m·min-1, respectively) compared to midfielders (189.6 ± 11.9, 126 ± 5.6, and 98.5 ± 9.5 m·min-1, respectively) and defenders (182.6 ± 17.9, 122.6 ±7.7, and 99 ± 10.1 m·min-1, respectively). While the defenders did have a slightly higher 10-min output, which is closest to the study by Ihsan et al. (2018), there was no statistically significant difference between midfielders and defenders for a 10-min period (Table 2). Sunderland and Edwards (2017) also found defenders to have greater running loads than midfielders, suggesting a need for further investigation.
Practical Implications
There are three main practical implications from the results of this study: 1) the creation of conditioning drills, 2) substitution patterns, and 3) knowledge to be able to plan and train at or above peak match demands.
Coaches and sport scientists can use these data to create drills which more accurately reflect the match demands over various time periods. These can be tailored to suit a specific team and the part of the team’s periodized plan that the session will be delivered in. This would allow the quantifying of training loads in relation to the demands a player would undergo in their position during a match.
The data also allow coaches and sport scientists to train athletes at a higher intensity than they would experience in a match. This could have positive benefits to matches because athletes would be able to handle match-day demands and more. Furthermore, coaches could use the data to plan training sessions which meet running demands of each position, potentially leading to improved preparation of the teams and positional groups. The data may highlight where a certain player is lacking in terms of physical output during a match, though this would have to be calculated alongside a player’s technical ability.
Coaches could also use the data from this study to optimize their substitution patterns. Since they are able to quantify how players fatigue over a match, they can work to evaluate how they use their substitutes during a match. For example, for midfielders we can see that between Q1 and Q4 there is a large statistical difference in output for three consecutive periods, which could indicate that it could be beneficial for a coach to substitute their midfielders more often to maintain a higher intensity of those players. It could also indicate that coaches should have different substitution patterns for different quarters in the match.
The current study only reports the running components of field hockey. It does not include or attempt to quantify the technical or tactical metrics for the team, or the skill level of the opposition, which could influence the players’ movement demands during a match.