Introduction
In recent years, with the decrease in free play, an annual increase in the number of children and adolescents who participate in organized sports has been observed (Logan et al., 2019). Participation in sports can help children develop sport-specific skills, foster the development of other life skills, and confer beneficial effects on health-related measures later in life (Kontos, 2016; Sallis and Patrick, 2016; Van Langendonck et al., 2003).
Swimming is a sport for which training begins at very young ages (6-9 years old) (Bompa, 2000). To achieve a high level of performance in competition, swim training often focuses on a high distance training volume (Aspenes and Karlsen, 2012). However, high-volume, intense training when a child does not have sufficient physical and muscular strength to bear the training load can lead to consequences such as an increased risk of overuse injuries, burnout, abandonment of the modality, and impairment of normal growth (DiFiori et al., 2014; Micheli, 1983).
Puberty is an important period of transition from childhood to adulthood that is characterized by maturation of reproductive function, as well as anatomical and physiological changes throughout the body, such as the appearance of secondary sexual characteristics (Chipkevitch, 2001).
Understanding the whole process of puberty is essential for understanding the expected physiological responses to exercise across the stages of an individual's biological development. Children do not all develop at the same rate (Lloyd et al., 2014). Children who experience earlier sexual maturity tend to have better athletic performance than those who mature later (Macêdo and Filho, 2003). This considerable variability in biological development among individuals of the same chronological age raises questions about the most appropriate strategies to assign young athletes to categories of sports training and competitions during their youth.
Traditionally, categories of training during childhood and youth are divided by age group, with a new category usually every one or two years, which does not consider individuals’ pubertal status. Considering that athletic performance, including muscle development, is influenced by pubertal status, this chronological division may not be the most adequate strategy (Linhares et al., 2009). Therefore, submitting all children and adolescents to the same training volume and load can cause physical damage to the least developed individuals, may not produce the desired training adaptations (Nevill et al., 1998), and may discourage sports participation by children in early pubertal stages. Therefore, evaluation of the physiological variables related to physical fitness, such as muscle strength and body composition, may reveal important differences between children and adolescents of the same chronological age.
Therefore, the objective of the present study was to compare the evolution of knee extensor muscle strength and muscle mass among swimmers of both sexes of different chronological (10 to 20 years old) and biological ages. Knowledge of how strength and muscle mass evolve across biological and chronological ages in young swimmers may contribute to a training scheme and therefore lead to improved health and performance. To the best of the authors’ knowledge, this is the first study to investigate this topic in young swimmers. The hypothesis of the present study was that grouping children and adolescents for training in swimming by biological age may be more appropriate than grouping them by chronological age when aiming to equalize levels of muscle strength development.
Methods
Participants
Seventy-six young swimmers (55 males and 21 females) aged between 10 to 20 years old from the Olympic Training and Research Centre in São Paulo, Brazil participated in the study. The age, total body mass, height, fat free mass, and fat mass of males were 13.3 ± 2.6 years, 51.9 ± 14.8 kg, 161.1 ± 13.6 cm, 41.5 ± 12.8 kg, and 16.7 ± 7.3 kg, respectively, and the values for females were 13.3 ± 2.4 years, 48.5 ± 9.8 kg, 157.2 ± 7.3 cm, 31.8 ± 7.8 kg, and 27.3 ± 13.0 kg.
Athletes were recruited between January and July 2017. They were excluded if they used hormones or any drug treatment, presented a previous injury (over the previous 12 months), or had a history of surgery on the lower extremities or knee pain. The inclusion criteria were participation in swimming for at least 1 year and training at least 5 days per week. Athletes and guardians were informed of the potential risks and benefits of the study and signed an informed consent form to participate in this study. All experimental procedures were approved by the University Human Research Ethics Committee and conformed to the principles outlined in the Declaration of Helsinki.
Measures
Evaluation of sexual maturity
Based on the criteria defined by Tanner (1981), the clinical evaluations of all volunteers were performed by a single pediatrician who evaluated the development of pubic hair (P1, P2, P3, P4 and P5) in both sexes and the quantity and distribution of secondary sexual characteristics according to the developmental stage of the genitals in males (G1, G2, G3, G4 and G5) and breast development in females (M1, M2, M3, M4 and M5), which were evaluated for size, shape and characteristics. Stage 1 always corresponds to the prepubertal stage, and stage 5 corresponds to the postpubertal stage. Therefore, stages 2, 3 and 4 characterize the pubertal period.
Assessment of body composition
Body composition was assessed via dualenergy X-ray absorptiometry (DXA) (software version 12.3, Lunar DPX, Madison, WI), which has previously been demonstrated to be a reliable method (Colyer et al., 2016). Total body mass and lean muscle mass were expressed in kilograms (kg), and fat mass was expressed as a percentage (%).
Evaluation of muscular performance
We used isokinetic evaluation because it is an objective and reproducible method of evaluation strength, also in children (Carvalho et al., 2011; Terreri et al., 2001). Before isokinetic testing, participants performed a 5-min warm-up on a cycle ergometer (Cybex Inc., Ronkonkoma, NY, USA) at a resistance of 25 Watts, followed by low-intensity dynamic stretching exercises to avoid the influence of stretching on strength evaluations (Mascarin et al., 2015).
Lower limb dominance was determined by asking participants which limb they preferred to use when kicking a ball. The isokinetic strength test was performed for the dominant lower limb. Participants assumed a seated position on the isokinetic dynamometer (Biodex Medical Systems Inc., Shirley, NY, USA) with their hips flexed at approximately 85 degrees, and standard stabilization straps were placed around the trunk, waist and distal femur of the dominant limb to minimize additional movement and ensure the same conditions for all participants. The axis of the dynamometer was visually aligned with the lateral femoral condyle while the knees were flexed at 90 degrees. The resistance pad was placed 1 cm above the medial malleolus. Gravity correction procedures were applied according to the manufacturer’s specifications to minimize the risk of inaccurate data. The knee was tested from 5 to 95 degrees of knee flexion, with full knee extension defined as 0 degree, as previously described.
For familiarization, participants were given standard verbal instructions and allowed 5 submaximal practice attempts (50 to 70% of their maximal effort). Participants then performed a maximum of five repetitions at an angular speed of 60 0/s and the peak torque (Nm) results were stored for analysis. This angular speed was selected as the lowest speed to avoid high joint pressure while producing the highest torque values.
The same verbal encouragement was given to each individual throughout the test, and feedback from the computer screen was not permitted (Vargas et al., 2019). The same examiner, who was trained and experienced in the use of isokinetic testing devices, evaluated all participants. The variable of interest was concentric peak torque (Nm).
Design and Procedures
A cross-sectional study was performed. Physical assessments were conducted over 2 days and were separated by 1 week between each visit. Participants continued their regular training program, but were asked to refrain from strenuous workouts on the day before the second visit. Sexual maturity was evaluated during the first visit using the Tanner scale. During the second visit, the isokinetic strength test for extensor knee muscles and muscle mass evaluations were performed.
Statistical analysis
Statistical analyses were performed using Statistica (Statsoft, Inc., version 6.0 for Windows). The data were expressed as the mean ± standard deviation (SD). All variables had a normal distribution according to the Kolmogorov-Smirnov test and exhibited homogeneous variability on the Levene test. To verify the effects of age or Tanner stage and sex on body composition and isokinetic strength values, a two-way ANOVA was performed, which was supplemented by the Newman-Keuls post hoc test when the threshold of significance was reached. In the absence of interactions, only main effects were analyzed. The level of significance was set at 0.05.
Results
Sexual maturation levels according to Tanner's classification, which were evaluated at each chronological age, are shown in Table 1.
Table 1
Tanner Classification According to Age
Strength × age
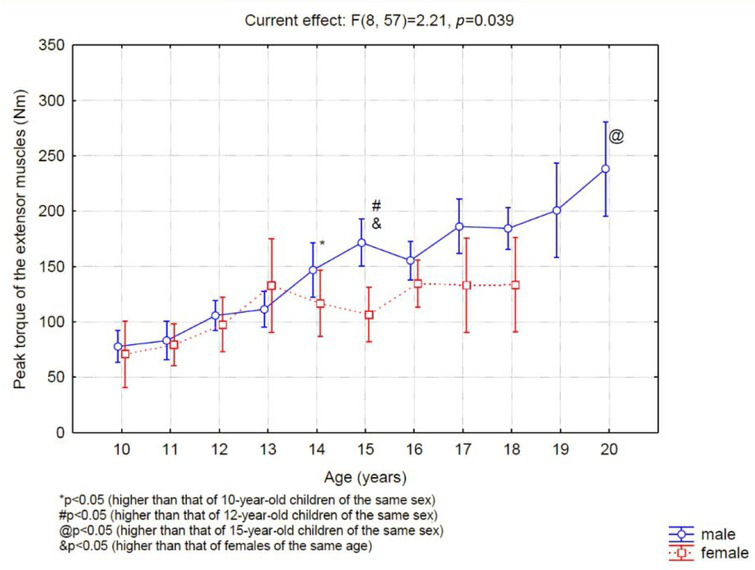
The extensor muscles (Figure 1) of the boys' knees did not show strength variations between 10 and 13 years of age; however, 14-yearold boys presented significantly higher strength values than boys of 10 years of age. After this age, strength continued to increase progressively over time such that the force of the extensors at age 20 was greater than that at age of 15. Regarding the strength of the thigh muscles of female swimmers, no differences in the muscle strength of the extensor muscles were found among the ages assessed. In the comparison between sexes, a significant difference was found in the strength after 15 years of age.
Strength × sexual maturation
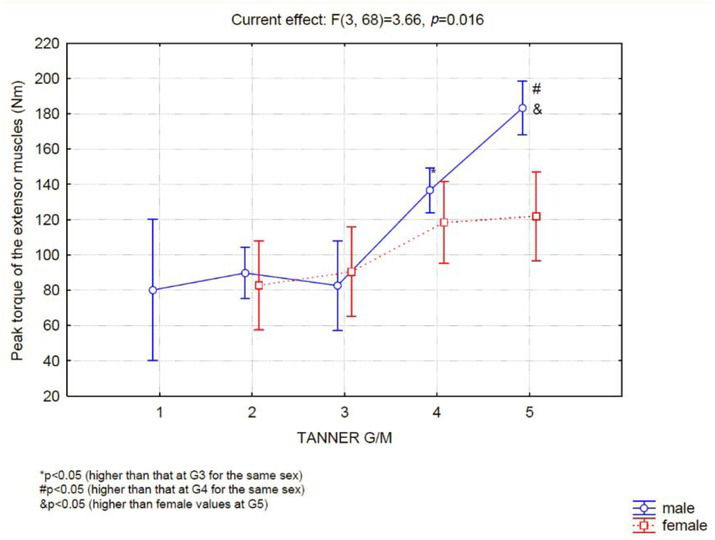
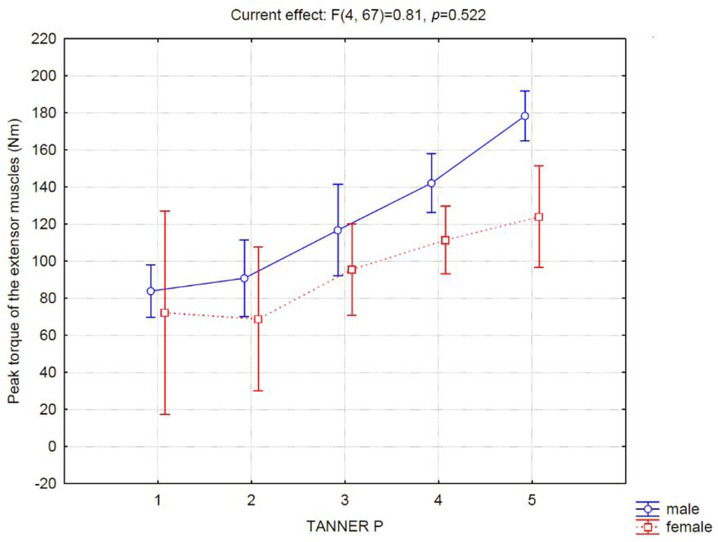
In boys, up to the classification level G3, no difference in strength was observed (Figure 2). However, G3 boys were significantly weaker than G4 boys, and G4 boys were significantly weaker than G5 boys (Figure 2). Girls showed no difference in muscle strength between any of the Tanner classification levels assessed. Therefore, a significant difference in performance between genders at the G5-M5 classification level was identified. When we evaluated muscle performance according to Tanner's classification for pubic hair, we did not observe differences between the sexes (Figure 3).
Lean mass
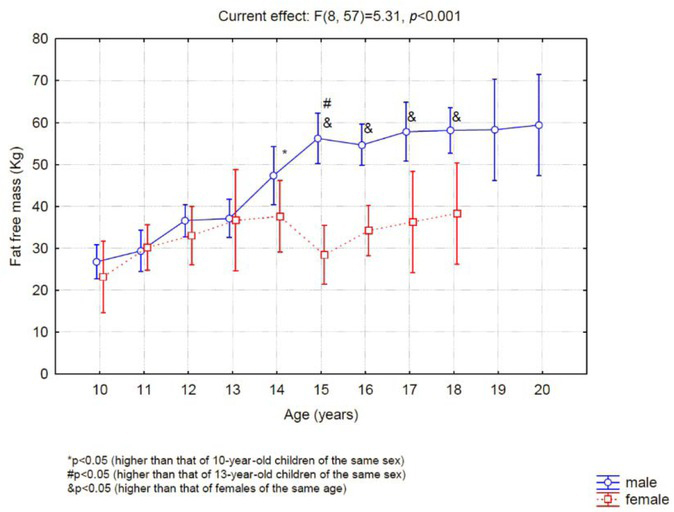
The 14-year-old boys had significantly greater lean mass than the 10-year-old boys (Figure 4), and the 15-year-old boys had greater lean mass than the 13-year-old boys. Girls exhibited no difference in lean mass between the evaluated ages, and after 15 years of age, a significant difference was observed between the sexes (Figure 4).
Lean mass was greater at G4 versus G3 and greater at G5 versus G4 (Figure 5). However, the girls showed no difference in lean mass between M1 and M5.
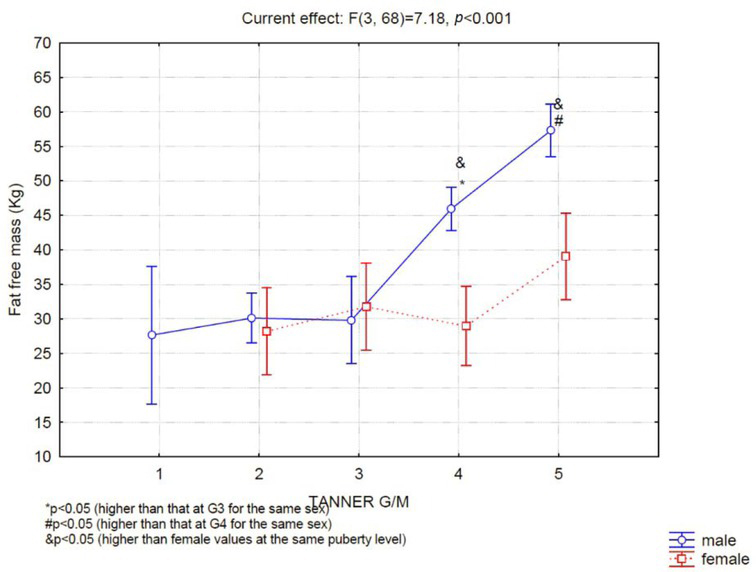
The difference in lean mass became significant between the sexes after the G4-M4 stage.
Discussion
The main finding of the present study was that boys' muscle strength and mass increased significantly from the G3 to the G4 level, which occurs on the average at the age of 14 years, although boys may reach this level of sexual development as early as when 12 years of age. Between G1, G2 and G3, no change in muscle strength was observed in boys. On the other hand, in girls, no difference in strength performance was observed between chronological nor biological ages.
The increase in muscle strength coinciding with the increase in boys' muscle mass was expected, since longitudinal studies have indicated that increased muscle size is one of the main factors responsible for improving strength during puberty (Philippou et al., 2007).
From puberty, the marked gain of muscle mass and strength in males is certainly influenced by the maturity of the neuroendocrine system (Round et al., 1999). In 1998, Nevill et al. (1998) demonstrated an increase in strength among adolescents from 8 to 17 years old associated with body height and body mass increases; they also observed an additional factor independent of age i.e., the amount of circulating testosterone (Round et al., 1999). Testosterone in men promotes the development of sexual function and somatic characteristics. This hormone may stimulate the anabolic effect of the insulin-like growth factor 1 (IGF1) on muscle cells as well as facilitate neuromuscular transmission and thus improve cognitive effects (Bhasin et al., 2001). Evidence also indicates that changes in the muscle metabolism occur during puberty. Studies using muscle biopsies have shown that the resting muscle ATP concentration does not vary during puberty, but the concentrations of phosphocreatine (PCr) and glycogen increases with age, which also may be evidenced by the increase in muscle lactate accumulation with exercise and a greater oxidative capacity pre puberty (Bergeron et al., 2015; Tonson et al., 2010).
Regarding the development of muscle strength and the characteristics of pubic hair development, no differences between the sexes were observed. This observation is justifiable because the appearance of pubertal hairs is related to the production of adrenal androgens unrelated to the maturation of the hypothalamic-pituitary-gonadal axis and therefore, the production of gonadal hormones (Soliman et al., 2014).
When analyzing the increase in strength across chronological ages, the greatest increase in strength was found to occur from 13 to 14 years of age in boys. In fact, at 14 years of age, all boys were in the G4 developmental stage, justifying grouping of the boys by chronological age for training since they were all in the same stage of puberty and therefore, the same stage of muscle strength development, allowing them to compete and train at similar levels. However, we observed that at 13 years of age, the mean stage of development of the genitalia was 2.6 ± 1.0, ranging from 2 to 4, indicating that at 13 years of age, some boys (G2) had not yet reached a level of muscle strength development similar to that of individuals of the same chronological age (13 years old) who were already in the G4 stage and had therefore passed the peak rate of increasing muscle strength development. This situation is even more diverse at 12 years of age since at this age, boys had a mean stage of development of the genitalia of 3.3 ± 1.2, ranging from 1 to 5. Thus, grouping individuals by chronological age before the age of 13 years does not seem to be an appropriate strategy. This reflection suggests that individual analyses may benefit sports training programs. Therefore, considering chronological age and assessing pubertal status are both important, although we realize that this strategy is not easy to implement (Bergeron et al., 2015; Lloyd et al., 2014). Considering the pubertal status is also important to prevent the lack of motivation and consequent sports drop out or the common exclusion of the later maturing boys (Figueiredo et al., 2009; Malina et al., 2004).
Kiatsopit et al. (2015) report that a14-yearold boys (in mean) presented G4-P4 pubertal staging. The results of the present study corroborate these findings as boys also presented G4-P4 staging at 14 years of age, indicating the swim training in which the study volunteers were involved did not affect pubertal development.
The typical muscle mass in the body of a 10-year-old boy is 28.5 ± 4.2 kg (Ronque et al., 2007). In the present study, the mean muscle mass of 10-year-old boys was 26.8 ± 2.8 kg. These data corroborate reports in the literature indicating that physical activity in prepubertal individuals does not promote muscle mass increases even though the athletes’ training volume is high (10 hours of training per week) and similar to some reports in the literature regarding youth athletes (6-18 hours per week) (Bergeron et al., 2015; DiFiori et al., 2014).
Before puberty, muscle mass increases linearly with age (McMurray, 1996). The impetus for physical growth in this phase is the anabolic effect of growth hormone (GH) and IGF1 (Philippou et al., 2007). However, at this stage of development, strength gains seem to be more associated with neural factors than with increased muscle mass (Ozmun and Mikesky, 1994). Considering that boys reach G4 (a higher rate of muscle mass development) at the age of 14 on average, we compared muscle mass between boys of 10 and 13 years of age. However, the results of the present study showed no significant difference in muscle mass between 10- (26.7 ± 2.7 kg) and 13-year-old (37.1 ± 9.1 kg) boys. The different levels of sexual maturation observed in boys aged 10 and 13 years (69% of the sample was categorized as G1, G2 or G3, and 31% of the sample was categorized as G4 or G5) may have complicated this type of analysis since boys were very different from each other, and the standard deviation of muscle mass measurements was very large.
Unlike boys, girls’ muscle strength was not different between the chronological or biological ages evaluated. These findings were expected since different hormonal and genetic mechanisms are responsible for sexual maturation in girls. The development of female sexual characteristics is strongly influenced by the action of the sex hormone i.e., estrogen, which directly influences fat accumulation, in contrast to male sexual characteristics, of which development is most affected by the action of testosterone, which causes an increased rate of muscle growth (Malina and Bouchard, 1992). Therefore, a greater effect of puberty on boys’ versus girls’ muscle strength was expected. Another finding corroborating this result is that muscle strength was not different between boys and girls before the age of 13 years. Therefore, delineating training and competition categories according to chronological age does not seem to be problematic for girls as it is for boys.
Besides muscular strength there are several other factors that affect sports performance such as agility, speed, flexibility and endurance. It has been previously shown that these physical abilities are amenable to improvement in pre-pubertal athletes (Erceg et al., 2008). Therefore, focusing on other physical abilities in pre-pubertal athletes may be more beneficial. In addition, it is important to consider the maturation of central neurological factors as they play an important role in improving motor performance during the child's development.
Considering aerobic endurance, puberty influences the improvement of aerobic fitness by increasing body size, especially due to dimensions of the heart, lungs, muscles and circulatory system (McMurray, 1996). The maximum rate of oxygen uptake relative to body mass enhances in boys after puberty because of the higher fat free mass percentage and declines in girls due to fat accumulation among the pubertal stages. Moreover, it has been demonstrated that youth athletes with a higher testosterone level developed significantly greater aerobic endurance levels (Erceg et al., 2008). The significant improvement in aerobic capacity and strength after puberty reinforces the idea that pre-puberty physical training may be beneficial if it can be more focused on other physical capacities, such as coordination abilities.
Another interesting finding was that the mean age at which girls reached M4-P4 staging was 13 years (one year before boys), which is consistent with data in the literature showing that puberty begins earlier in females (Soliman et al., 2014). Participation in some sports is associated with delayed sexual maturation in girls. Studies of gymnasts show that the average age of menarche, which usually occurs when a girl reaches M4, is 14.5 years. However, swimmers in the present study did not show differences in the age of menarche compared to those found in other studies (McMurray, 1996). Girls who practice sports in which body mass must be strictly controlled and a low body fat percentage is highly valued (gymnastics) may suffer greater consequences of physical activity on sexual development.
Some limitations of this should be noted. First, this was a cross-sectional study; for a better understanding of how muscle mass and strength evolve with age, longitudinal studies should be performed. No analysis was performed to verify blood levels of sex hormones, which may help determine the level of development of athletes. Finally, the number of individuals per age group was small. In conclusion, boys experience significant gains of muscle mass and strength when they reach the G4 pubertal stage, which corresponds to 14 years of age on the average. However, between 12 and 13 years of age, boys are classified as G2, G3, G4 and G5, indicating that some boys have yet to reach the peak rate of increasing muscle strength while others have passed this benchmark. We conclude that the level of pubertal development associated with the chronological age of boys can facilitate better grouping of individuals for physical training compared to chronological classification alone. In girls, chronological age grouping seems appropriate.