Introduction
Sprint speed is a key factor in the development and performance of a variety of individual and team sports (Alcaraz et al., 2018). Moreover, the ability to quickly accelerate is a critical aspect of sports success (Healy et al., 2016).
Rugby is an intermittent sport that involves contact situations in which speed, agility and endurance performance could make players outmatch the rest (Darrall-Jones et al., 2016; Smart et al., 2014; Suárez-Arrones et al., 2012). Those players who excel in speed will have a greater ability to gain the defense line, break tackles, evade defenders and score tries more frequently, as mentioned by Smart et al. (2014). Playing positions in rugby are divided into two groups or sub-units, generally named as forwards and backs (Duthie et al., 2003). The first ones have larger body mass, sprint momentum (SM) and lower speed compared to backs who also take part in more open game situations (Darrall-Jones et al., 2016; Duthie et al., 2003; Nakamura et al., 2016). Forwards end up spending more time in this type of efforts during rucks, mauls and tackles compared to backs, but the latter ones cover longer distances at sprint speed (Darall-Jones et al., 2016). Other authors (Austin et al., 2011; Reardon et al., 2015) showed that there were no differences in the distances covered at sprint speed between forwards and backs, although Austin et al. (2011) mentioned that forwards performed shorter sprints on the average compared to backs. According to Gabbett (2012) accelerations in rugby are ten times more frequent than maximum sprint speed (MSS), and there are very few occasions in which players are able to run carrying the ball for more than ~5 s without being tackled or blocked. Backs normally perform a higher number of accelerations than forwards though the latter are the ones who, due to their function in the team, have the greater number of impacts of different intensity per game (Quarrie et al., 2013; Suárez-Arrones et al., 2012).
In rugby, contact actions are key aspects, and therefore sprint momentum is one of the most relevant factors for sporting success (Baker and Newton, 2008). According to Baker and Newton (2008) SM is the product of body mass and sprint speed (in the initial 10 m), since it is a distance that players usually perform during games. According to Barr et al. (2014), the SM reached in the 30-40 m interval is different to the initial SM reached in the 0-10 m interval. Players with the ability to reach high sprint speeds and high levels of acceleration, are the ones who will be able to prevail in contact situations and give the necessary impulse to their teams to advance the ball towards the opponents’ goal, something necessary and demanded by the coaches of modern rugby (Baker and Newton, 2008).
Regarding the development of acceleration and MSS according to age, sprints are key movements and are considered as a part of the basic structure of the majority of sports (Meyers et al., 2015). MSS develops in younger players as they grow up due to an interaction between stride length and frequency, as both are related to changes occurring at that age (modifications in body size and peak height velocity), as stated by Meyers et al. (2015). With regard to anthropometric characteristics, Pienaar and Coetzee (2013) indicate that they play an important role in rugby players’ performance and influence their playing positions.
In order to improve sprint performance, specific training methods produce better results compared to general training (Rumpf et al., 2016), but we must ensure the use of a given distance for it to be successful. A review by Simperingham et al. (2016) shows that MSS is rarely reached by team sport athletes and that assessment of speed should focus on the acceleration phase in the initial 20 m. A need to establish the distance required to reach MSS in soccer players according to age categories has been noticed (Buchheit et al., 2012). Those authors conclude that at a younger age, a greater percentage of players reach MSS in the 10-20 m interval, while older players require a greater distance to reach MSS (Buchheit et al., 2012). Training programs should be individualized regarding age and playing positions, and in turn this would allow practitioners and coaches to adapt the specific distances needed for sprint speed assessment in rugby players.
In the analysed protocols this distance varies between 20 and 60 m depending on the author and sport (Buchheit et al., 2012; Darrall-Jones et al., 2015; Darrall-Jones et al., 2016; Duthie et al., 2006; Green et al., 2011). In this regard, and after reviewing the scientific literature, to the best of our knowledge, there is no consensus in rugby on the distance needed to reach MSS in rugby players throughout their development, and also there is no consensus about the optimal distance for sprint speed assessment. Therefore, the aims of this study were to: i) determine the distance needed to reach MSS in rugby according to age categories and the playing position; ii) establish the optimal distance for the assessment of sprint speed and to compare the differences in anthropometrics, sprint and sprint momentum according to age categories and playing positions.
Methods
Participants
Three hundred amateur male rugby players volunteered to participate in this study. All participants were members of different clubs and age categories of regional and national federations. The age groups were selected following the rules of the rugby federation, as follows: U14 (n = 91; age: 12.69 ± 0.55); U16 (n = 85; age: 14.82 ± 0.53), U18 (n = 75; age: 16.67 ± 0.52) and Seniors (n = 49; age: 24.16 ± 4.08). All players had an average of ~4.5 hours of rugby specific training and one competitive game per week, independently of age categories. All players had at least one year of playing experience at the club level. As for Senior players, part of them played at the highest national level (n = 22) and the rest (n = 27) participated in regional competitions, although all of them played at an amateur level. The study met the ethical standards and was approved by an Institutional Research Ethics Committee and conformed to the recommendations of the Declaration of Helsinki. After being informed of the purpose and experimental procedures, athletes signed a written informed consent form prior to participation.
Study design and procedures
A descriptive study design was used, since only data of participants were collected in one specific time point. Athletes performed two 50 m sprints on a rugby pitch (natural turf), with four minutes of recovery between each trial to avoid fatigue. Both trials were performed on the same day. Photoelectric cells (Microgate Witty System, Bolzano, Italy) were placed at the beginning and at 10, 20, 30, 40 and 50 m. Participants were encouraged to run the 50 m as quickly as possible. These distances were chosen to enable assessment of initial and maximal sprint capabilities as used by Barr et al. (2014). The best time over 50 m was considered for the subsequent analysis. All tests were performed outdoors on astro-turf fields under dry weather conditions. The test started from a standing position, placing the front foot just behind the line, 0.5 m away from the first timing gate. A mark was placed five meters past the finish line and players were encouraged not to slow down until they have passed it, to ensure that they maintained maximum speed until the end of the test. The warm-up protocol consisted of twenty minutes of joint mobility exercises, light jogging, progressive runs, changes of directions and finished with sprint progressions from 5 to 40 m. Participants were asked to avoid exercise on the day prior to testing and not to consume their last meal within 3 hours before the scheduled test time. Times (s) for each interval were named as follows: 10-20 m interval (T10-20m), 20-30 m interval (T20-30m), 30-40 m interval (T30-40m) and 40-50 m interval (T40-50m). Split time records accumulated from one interval to the next one: 0-10 m interval (T10m), 0-20 m interval (T20m), 0-30 m interval (T30m), 0-40 m interval (T40m), 0-50 m interval (T50m). The MSS was calculated from the distance of an interval (10 m) divided by the fastest split time record and then used to obtain SM. The maximal SM was obtained multiplying the MSS by the player’s body mass and initial SM was obtained multiplying the speed of the 0-10 m interval by the players’ body mass (Barr et al., 2014; Darrall-Jones et al., 2016). The Intraclass Correlation Coefficient (ICC) and the Coefficient of variation (CV) of T10m, T20m, T30m, T40m and T50m were: 0.95 and 2.43%; 0.97 and 2.19%; 0.98 and 1.93%; 0.98 and 1.9%; 0.98 and 2.26%, respectively.
Statistical analysis
All data are presented as mean ± SD for each age group (U14, U16, U18 and Senior) and by playing position (forwards and backs). Chi-Square Statistics were used to establish the interval at which maximum speed was reached according to each age category and position. The Student’s t- test was used to analyse differences in time records of each interval and effect size (ES) was established according to ‘d’ Cohens effect and expressed with a confidence interval of 95%. These tests were performed using STATA v14 (StataCorp LLC) statistics software. To establish differences in performance of the measured variables, data were analysed using the method of magnitudes based on inferences (Hopkins et al., 2009). The differences between age groups and playing positions were established based on ‘d’ Cohen effect size, with a confidence interval of 90%. The criteria used for the interpretation of the ES were defined as trivial (0-0.19), small (0.2-0.59), moderate (0.6-1.1), large (1.2-1.9) and very large (> 2.0) (Batterham and Hopkins, 2006). The qualitative assessment was performed according to the following thresholds: <75%, not clear; 7595%, likely; 95-99%, very likely; >99%, almost certainly. The ICC and CV were calculated for the two sprints performed, to transmit the reliability of the test. The level of significance was set at p ≤ 0.05.
Results
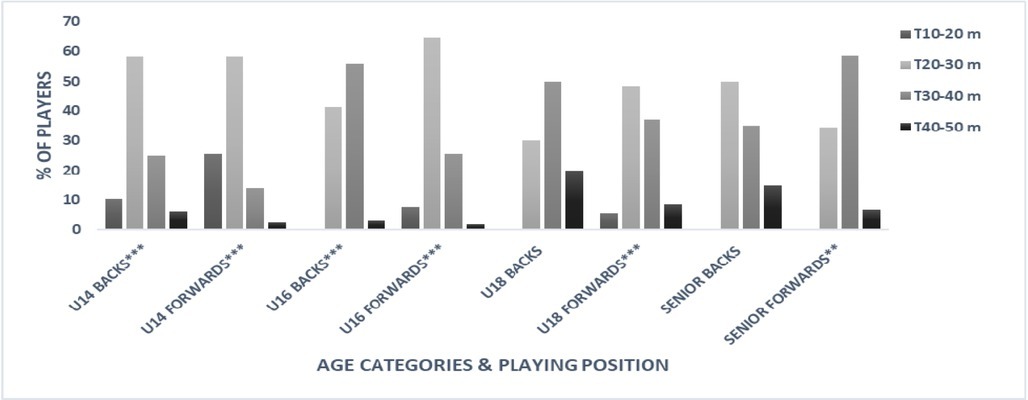
Regarding the fastest interval in which athletes of each age category and playing position reached MSS (Figure 1), U14 (backs and forwards) and U16 (forwards) (58.3%, 58.1% and 64.7%, respectively) reached their MSS in the T20-30m interval, and among U16 (Backs), 55.9% in the T30-40m interval. In U18 the majority of backs (50%) reached their MSS in the T30-40m interval, and 48.6% of forwards reached MSS in the T20-30m interval. Finally, Senior backs had the higher percentage of players (50%) reaching MSS in the T20-30m interval, whereas 58.6% of forwards reached it in the T30-40m interval.
Figure 1
Fastest 10 m interval distribution according to the age category and playing position in rugby players.
**Significant within age group X2value with p < 0.01;
***Significant within-age group X2value with p < 0.001.
Descriptive data regarding the individual time record for each interval according to age categories and playing positions are shown in Table 1. Comparisons between each 10 m interval (e.g. T10-20m vs. T20-30m) are shown in Table 2. Results indicate that for U14 backs and forwards, and U16 forwards, statistically significant differences existed between intervals from 10 to 50 m (ES between trivial and small; p ˂ 0.001). In U16 backs, U18 and Senior forwards comparisons showed that differences existed in all of the intervals, except for T20-30m vs. T30-40m (ES trivial; p ˃ 0.05). In contrast, U18 and Senior backs showed no significant differences in T20-30m and T30-40m intervals (ES trivial; p ˃ 0.05).
Table 1
Time (s) for each 10 m interval by age categories and playing position.
[i] *Data are presented as mean (± SD). F: Forwards; B: Backs; U14: under 14’s; U16: under 16’s;
U18: under 18’s; *T10-20: 10 m sprint time (s) in the interval 10-20m;
*T20-30: 10 m sprint time (s) in the interval 20-30m;
*T30-40= 10 m sprint time (s) in the interval 30-40m;
*T40-50: 10 m sprint time (s) in the interval 40-50m.
Table 2
Comparisons between times of each 10 m interval for 50 m sprint within age categories and playing position
[i] *Data are presented as mean (±SD). F: Forwards; B: Backs; U14: under 14’s; U16: under 16’s; U18: under 18’s; *T10-20: 10 m sprint time (s) in the interval 10-20m; *T20-30: 10 m sprint time (s) in the interval 20-30m; *T30-40= 10 m sprint time (s) in the interval 30-40m; *T40-50: 10 m sprint time (s) in the interval 40-50m. ***ES: effect size Cohen’s d. CI: confidence interval.
Table 3 displays descriptive results for all measured variables. Between-group differences in the comparisons of anthropometric variables, sprint performance and sprint momentum in backs are presented in Table 4. Statistically significant differences were found between U14 and the rest of age categories in all measured variables (ES large and very large). Between U16 and U18 small differences were observed in height, T10m, T20m and T30m (ES = -0.20-0.55). Regarding body mass, T40m, T50m and initial SM differences were deemed moderate (ES = -0.651.05). Finally, U16 and U18 showed very large differences in SM (ES = 1.27). U16 and Seniors demonstrated small differences in T10m, T20m, and moderate for height, T30m, T40m, T50m and MSS. Regarding body mass, SM and initial SM very large differences were found between U16 vs. Seniors (ES = 1.93-2.17). Comparisons between U18 and Seniors, trivial differences were observed in sprint times for all intervals, and small differences in height. Regarding body mass, SM and initial SM moderate differences were observed (ES = 0.9-1.01). Between-group differences in the comparisons of anthropometric variables, sprint performance and sprint momentum in forwards are presented in Table 5. Statistically significant differences were observed between U14 and the rest of age categories in all the variables (ES between large and very large). Small to moderate differences were observed between U16 and U18 in T20m, T30m, T40m, T50m and MSS (ES = 0.310.71). Regarding body mass, T10m and initial SM, no significant differences were observed (ES trivial; p > 0.05). Small differences between U16 and Seniors were observed in height and sprint times in all intervals (ES = 0.24-0.55). Statistically significant differences were reported for body mass and MSS (ES = 0.68-0.86), and large differences were observed for initial SM and SM. Between U18 and Seniors small differences were observed in T10m (ES = -0.23). Regarding height, T20m, T30m, T40m, T50m and MSS differences were deemed unclear (ES trivial). Finally, differences in body mass, initial SM and SM were between moderate and large (ES = 0.95-1.25).
Table 3
Anthropometric characteristics, 50 m linear sprint times, maximum sprint speed and sprint momentum according to playing position and age categories.
Table 4
Between-age category comparisons for anthropometric characteristics, 50 m linear sprint times, maximum sprint speed and sprint momentum for backs.
[i] †Data are presented as mean (±SD) and Cohen’s d effect size (90% confidence intervals [CIs]) and qualitative outcome of the effect based on Hopkins’ criteria. *MMS= maximum sprint speed; SMinitial = initial sprint momentum; SMmax = maximum sprint momentum; T10m: 10 m sprint time (s); T20m: 20 m sprint time (s); T30m: 30 m sprint time (s); T40m: 40 m sprint time (s); T50m: 50 m sprint time (s). *** p < 0.001, ** p < 0.01, * p < 0.05.
Table 5
Between-age category comparisons for anthropometric characteristics, 50 m linear sprint times, maximum sprint speed and sprint momentum for forwards.
[i] †Data are presented as mean (±SD) and Cohen’s d effect size (90% confidence intervals [CIs]) and qualitative outcome of the effect based on Hopkins’ criteria. *MMS= maximum sprint speed; SMinitial = initial sprint momentum; SMmax = maximum sprint momentum; T10m: 10 m sprint time (s); T20m: 20 m sprint time (s); T30m: 30 m sprint time (s); T40m: 40 m sprint time (s); T50m: 50 m sprint time (s). *** p < 0.001, ** p < 0.01, * p < 0.05.
Discussion
The aim of the present study was to establish in which interval a rugby player attains MSS in a 50 m sprint according to the age category and playing position. The main findings of the present study were: i) the younger the players, there was a higher percentage of athletes reaching their MSS earlier, and the older the players, the greater the maximum speed and also the greater distance needed to reach it; ii) a novel finding was that regardless of the age category and playing position, the optimum distance for sprint assessment would be 30 m; iii) finally, in relation to the age and playing position we observed similar results as in previous research (Darrall-Jones et al., 2015; Darrall-Jones et al., 2016), where older players differed mainly by having higher body mass, MSS (except for U18 vs. Senior) and maximal SM values in contrast to younger players, especially U14.
Regarding positional differences between forwards and backs of the same age categories, in U14 and U16 (Figure 1), most of the forwards reached their MSS in the T20-30m interval, but there was an important number of players that reached it in the T10-20m interval (25.6% and 7.8%, respectively), others in T30-40m (14% and 25.5%) and even ~2% of players reached it in the T40-50m interval. A similar outcome was observed for U14 backs though this was not valid for U16 as we observed that adding T20-30m and T30-40m, 97.1% of players reached MSS between the 20-40 m interval, and for U14 backs, only 83.3%. Regarding the variability that exists in the distance needed to reach their MSS, in U14 and U16 (forwards), this could be related to the inter-individual differences within the same chronological age groups. According to Mendez-Villanueva et al. (2011) age-related differences are almost completely responsible for the differences in maturation. Meyers et al. (2017) affirm that in athletes who are in the previous stage of peak height velocity, their body mass has a negative impact on speed. Therefore, it is important to highlight that this could be the reason of the variability that exists in the distance needed to reach MSS in U14 and U16 (forwards) age categories. These results coincide in part with Buchheit et al. (2012), as they show similar data for U14 and younger players, but they differ in the U16 category since they indicate that athletes reach their MSS in the T30-40m interval. Therefore, our findings suggest that specially for U14 rugby players, sprint speed development and assessment should be done consistently around (or prior to) this age and this information could be used as a complement of the peak height velocity to monitor maturity status in a long term development process.
Regarding U18 backs and Seniors (Figure 1), a high percentage of players (>80%) reached their MSS between T20-30 m and T30-40 m intervals since, as previously mentioned, they had higher values of velocity and lower body mass compared to forwards (Darrall-Jones et al., 2016), which means they needed a greater distance to reach MSS. In addition, in U16, U18 and Senior forwards (Figure 1), a high percentage of players (>85%) reached their MSS also between T20-30m and T30-40m intervals. These results coincide with those provided by Barr et al. (2013), who observed that rugby players reached their MSS in the T30-40m interval, although they used a very small sample (n = 11) and all variables were estimated using video analysis, which makes it difficult to establish a direct comparison. Also, Buchheit et al. (2012) in a report with youth soccer players obtained similar results to our study, reporting that U16 and U18 players reached MSS in the T30-40m interval.
A novel finding of the present study is that, if we perform a comparative analysis regarding the time of each 10 m interval with each other, the results suggests that 30 m could be a sufficient distance for the assessment of sprint speed regardless of the age category and playing position. Results in Table 1 show how sprint times change as the distance increases without taking into account the acceleration phase. Regarding sprint times comparisons (Table 2), U14 backs and forwards obtained the lowest times in the T20-30m interval with trivial differences (p < 0.05) comparing the interval with the preceding and the following one. A similar outcome was observed with respect to U16 forwards, and in turn this could suggest that the optimal distance for MSS assessment in these age categories would be no more than 30 m. These results are in line with Darrall-Jones et al. (2015) who pointed out that younger players (U14 and U16 forwards in our case) reached MSS sooner and that they were unable to sustain that speed in distances over T20-30m intervals, while older players (U16 backs, U18 and Seniors) could reach higher MSS and maintain the speed rate for a longer time, which also suggests greater endurance to velocity loss. Regarding the latter, it is worth mentioning that comparisons showed no differences between T20-30m and T30-40m intervals among U16 backs, as well as U18 and Senior forwards. In addition, in U18 and Senior backs, no difference was found in the T20-30m vs. T30-40m interval (ES trivial) and therefore, it may be suggested that 30 m could also be the optimal distance to assess MSS in rugby players. The present study confirmed previous findings among Aussie Rules Footballers which reported that in 30 m, athletes had already reached 99.0% of their MSS and that in the T30-40m interval, there were no significant increases in sprint speed (Young et al., 2008). Moreover, in practical terms, these results suggest that in amateur rugby players, a 30 m sprint test would be a sufficient distance for the assessment of sprint speed and, that sprint speed could also be a useful reference when monitoring players in training and competitions using individual speed thresholds.
As for the differences in anthropometric characteristics, sprint times, MSS and SM in backs and forwards (Tables 3, 4 and 5), present findings suggest, like Till et al. (2017), that the evolution in speed according to the athletes’ age could be clearly differentiated between age groups below U16, but not as clearly between these and older players. Till et al. (2017) observed that increases in body mass and height could reduce the development of sprint speed, and this suggests that the assessment of SM, along with MSS, can be an important consideration for monitoring players over 16 years of age. It is important to highlight the statement of Till et al. (2015), who indicate that as they grow older, the differences between athletes will become smaller even if the time records continue to decrease, also stating that players will not continue to develop their physical qualities at such a high rate as they grow older and gain more training experience. Results of the present study indicate that there are clear differences between U14 and the rest of age categories regarding anthropometric characteristics, sprint times, MSS and SM, regardless of positions. These findings are in line with Darrall-Jones et al. (2015) who found that the increases in athletes’ body mass as they grow could probably explain the normal path of growth and maturation after the peak height velocity spurt. According to our results, U14 players could be going through this stage that represents a key moment during the adolescence and that therefore, there will also be increments in body mass (Mendez-Villanueva et al., 2011). Therefore, at least in part, these typical morphological changes at adolescence could explain the large differences observed in all measured variables in U14 compared to the rest of players. Small to moderate differences were observed between U16 and Seniors, in all sprint times, moderate differences in height and MSS and very large differences in body mass and SM. Comparisons of T10m between U16 and Seniors were deemed small, in contrast to very large differences in maximal SM. This means that Senior players reach higher sprint speed and lower times in all intervals except the initial (T10m), and furthermore, maximal SM much higher than U16 players. Both, MSS and SM are determinant variables for performance in rugby union and above all they have the power to discriminate between elite athletes and those of a lower level (Baker and Newton, 2008; Darrall-Jones et al., 2016), and it explains as well why Senior players do not and should not compete against younger players.
This work has some limitations that should be considered when interpreting the results. The main limitation of our study was the fact that we did not control the maturity status (e.g. peak height velocity) of the younger athletes, to better understand the differences that exist between particular age categories. Secondly, we did not assess jumping ability, which also would have helped to understand more clearly certain results. Regarding the use of the number of intervals, we believe that an initial section (0-5 m) should be used to estimate acceleration and starting speed.
Conclusions
In conclusion, the majority of U14 backs and forwards, reached MSS in the T20-30m interval, as well as U18 and U16 forwards and Senior backs. At the T30-40m interval, the highest percentage was found for U16 and U18 backs, and Senior forwards. When analyzing the times of each interval, results demonstrated that U14 and U16 forwards’ sprint speed did not increase after the T20-30m interval, while U16, U18 and Senior backs did not reach higher sprint speed after the T30-40m interval. These findings suggest that in all cases a distance of 30 m is sufficient to assess sprint speed and sprint momentum in rugby players. Moreover, it was observed that body mass, sprint momentum and sprint speed clearly discriminated between players of different age categories and playing positions. Finally, no differences were found between U18 and Senior players in sprint times and MSS.