Introduction
General development of physical fitness (PF) during puberty has been well documented in the pediatric exercise literature (Bergeron et al., 2015; Ortega et al., 2008). The limited understanding of various ontogenetic determinants of physical performance may result in misguided recruitment and selection of the youth for particular sports. Systematic control of PF variables is the basis for the implementation of an effective training program for all athletes including soccer players (Helgerud et al., 2001; Milanović et al., 2013; Váczi et al., 2013). As participation in soccer continues to grow and becomes increasingly competitive with ever-increasing physical demands, baseline PF of soccer players has become critical to success (Stølen et al., 2005). Research into the cross-section between PF and the demands of soccer matchplay has identified a number of key physical capacities which include: maximal aerobic uptake, lower limb power, maximal sprinting speed and repeated-sprint performance (Buchheit et al., 2010; Hoff and Helgerud, 2004; Milanović et al., 2013). Others, looking at soccer skill development, have found that overall strength, power, speed, agility, balance, stability, flexibility and cardiovascular endurance are important and suggested that physical conditioning of soccer players is a complex process which should start at young age (Peñailillo et al., 2016; Stratton et al., 2004). In childhood and adolescence, PF variables may also be important in the context of talent identification. Due to the plethora of factors involved in the development of a prospective player, talent selection is a complicated and uncertain procedure. However, without a doubt, this process must involve the examination of PF of youth players in a number of soccer-specific and non-specific performance tests. Given the clear relationship between PF and the performance level that has been reported in elite soccer players, the investigation of the systematic control of various PF components in youth athletes is an important issue in sport science.
A number of measures are commonly used to monitor soccer players’ adaptation to training and evaluate possible changes in PF levels. While in professional soccer the dominant measures of PF are focused on the assessment of soccer-specific performance including monitoring of hematological/endocrine variables, perceptual fatigue responses and a number of HR-derived indices (i.e., exercise HR [HRex], HR recovery [HRR] and HR variability [HRV]) (Buchheit et al., 2012), in younger athletes physical performance variables are of great importance (Milanović et al., 2013; Phillipaerts et al., 2006). It is the consequence of enhanced PF of even younger athletes which has driven the need to optimize the effectiveness of training and the modification of the existing models of training for children and youth.
Among the variety of training methods, circuit-training (CT) is a common training modality because of time efficiency and lighter loads typically implemented in such a program (Taskin, 2009). Free-weight circuit training is a combination of many multi-stimulating and multi-joint exercises performed consecutively, with very short or no rest in between, designed to improve body composition, functional fitness and cardiovascular endurance (Boone and by Design, 2011; Chtara et al., 2008; Taskin, 2009). CT which includes gradual changes in the training schedule, is effective in maintaining training-induced adaptation (Chtara et al., 2008). Intensity is often considered as the essential component of any exercise intervention; therefore, monitoring the intensity would provide an objective measure of the extent to which participants complied with a given prescribed exercise dose (Taylor et al., 2015). Moreover, several studies have documented that exercise intensities for prepubertal children must be higher than those for young adults, requiring heart rates of 170–180 beats per minute or approximately 80–85% of the maximal heart rate, for training adaptations to be realized (Baquet et al., 2003). Thus, we assumed that a long-term (24 weeks) regular soccer training program supplemented with relatively novel functional training involving high-intensity CT-based activities would elicit greater changes in physical performance than regular soccer training supplemented with higher volume, but lower intensity CT. We believed that the systematic incorporation of a complementary set of high-intensity multi-mode activities could be a viable and appropriate approach to increase overall energy expenditure levels and as a consequence would result in greater training-induced adaptation in PF.
In soccer there are numerous training protocols with different work-to-rest ratios, order of loading and distribution of exercise intensity. Due to different physiological responses and athletic performance effects these multiple protocols evoke, we believed that high-intensity CT combined with regular soccer training might lead to synergistic improvements and better physical performance compared to typical CT of lower intensity combined with the same regular soccer training regime. This issue, to the best of our knowledge, has not yet been investigated in detail and long-term intervention (6 months or longer) in prepubertal soccer players.
Therefore, the aim of the present study was to compare the effects of 6-month high-intensity versus moderate-intensity total-body circuit-training combined with regular soccer training on the development of several non-soccer-specific physical fitness variables in prepubertal soccer players.
Methods
Participants
Sixty-seven prepubertal boys aged 11.2 ± 0.7 years were recruited for this study. The sample comprised 46 soccer players involved in a comprehensive soccer training program at the time of the study and 21 untrained controls. Soccer players had at least 3 years of similar training experience prior to the onset of the study at the NAKI Sports Training Facility in Olsztyn, Poland. The inclusion criteria for all participants were: a) good health status, b) prepubertal or Tanner stage I, c) no recent severe lower extremity injury, d) body mass index below the cut-off point (age-appropriate threshold value between normal body mass and overweight) (Cole et al., 2007), e) healthy cardiometabolic profile (estimated VO2max > 42 mL∙kg-1∙min–1 according to international criterion-referenced standards) (Tomkinson et al., 2018). After baseline measurements, soccer players who participated in the comprehensive training program, were randomly assigned to either a complementary combined high-intensity CT group (HCT, n = 22) or a moderate-intensity CT group (MCT, n = 24). Both training groups were asked to refrain from any other forms of physical training during the study. The control group (CON, n = 21) consisted of healthy, age-matched individuals who were not involved in any regular physical activity other than their required 45-min PE classes (3 h×wk-1). The detailed physical characteristics, calendar and training age of the study samples are summarized in Table 1.
Table 1
Participants’ physical characteristics and calendar/training age (mean ± SD)
The study design was approved by the Olsztyn University Review Board and conducted according to the guidelines and recommendations of the Declaration of Helsinki (2013) and following the European Community’s guidelines for Good Clinical Practice (111/3976/88 of July 1990). Additional approval for testing was provided by NAKI Sports Training Facility officials. Parents or legal guardians of participants were informed about the purpose and procedures of the study and written consent was obtained prior to enrollment in the study.
Study design
A randomized parallel three-group, prospective and controlled design was adopted. Baseline anthropometric, body composition and PF measurements (pre-training) were conducted 2 days before the experimental groups began their comprehensive soccer training program. During the 6-month intervention, both groups of youth soccer players, while participating in the same training program, also engaged in either high- or medium-intensity CT during the 90-min training session. The two experimental groups were compared with the matched control group. All of the study participants were evaluated using a battery of nine physical fitness components prior to the 6-month training program and again at the completion of the program. The study was carried out in 2018, between January and June. Only players who attended at least 85% of the training sessions and completed both pre- and post-testing trials were included in data analysis. Testing of each group was performed on separate occasions and integrated into the weekly training schedule of participants.
Comprehensive Soccer Training Program
The training program completed by all athletes was based on the methodological and organizational guidelines developed by the Polish Soccer Association for youth soccer (Warsaw, 2010). This program encompassed a training method aimed at improving general physical fitness (primarily speed and coordination abilities) and basic skills. Each training session consisted of a warm-up which included a set of dynamic/ballistic exercises (i.e., slow runs with changes of direction, coordination, jumps), integrating game-specific actions (~20 min). The main training phase included skill drills at various intensities, targeted drills (e.g. dribbling and passing), small-sided games in multiple variations and 2 × 15 min of continuous play. The cool-down consisted of static stretching exercises of lower extremities. These training sessions took place 3 times per week (Monday, Wednesday, Friday; [1.5 h×d-1/3 d×wk-1]) and lasted approximately 90 min. In total, soccer players completed 72 training sessions with total duration of 108 h 25 min. All athletes belonged to and trained with the same club.
Circuit training protocols
In addition to the comprehensive soccer training program, players participating in this study included a CT component into their thrice weekly training sessions. Immediately after the warm-up and prior to the main training phase, those in the HCT and MCT groups completed the intensity-modulated sets of multi-mode exercises or CT, which we believed would enhance their development of speed, muscular strength, endurance and power, coordination, flexibility and cardio-respiratory fitness. Training was conducted on an indoor synthetic grass pitch to maintain standardized environmental conditions (mean ± SD temperature of 21 ± 0.6°C, relative humidity 42–44%) and included 3 sets of 9 upper-and lower-body strength exercises with articular and muscular mobilization, culminated with 40-m sprints. Each exercise was shown, to demonstrate proper technique. Participants performed CT protocols according to the description provided in Table 2.
Table 2
Detailed description of 6-month total-body circuit training (CT)
[i] Abbreviations: HCT – combined high-intensity circuit-training and soccer program group; MCT – combined medium-intensity circuit-training and soccer program group; ex. time – exercise time; ex. intensity – exercise intensity; HRmax – maximal heart rate; set of ex. 1, 2 and 3 – for specific information see Table 3
CT exercises were interspersed with 2-min inter-set rest intervals. Total time for the CT phase in the HCT group was 19 min with a 1:1 ratio of high-intensity effort and active recovery (slow walking). Total time for the CT phase in the MCT group was 28 min with a 2:1 ratio of moderate-intensity effort and passive recovery. This work recovery pattern was strictly followed by participants.
Table 3 presents detailed characteristics of exercises performed during CT in HCT and MCT groups. The exercises were chosen based on data collected in pre-intervention groups with prepubertal and adolescent boys.
Table 3
Description of a total-body circuit training (CT) exercises incorporated into a standard training session in the indoor setting
Quantifying physical training loads
To measure the internal training load (TL)
we applied the HR zone method, i.e., integrated volume and intensity relative to four exercise zones (Casamichana & Castellano, 2010). Exercise intensity during CT was supervised by investigators and team coaches using a long-range telemetry system (Polar Team2 Pro System, Polar Electro Oy, Kempele, Finland). This system enabled real-time exercise-intensity monitoring and exercise intensity was expressed as a percentage of the maximal heart rate (%HRmax). HR data were collected and recorded every 5 s. Exercise intensity was modulated based on age-predicted HRmax values, calculated for each participant using the formula 208 − 0.7 × age (Tanaka et al., 2001). According to previous research this formula is appropriate for prediction of HRmax in children and adolescents (Mahon et al., 2010). The estimated HRmax values were used as reference values for the quantification of HR values observed during each CT phase and to define four intensity zones (<75% HRmax, 75–84% HRmax, 85–89% HRmax, and >90% HRmax). We quantified the time spent within each intensity zone during the CT phase, as well as the %HRmax and percentage of the mean heart rate (%HRmean).
Total exercise time (work and recovery) across the CT phases during the 6-month period in HCT and MCT groups was 1368 and 2016 min, respectively. Participants were instructed to modify the intensity of each exercise by adjusting the speed of movement. Investigators monitored and recorded each participant’s HR and confirmed that the exercise intensity goals were met.
Measurements
Chronological age and maturational status
Chronological age was calculated as the difference between the date of birth and the date when the first testing session was conducted. The maturational status of participants was determined using the modified version of the Pubertal Maturational Observational Scale (PMOS, Davies and Rose, 2000). The PMOS utilizes parental questionnaires and investigator observations of eight secondary sex characteristics to classify individuals into four pubertal categories (pre-pubertal, early pubertal, pubertal, post-pubertal) which was used to affirm our participants could be classified as prepubertal (equivalent to Tanner stage 1).
Anthropometry and body composition
All participants were assessed for anthropometric and body composition measures using standardized procedures recommended by the International Biological Program (IBP) standards. Body height (BH) in cm, body mass (BM) in kg, body mass index (BMI) in kg/m2, and total body fat (BF) in % were evaluated. Body height was measured with a calibrated WB-150 stadiometer (Tryb-Wag, Poland) with accuracy to 0.1 cm. Body mass accurate to 0.1 kg was measured with a standard scale utilizing a portable balance. The body mass index was calculated as body mass in kg divided by body height in m squared (kg/m2). Percent body fat accurate to ± 2% was measured with a MC-780U Multi Frequency Segmental Body Composition Analyzer (Tanita Corporation, Tokyo, Japan) via bioelectric impedance analysis. Standardized BIA measurements have been accepted clinically for routine use in healthy paediatric populations (Brantlov et al., 2017).
Physical fitness
All participants were tested on the same day prior to the first training session and after the final session. Participants were asked not to engage in any high-intensity exercise for 72 hours before the evaluations. All participants were familiarized with the tests during a practice session prior to the initial testing day to avoid the learning effect and to be informed about pre-test instructions.
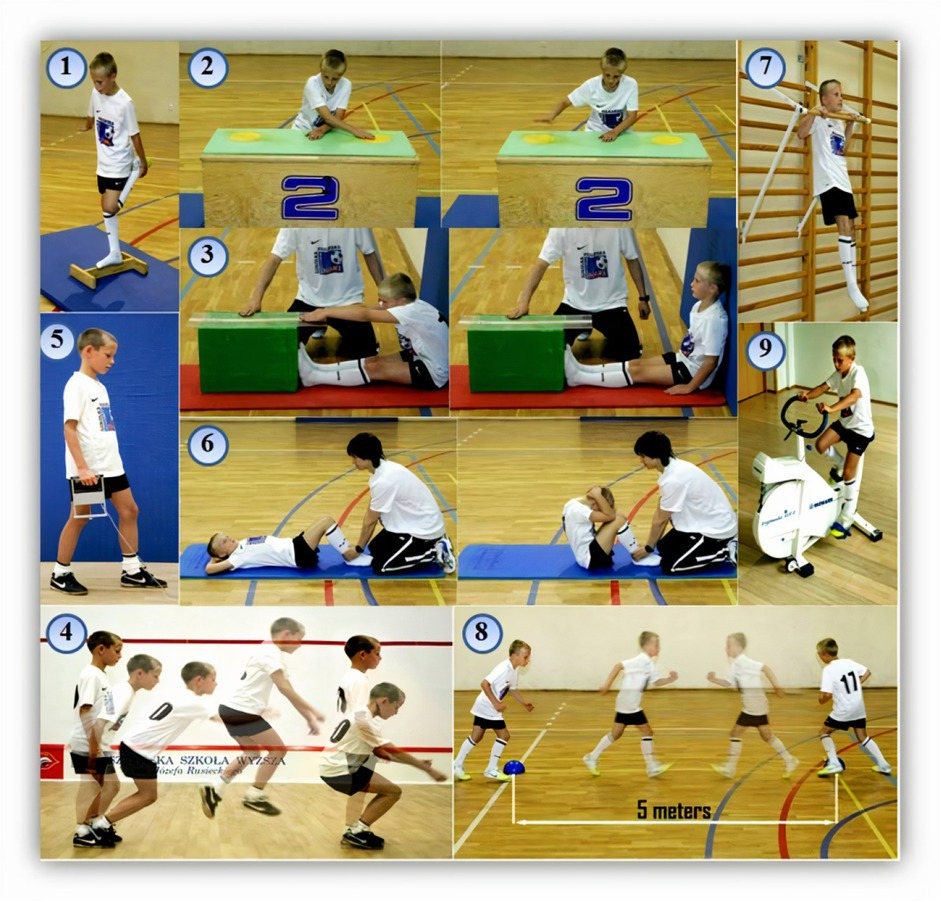
Physical fitness was determined by administering a battery of nine tests included in the Eurofit test of physical fitness (Council of Europe, 1993). The Eurofit items included the flamingo balance (FLB), plate tapping (PLT), sit-and-reach (SAR), standing broad jump (SBJ), handgrip (HG), sit-ups (SUP), bent arm hang (BAH), and 10×5 m shuttle run (SHR) tests. Considering non-specific assessment a submaximal cycle ergometer test, i.e., Physical Working Capacity (PWC170 test) was used to evaluate cardio-respiratory fitness (CRF). The Eurofit tests demonstrate very good test-retest reliability and good criterion validity for tests where appropriate criterion measures have been identified (Ruiz et al., 2011; Tomkinson et al., 2018). Figure 1 presents all tests to illustrate their procedures.
Figure 1
Illustration of nine tests from the Eurofit test of physical fitness
1 – total body balance (FLB – Flamingo Balance). Balancing for one minute on one leg on a 3 cm beam;
2 – speed and coordination of upper limb movement (PLT – Plate Tapping);
3 – extent flexibility. Reaching forward as far as possible from a seated position (SAR – Sit-and-Reach);
4 – lower body muscular power (SBJ – Standing Broad Jump).
5 – upper body muscular strength (HG – Hand Grip). The isometric hand and forearm strength was measured under static conditions with the use of the hand dynamometer DR4-P integrated with a tensometric amplifier WTP3 and a computer program MAX_v_5.5 (JBA-Zbigniew Staniak, Poland). To allow more detailed interpretation of participants’ PF, an additional variable was introduced – relative isometric hand strength (HG) in relation to body mass (N/kg);
6 – abdominal muscular strength and endurance (SUP – Sit-Ups);
7 – upper body muscular strength and endurance (BAH – Bent Arm Hang);
8 - running speed/agility (SHR – 10×5 m Shuttle Run Test);
9 – cardio-respiratory fitness (PWC170 test – Physical Working Capacity).
To minimize the influence of muscular fatigue and energy expenditure during the tests, the Eurofit test has a preestablished test item sequence and mandatory recovery time between each of the test. The Eurofit test battery was conducted in accordance with the original organizational and methodological description established by the European Council (1993).
Statistical Analysis
Descriptive statistics (means – M, standard deviations – SD) were calculated for all variables. The distribution of the data set in each group was screened for normality using the Shapiro–Wilk test. Due to the different sample sizes of the three groups, the Levene’s test was applied to confirm the homogeneity of variance. A two-way mixed model analysis of variance (ANOVA) for repeated measures was used to test for main and interaction effects of the group (levels: HCT, MCT and CON) and timing of measurement (levels: pre-intervention, post-intervention) for each outcome variable independently. When a significant main and interaction effect was found, the Tukey’s post hoc test was applied to determine the level of significance of differences for the group means. The effect size (ES) was estimated by partial eta square (η2p). The interpretation of effect sizes was based on benchmarks established by Cohen (1988): 0.01 (small effect), 0.06 (medium effect) and 0.14 (large effect). The criterion for significance was set at p < 0.05. All statistical calculations were made using the STATISTICA™ v. 10.1 software package (StatSoft Inc., USA) and Office Excel 2010 (Microsoft Corporation, USA).
Results
Trial adherence
One participant from the HCT group dropped out of the trial after week 11, having attended every session up to that point. Thirty-nine participants completed all 72 sessions. All the participants met the required 85% attendance rate. Typical reasons for participants’ absence from training sessions were illness and/or lower extremity injury.
Body height, body mass, and the body mass index did not differ between the groups at baseline. The only significant difference was observed for BF% between the HCT and CON groups (p < 0.05). However, by month 6 body mass and percent body fat were significantly lower (p < 0.05) in the HCT and MCT groups compared to the CON. No significant differences (p > 0.05) in body height and the body mass index were found for either the HCT, MCT or CON groups between baseline and after the 6-month training program. There were no significant differences (p > 0.05) between HCT and MCT groups in any somatic variables after the intervention.
Training load
For between-group comparisons training-HR data were analyzed. Comparisons of the training intensity based on the HR zone method are presented in Table 4.
Table 4
Comparison of time (expressed in minutes and %) spent in different HR zones during CT phases in HCT (n = 22) and MCT (n = 24) groups
| Variable | HCT group | MCT group | ||
|---|---|---|---|---|
| (min) | (%) | (min) | (%) | |
| Total time | 19 | 100 | 28 | 100 |
| Time at <75% HRmax | 2 | 10.53 | 14 | 50.00 |
| Time at 75–84% HRmax | 3 | 15.79 | 10 | 35.71 |
| Time at 85–89% HRmax | 6 | 31.58 | 2 | 7.14 |
| Time at >90% HRmax | 8 | 42.11 | 2 | 7.14 |
The predicted HRmax for the training groups was 199.2 beats∙min-1. During CT sessions the HRmean (beats∙min-1) in HCT and MCT groups was 171.4 ± 7.9 (86.0%HRmax) and 154.6 ± 7.1 (77.6%HRmax), respectively. This difference was statistically significant (p < 0.001). Players from the HCT group performed CT at 85–89% HRmax 3 times longer and at >90% HRmax 4 times longer compared to the MCT group. The MCT group performed CT at <75% HRmax intensity zone for 50% of total exercise time while the HCT group only for 10.5%.
Physical fitness outcomes
Statistical testing confirmed the normal distribution of the data set in each group and confirmed the assumption of homogeneity of variance between the groups for all variables.
There were no statistically significant differences between the training groups at baseline (p > 0.05). However, HCT and MCT groups were significantly better compared to the CON group at the pre-intervention trial in most tests (p < 0.001-0.05). The exception was no significant difference between the MCT and CON groups in the BAH (p > 0.05). Table 5 provides descriptive statistics, pre- and post-intervention % changes, and main effects of physical fitness components between the training (HCT and MCT) and control (CON) groups.
Table 5
Descriptive statistics (mean ± SD), percentage changes (Δ%), and main and interaction effects in eight physical fitness components (without cardio-respiratory fitness) pre-and post-intervention between the groups
From the two-way ANOVA, interaction effects of group×time for the five components of the Eurofit test were observed (partial eta squared ranged 0.137–0.577). The largest interaction effect was observed for the SBJ (F2,63 = 42.895, p < 0.001, η2 = 0.577 [large]) and the smallest for the SHR (F2,63 = 5.006, p < 0.01, η2 = 0.137 [medium]). In the absence of statistical significance for interaction effects, the two-way ANOVA yielded significant main effects for the group and time in the SAR (group: F2,63 = 3.766, p = 0.029, η2 = 0.107; time: F1,63 = 21.212, p < 0.001, η2 = 0.252), SUP (group: F2,63 = 11.691, p < 0.001, η2 = 0.271; time: F1,63 = 30.595, p < 0.001, η2 = 0.327) and only for time in the BAH (time: F1,63 = 24.336, p < 0.001, η2 = 0.279). For both training groups (HCT and MCT) the highest pre-to post-intervention changes expressed in percentage values were for the FLB (29.6% vs. 11.5%, respectively) and SAR (132.0% vs. 13.9%, respectively). However, the best SAR values were noted both at baseline and post-training in the MCT group. In general, all physical fitness components (except the SAR) were better at post-intervention for the HCT than the MCT group, but also tended to improve in these groups throughout the evaluations.
For the training groups, participation in the 6-month training program resulted in varied changes in the measured absolute and relative CRF variables (p < 0.001). The PWC170 was significantly higher for the HCT than for the MCT group at post-intervention. Figure 2 depicts that for the HCT group this variable increased substantially from pre- to post-intervention (p < 0.001; 12.4%) while in the MCT group, a statistically significant decrease was observed (p < 0.05). Most importantly, the interaction effect was significant (F2,72 = 25.101, p < 0.001, η2 = 0.411 [large]).
Figure 2
Mean ± SD values from Physical Working Capacity 170 (PWC170) level pre-and post-intervention in soccer players (HCT and MCT groups) and age-matched controls (CON) Interaction effect for PWC170 (W/kg): F2,72 = 25.101, p < 0.001, η2 = 0.411 [large]
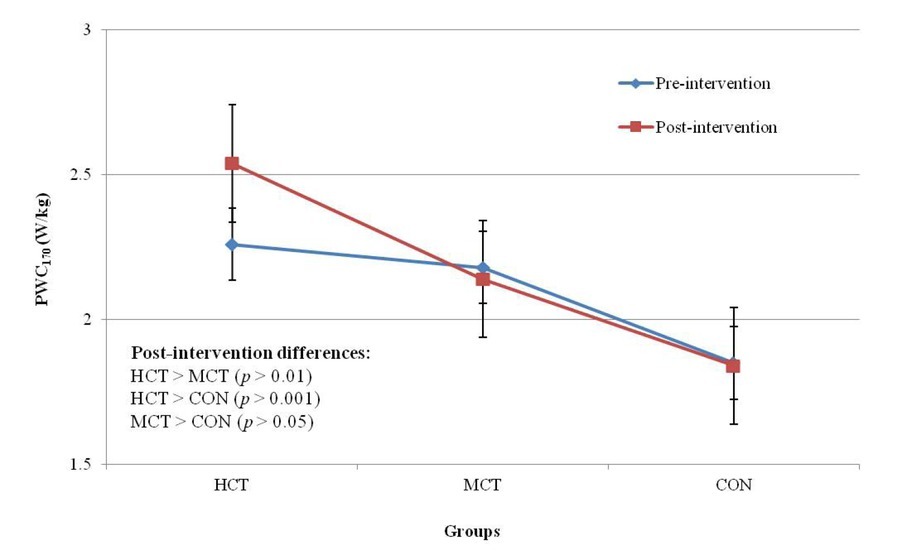
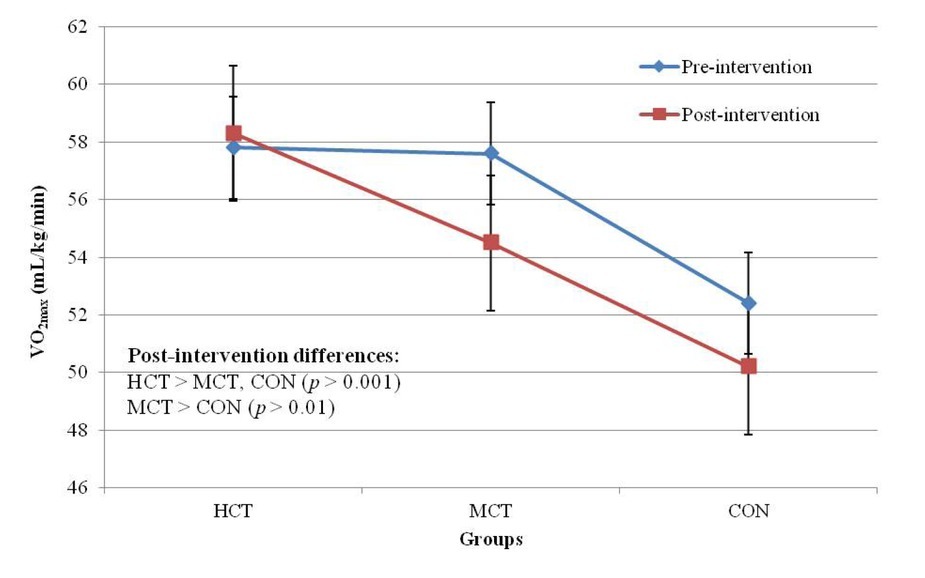
Figure 3 indicates changes of relative VO2max throughout the intervention. Post-hoc analysis showed that the HCT group maintained VO2max, but it decreased significantly from pre- to post-intervention in the MCT and CON groups (both p < 0.001; 5.4% and 4.2%, respectively). Again, an interaction effect was found (F2,72 = 7.398, p < 0.01, η2 = 0.097 [medium]).
Discussion
In this study, we investigated whether modulations of exercise intensity during circuit training combined with soccer activity in the course of a 6-month intervention would enhance physical fitness in prepubertal boys involved in a comprehensive soccer training program. To the authors’ knowledge, there are only two studies reporting the effects of a long-term training intervention (>24 weeks) in prepubertal soccer players (Boraczyński et al., 2019; Ferrete et al., 2014) and there has been no study including circuit training in this timeframe.
Generally, children and adolescents respond well to progressive and periodized training loads, thus circuit training may also be effective and applicative in soccer to induce training adaptation. It has been established that partial substitution of the main physical activity (eg. soccer-specific exercises) helps maintain and improve PF components in trained youth (Bergeron, 2007; Stratton et al., 2004). Since more children and adolescents participate in sports and conditioning programs, sometimes without consideration for the cumulative workload, it is important to establish age-appropriate training guidelines which may enhance athletic performance.
More recent studies which investigated trainability of youth with more intense and high-volume training protocols demonstrated significant improvements in selected performance measures in children and adolescents following progressive training programs (Boraczyński et al., 2019; Ferrete et al., 2004; Ozmun et al., 1994). Tsolakis et al. (2006) applied a similar methodological approach, but they tested peripubertal male fencers (11- to 13-year-old boys). Their CT program included 2–3 cycles (3 min of rest between cycles) with 5–7 exercises in each cycle for the upper and lower body (45 s rest intervals between each exercise) and 10–20 repetitions of each exercise. They also modulated exercise intensity which was modified monthly. Contrary to our findings, those authors reported that 12 months of specialized fencing training combined with a CT program in peripubertal boys had no significant effect on handgrip strength and jumping performance.
In our study, out of all Eurofit tests the largest interaction effect was observed for the SBJ. The jump performance results obtained by the HCT, MCT and CON groups post-intervention are comparable with those of several previous studies with prepubertal or pubertal soccer players. For example, Vaeyens et al. (2006) reported values for the SBJ between 170.1 ± 14.5 cm and 201.5 ± 13.6 cm for U13 and U16 elite Belgian soccer players, respectively. It is believed that combining strength training and power training improves explosive performance and power-related skills to a greater extent than any of the two training modalities alone (Fatouros et al., 2000). However, some previous studies showed no improvements in jump performance of soccer players after strength training when slow or normal contraction speed was used in the training protocol (Taiana et al., 1993). These outcomes suggest that the exercise intensity modulation via progression in speed of movement rather than resistance or loads is more important and positively affects jump performance of youth soccer players.
For the HG we noted an evident interaction effect, with the HCT group showing the greatest improvement over the course of 6 months (11.5%, p < 0.001). For comparison, Ozmun et al. (1994) tested eight prepubertal boys. Their participants followed an 8-week resistance training program and those authors reported improvements in isometric arm strength of 22.6%. Similarly, Christou et al. (2006) found that after 16 weeks of traditional resistance training performed twice a week in addition to soccer training (5 times per week), there were greater increases in upper- and lower-body strength and vertical jump performance (i.e., Squat Jump [SJ] increased by 31%) as compared to soccer training (i.e., SJ increased by 9.8%). Simultaneously, we noted no interactions in two other tests measuring abdominal muscular strength and endurance (SUP) and upper-body muscular strength and endurance (BAH). However, we identified a significant main effect for the group in SUP where the HCT group was significantly better than the MCT and both training groups presented a higher performance level compared to controls. It is in line with Vaeyens et al. (2006) who observed that elite and sub-elite adolescent soccer players performed significantly better than non-elite players on the BAH. It should be also noted that we applied a medium-frequency (3 times per week) moderate or high-intensity CT program, using basic core, lower- and upper-body strength exercises and not sport specific strength exercises. In this sense, a lack of specificity in the CT phase of training could be another reason which may explain partly underestimated muscular strength improvements observed in the training groups. It may be speculated that somatic changes were less significant. One must note that body mass has a significant impact on BAH results. Still, it was not an expected outcome as strength abilities exhibit the largest trainability (Faigenbaum, 2019).
PLT results are strictly associated with frequency of movement. In the present study we again identified an interaction effect with a large effect size (2 = 0.149) for the PLT where the HCT group showed the best results at two time points and the highest pre- to post-intervention improvement (5.2%). The other groups presented stable and comparable percentage increases in PLT times albeit the MCT group exhibited significantly better outcomes. We suppose that these outcomes were due to specific neural adaptation, such as increased motor unit recruitment and coordination following the high-intensity CT protocol applied in the HCT group. In previous studies improved coordination of the involved muscle groups has been reported after resistance training programs in children and adolescents (Ozmun et al., 1994). It is believed that these gains are derived largely from neuromuscular adaptation in prepubertal children.
Balance during the unstable stance is indispensable in soccer and a high level of this ability may reduce lower extremity injuries in youth soccer players (Malliou et al., 2004). In this study, the observed training effects in the HCT group indicate that the methodological approach used in the high-intensity CT protocol is appropriate for enhancement in body balance. One must note that the Flamingo Balance test designed in respect to Eurofit norms is a test which assesses the single-leg balance level and strength of muscles which support this postural position. A recent study confirmed a strong relationship between isometric strength and balance ability amongst youth elite soccer players (Chtara et al., 2016). In the present study the 3 sets of exercises applied in both CT protocols were conducted with a weight-bearing position and these activities were performed with articular and muscular mobilization. This stresses the role of proprioception as an important factor promoting functional stability in soccer (Boraczyński et al., 2019).
The increase in flexibility of hamstrings and lower back muscles in the HCT group was non-significant and reached a lower level at post-intervention than the initial level observed in the MCT group. Based on these results, it seems that participation in applied soccer training supplemented by resistance-type CT does not impair flexibility development. Research performed in adults reported that if stretching exercises were part of the strength training program, flexibility would not be impaired and it might even increase (Thrash & Kelly, 1987). In this study, dynamic stretching exercises were performed before, and static stretching exercises after the CT sessions. Previous studies involving prepubertal boys reported either increases or no changes in flexibility after strength training when using programs with low to moderate volume and intensity (Faigenbaum et al., 1996; Falk et al., 1996). Ferrete et al. (2004) observed the effects of 26-week on-field combined strength and high-intensity training on the physical performance capacity among 24 prepubertal soccer players. A significant increase and decrease (both p ≤ 0.05) were observed in the SAR test in soccer and control groups between baseline and post-test (7.3%; ES = 0.37 and −13.1%; ES = 0.94, respectively).
Sprinting ability is especially important in soccer during early puberty when growth-related differences are equalized. In our study agility (10×5 m) was improved to a greater extent in the HCT group versus the MCT group (pre- to post-intervention improvement was 3.4% and 2.1%, respectively). This indicates the greater efficiency of the high-intensity CT protocol which was concluded by repeated 40 m shuttle runs. Taking into account some differences regarding adopted CT protocols, physiological responses (HR increases) during the workout corroborate data from previous studies. Baquet et al. (2002) showed that a 7-week aerobic running program with 20 girls and 13 boys (training intensities were 78– 95% HRmax) significantly increased their maximal shuttle-running velocity. Additionally, Vaeyens et al. (2006) found that speed was one of the factors that discriminated between elite and sub-elite players at the ages of 13 and 14 years. As concluded by Mendez-Villanueva et al. (2011), large correlations among acceleration, maximum running speed, and repeated-sprint performance in the U14 soccer group suggest that these physical qualities in youth soccer players might be considered a general quality, which is likely to be related to qualitative adaptation which accompany maturation.
Regarding cardio-respiratory assessment, the most important result was a substantial increase in the PWC170 index in the HCT group (from 2.26 to 2.54 W/kg), while it decreased non-significantly in MCT and CON groups. The age dynamics of PWC170 in youth soccer players is closely related to the dynamics of somatic development. The most significant periods in the development of the PWC170 index in youth soccer players is the age of 13 and 15 years (Shakhanova et al., 2015). This index to a greater extent than VO2max characterizes the vegetative component of adaptation, the degree of the regulatory systems’ stress, and the reactivity of the cardiovascular system. Also, aerobic capacity expressed as absolute and relative VO2max increased in the HCT group by 8.2% and 0.9%, respectively. It is worth noting that relative VO2max decreased significantly (p < 0.01) from pre- to post-intervention in the MCT and CON groups, while the change in absolute VO2max was non-significant in these groups. However, observed decreases in relative VO2max do not indicate deterioration of aerobic capacity, but the effect of somatic development. Indeed, as long as training intensity is sufficient, improvements have been seen in both prepubertal and adolescent children. While training adaptation especially in terms of long-term intervention can occur in the prepubertal population, in some circumstances it appears to be blunted. For example, Baquet et al. (2002) reported the effects of a 7-week (twice per week) high-intensity intermittent training program on peak VO2 of prepubertal boys. Peak VO2 increased by 8.2% compared with a 1.9% reduction in 20 maturity-matched control participants. The results demonstrated that prepubertal children can increase peak VO2 with high intensity aerobic exercise. Baquet et al. (2003) reviewed multiple training studies and showed that endurance training led to improvements in cardio-respiratory fitness of children and adolescents of all ages, especially when the intensity of effort was high (≥ 80% of HRmax). Moreover, they found an average increase in VO2max of 10% (7% more than it would be expected as a consequence of normal growth). It is known that VO2max increases with age, but this relationship is more dynamic since pubertal maturation is initiated. For male elite junior players, average VO2max is 160-190 mL∙kg0.75∙min-1 (or 55-65 mL∙kg-1∙min-1) (Nowacki et al., 1988). Overall, VO2max values obtained in this study were slightly lower than 60 mL∙kg-1∙min-1. The values obtained by HCT and MCT groups are considered to be appropriate for boys of this age, are higher than those obtained for non-athlete age-matched controls (Tomkinson et al., 2018), and are slightly higher than values reported by other investigators for training groups in the same phase of maturation (LeMura et al., 1999). Furthermore, the regular progression of VO2max values is essential for soccer players as Helgerud et al. (2001) showed that increasing VO2max by 11% increased match intensity by 5% in male elite junior soccer players. However, there exists a strong notion that sports specific endurance CT is effective in improving VO2max.
Limitations of the study
The main limitation of our study is the lack of a training group involved in comprehensive soccer training without the supplementary CT protocol. This would have helped in objective differentiation of training effects between the regular soccer program only and the program enhanced by CT of variable intensity. Moreover, when reporting changes between the training groups and controls in the 10×5 m shuttle run test, bent-arm-hang and standing broad jump, neither body mass nor fat-free mass were statistically controlled. Another limitation is that little research is available on the long-term effects of CT in prepubertal soccer players, which limits the in-depth comparative analysis. Concerning other studies using different training protocols with manipulations of exercise intensity, the differences in this measure may also have contributed to conflicting results, compared to our study. Another limitation may include the non-specific evaluation of VO2max through a cycle test instead of a running exercise protocol.
Conclusions
In conclusion, application of the intensity-controlled total-body CT protocol composed of basic core, upper- and lower-body strength exercises with mobility exercises concluded by repeated 40-m shuttle runs has a potential to effectively enhance such physical fitness components as single-leg balance, speed and coordination of upper limbs, explosive power of lower extremities, isometric hand and forearm strength, as well as maximal shuttle-running speed. Our study provides evidence that, when the purpose is to improve multiple physical fitness components of youth soccer players, high-intensity circuit-training combined with regular soccer training performed 3 times a week for a 6-month period is practicable and does not interfere with a standard training schedule. Our findings also suggest that strength and power adaptation is unaffected when circuit training and soccer training is performed concurrently over a 6-month comprehensive soccer training program. The results also highlight the relevance of non-specific tests at different ages during the prepubertal period as they provide insight into physical performance not affected by soccer-specific skills. Age-specific reference values for the total sample of youth soccer players may be useful for coaches in both talent identification and athletic development evaluation. Further studies in this area will enable us to give more general recommendations for the use of circuit training in the development of functional and generic physical fitness in youth soccer players.