Introduction
Competitive bodybuilders are judged on muscularity and proportionality. Training and nutrition fall into phases: off-season, competition preparation, peak week and recovery (Chappell and Simper, 2018; Helms et al., 2015; Spendlove et al., 2015). In the off-season bodybuilders gain weight, to add muscle before reducing body fat to increase definition during competition preparation (Chappell and Simper, 2018). Finally, bodybuilders employ peaking strategies immediately prior to competition to ‘fine-tune’ their appearance (Helms et al., 2014). Contest preparation generally involves 12-32 weeks of energy restriction and increased aerobic activity (Helms et al., 2019; Mäestu et al., 2010). Recently, a ‘recovery period’ was identified where athletes seek to restore ‘normal’ hormonal and metabolic function, and resolve any psychological aberrations associated with competition preparation (Mäestu et al., 2010).
Competition preparation’s effect on biopsychosocial outcomes is under-researched and longitudinal studies with large cohorts are logistically challenging. Mäestu et al. (2010), however, carried out an 11-week intervention on 14 bodybuilders and Mitchell et al. (2018) recruited 9 bodybuilders for a 20-week case series. Besides these exceptions, most studies are cross sectional and case study designs, sometimes on athletes in categories demanding less muscularity and leanness compared to the bodybuilding, e.g.
bikini, figure, or men’s physique (Alwan et al., 2019; Trexler et al., 2017). There are, however, numerous single-competitor case studies investigating physiological changes during contest preparation reviewed by Helms et al. (2019) and Alwan et al. (2019). Contest preparation strategies may vary by geographical location and drug testing of the sanctioning federation (Chappell and Simper, 2018); however, we found no case series of natural British bodybuilders. Furthermore, effects of long-term bodybuilding preparation on state and trait anxiety are unknown. A common perception is bodybuilders manipulate their physiques out of a sense of inadequacy known as body dysmorphia or ‘bigorexia’ (a pathological need to build ever greater muscle mass despite substantial current muscularity); however, its prevalence amongst natural (drug free) bodybuilders is unknown (Devrim et al., 2018). The aim of this investigation was to observe the biopsychosocial changes among a small number of British natural bodybuilders during competition and recovery.
Methods
Participants
Four amateur drug-free bodybuilders (3 male), preparing for British Natural Bodybuilding Federation (BNBF) competitions were recruited. The males (P1, P2, and P3) were from the bodybuilding category, and the female participant (P4) was from the figure category. Prior to participating, P2 (44 yrs), and P4 (38 yrs) previously placed in the top 5 at the BNBF finals, P3 (38 yrs) qualified for the finals, and P1 (30 yrs) competed in a regional BNBF qualifier. Participants competed throughout the observation: P1 twice; P3 three times; P4 four times, and P2 five times. All participants were subject to drug testing via urinalysis, and P2 to P4 both completed a polygraph prior to the BNBF finals. P1 and P2 managed their own competition preparation, while P3 and P4 had coaches.
Participants visited the laboratory every four weeks for eight months, five to six months (5M/6M) prior to their final competition and 2 months post-competition (POST). The pre-competition (PRE) visit was one week before the participant’s final competition, with the exception of P3, who visited the lab one week after his final competition. P1 was recruited at the outset of his competition preparation, and P2-P4 six to eight weeks after they started competition preparation. Group mean ± standard deviation (SD) and individual data are reported. This study was approved by the university ethics committee, in accordance with the Declaration of Helsinki. Participants were informed of all aspects of the study, provided written consent, and gave permission to publish their data after reviewing the final document.
Indirect calorimetry, prediction equations, heart rate and blood pressure
The resting metabolic rate (RMR) was measured per established protocols (Compher et al., 2011). Participants were measured following a 12 h fast and were asked to refrain from caffeine, physical activity and alcohol for 24 h preceding visits. Participants rested supine for 20 mins, followed by 10 mins wearing a facemask for RMR measurements (AS Instruments, Oxford, United Kingdom). The RMR was captured by breath-by-breath oxygen (V̇O2) and carbon dioxide (V̇CO2) consumption via Douglas bags and an electronic gas analyzer (GIR250, MTL, Luton, United Kingdom). Gas calibration was carried out using known concentrations (4% CO2; 16% O2 and 100% N2; Spancan MTL, Luton, United Kingdom). Environmental conditions during testing were: humidity 27.9 ± 7.2%; temperature 22.1 ± 2.6°C. The Schofield (Schofield, 1985) and the Cunningham equation (Cunningham, 1980) for estimating the BMR were compared to the measured RMR. Blood pressure and the heart rate were measured using a digital blood pressure monitor (UA-787 Plus, A & D Instruments Ltd, Oxfordshire, UK) in triplicate with participants supine.
Anthropometry and Body Composition
Participants were asked to consume 500 ml of water the morning of the trial to standardize hydration. Body height was measured using a stadiometer (Holtain, Crymych, United Kingdom) and weight, FM, FFM, and total body water (TBW) were measured via a Tanita multi-frequency BIA analyzer (InBody 720, Biospace, Urbandale, Iowa, USA). The BMI and fat free mass index (FFMI) were calculated as kg/m2 and FFM kg/m2, respectively. Sum of 7-site skinfold assessment using amplitude-mode ultrasound (Bodymetrix, Professional Ultrasound, Cartwright fitness, Chester, UK) was used to calculate BF% (Jackson and Pollock, 1978). Ultrasound testing was performed as described by Muller et al. (2016), and was interpreted using Bodymetrix ultrasound analysis software (IntelaMetrix, Brentwood, California, United States).
Blood and saliva measurements
Capillary blood samples were obtained via a single-use lancet (Accu-chek Softclix Pro, Roche Diagnostics Ltd, West Sussex, UK) and microsafe collection tubes (Inverness Medical, Cheshire, UK). Test strips and a reflectance photometer (Reflotron Plus, Inverness Medical) for total cholesterol (TC), whole blood triglycerides (TAG), creatine kinase (CK) and high-density lipoproteins (HDL) were used. The low-density lipoprotein (LDL) fraction was estimated by subtracting the sum of total TAG and HDL divided by 2.19, from TC. Fasting blood glucose (FBG) was measured via whole blood samples added to a heparin and saline solution before analysis by a Biosen C-line monitor (EKF diagnostics, Ebendorfer, Germany). Salivary testosterone and CRP were measured with enzyme immunoassay kits (Salimetrics, Carlsbad, California, USA), prior to analysis on a plate reader at 450 nm (Synergy HT, BioTek Instruments, Winoski, Vermont, USA), and Gen5 microplate reader software (BioTek Instruments, Winoski, Vermont, USA).
Anaerobic power and hand grip strength
Anaerobic power was measured via the 20 s Wingate test as described by Attia et al. (2014) using a Velotron cycle (Racer-Mate, Seattle, WA). Peak, mean, and body mass-scaled power were obtained from Velotron software (RaceMate One V.4.1.0.6). Hand grip strength (HGS) was measured via a hand grip dynamometer (Takei, Nigata City, Nigata Pref, Japan).
Dietary intake and energy availability
The first author (AC; a registered nutritionist) performed 24 h dietary recalls. Participants documented weights and portions of food and beverages consumed in the previous 24 hours. Participants consumed the same foods across the week and specified where high and low energy days occurred. Data were analyzed using dietary analysis software (Nutritics Research Edition v5.092, Dublin, Ireland). Energy and protein from dietary supplements were calculated per manufacturers’ websites. Energy availability (EA) was calculated as total energy intake, divided by FFM, minus an estimate of energy expenditure based on a daily resistance training session between 60-90 min, and cardiovascular exercise between 20-45 min.
Psychological Assessment Questionnaires
The Eating Attitude 26-item questionnaire (EAT-26) (Garner and Garfinkel, 1979) is divided into three subscales: dieting behavior, Bulimia Nervosa and food preoccupation. EAT-26 captures attitudes in the previous 6 months; scores over 20 are regarded as a cause for concern, requiring further assessment. Body dysmorphic disorder (BDD) symptoms were assessed via the Body Uneasiness Test (BUT) (Cuzzolaro et al., 2006) which is a 34-item questionnaire with five subscales assessing weight phobia, body image concern, avoidance, compulsive self-monitoring and depersonalization. BUT scores over 2.0 (global severity index [GSI]) were set as the cutoff for BDD symptoms requiring further assessment. Finally, the State-Trait Anxiety Inventory for Adults (STAI) was used to assess state and trait anxiety. Trait anxiety refers to a relatively stable personality factor indicating anxiety susceptibility, such as perceptions of a stressful situation as dangerous or threatening, while state anxiety refers to transient feelings of stress in a situation (Spielberger and Gorsuch, 1983). The STAI contains two 20-item sets of multiple-choice questions. Scores above 48 and 41 for state and trait anxiety, respectively, were considered ‘elevated’ (Spielberger and Gorsuch, 1983). All tests were conducted prior to indirect calorimetry.
Design and Procedures and Statistical analysis
This study follows a case-series design which carried out observations for offseason, pre-competition and recovery phases of the athletes involved. Descriptive statistics were used to track any alterations to outcome measures between the three phases, these were recorded and analyzed in Microsoft Excel.
Results
Participants’ characteristics and indirect calorimetry
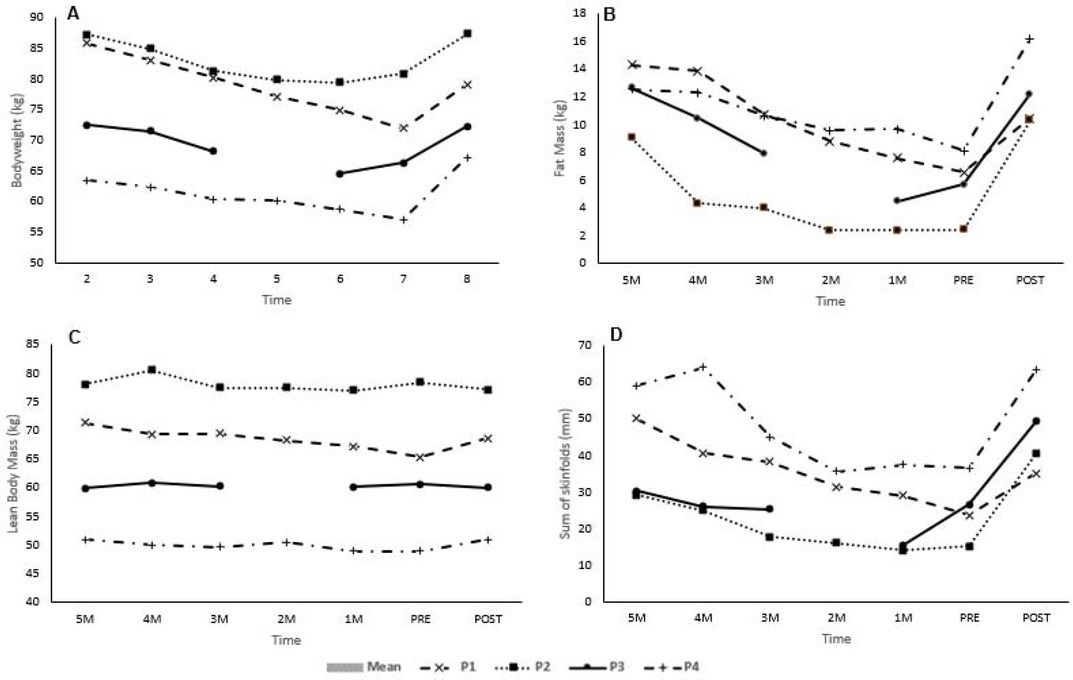
Body height of P1 to P4 were 1.76, 1.86, 1.64, and 1.64 m, respectively. Individual BW, LBM, FM and sum of skinfolds are provided in Table 1 for selected time points and as supplementary Figures (S1). There was a trend from 5M to PRE of indices decreasing before increasing POST. Mean body mass loss 5M to PRE: 9.0 ± 3.3 kg (10.6 ± 3.9 %), of which 1.8 ± 3.0 kg (20.9 ± 4.4 %) was FFM and 6.8 ± 1.1 kg (79.1 ± 4.5 %) FM. Mean body mass regain PRE to POST was 7.5 ± 1.9 kg, with 1.6 ± 1.4 kg (13.3 ± 3.3 %) from FFM and 6.9 ± 2.0 kg (87.3 ± 3.3 %) FM. Except for P1, body mass POST, reflected 5M weight. Mean skinfolds decreased 19.5 ± 13.5 mm 5M to PRE, before increasing PRE to POST by 24.3 ± 9.3 mm.
Table 1a
Estimated Energy Requirements and Selected Health Indices of British Natural Bodybuilders
[i] $ one week pre shows carb depleting, first bodybuilding shows. *one day pre shows carb loading, ¥ Lean body mass based on BIA, SYS systolic, DIA diastolic, BPM beats per minute, LDL Low density lipoprotein, HDL high density lipoprotein, - measurement not recorded. ♂ male, ♀ female, LBM lean body mass, BMI body mass index, FFMI fat free mass index
The RMR, TBW, BMI, FFMI, blood pressure, heart rate, blood glucose, blood lipids, CRP, CK and testosterone are presented in Table 1a&b and as supplementary Figures (S2) for selected time points. There was a trend for the RMR to decrease from 5M to PRE, before increasing POST. Prediction equations overestimated energy requirements by as much as 911.2 kcal (Schofield) and 727.0 kcal (Cunningham), and under-estimated by as much as -688.4 kcal (Schofield) and -617.8 kcal (Cunningham). Mean estimates of energy requirements were 267 ± 655.0 kcal per day for the Schofield equations and 159.4 ± 569.6 kcal per day for the Cunningham equations. Waist and hip circumferences and WHR decreased from 5M to PRE-in all competitors, before increasing POST. The mean waist circumference was: 5M 79.4 ± 7.7 cm, PRE 72.5 ± 3.9 cm, POST 79.3 ± 3.5 cm; hip circumference 5M, 101 ± 4.3 cm, PRE 90.9 ± 2.8 cm, POST 96.9 ± 7.9 cm; WHR 5M 0.80 ± 0.06, PRE 0.80 ± 0.4, POST 0.82 ± 0.04.
Table 1b
Estimated Energy Requirements and Selected Health Indices of British Natural Bodybuilders
[i] $ one week pre shows carb depleting, first bodybuilding shows. *one day pre shows carb loading, ¥ Lean body mass based on BIA, SYS systolic, DIA diastolic, BPM beats per minute, LDL Low density lipoprotein, HDL high density lipoprotein, - measurement not recorded. ♂ male, ♀ female, LBM lean body mass, BMI body mass index, FFMI fat free mass index
Dietary intake, exercise regimes, and energy availability
Table 2 displays nutrient intake and a sample participant’s diet is provided as a supplement (S3). Foods most commonly consumed were: oats, rice, white and sweet potatoes, poultry, spinach and broccoli. Periodised nutrition was practiced by P3 and P4 (where high and low energy was consumed per the training schedule). Daily dietary intake was consistent without “treat” or “cheat meals” with quantities changing to reflect reduced energy intake. Energy declined in competitors’ diets 5M to PRE, before increasing PRE to POST (Table 2a&b), EA followed the same pattern. Participants consumed 1-7 dietary supplements. Whey protein was most frequently used. Maltodextrin, branch chain amino acids, creatine monohydrate, leucine, glutamine, and protein bars were also consumed.
Table 2a
24 h dietary intake of Bodybuilders Preparing for Competition
Table 2b
24 h dietary intake of Bodybuilders Preparing for Competition
Resistance training was consistent throughout the observation and organized by muscle group e.g. “back” or “leg” day. Participants trained four (P2), five (P1, P4), or six (P3) days per week. Muscle group training frequency reflected relative strengths and weaknesses, participants performed 2 to 5 exercises per muscle group, for 2 to 5 sets. Only P2 reduced training frequency POST, from four to three days per week. P2 and P4 performed fasted aerobics and P1, P2 and P4 performed high intensity interval training (HIIT) 1-3 times per week, for 10-30 min. All participants performed 20-45 min of low intensity steady state (LISS) aerobics 2-13 times per week. The amount of aerobic training increased as participants approached competition before declining in the POST phase.
Performance metrics of bodybuilding competitors
Wingate and HGS results are reported in Table 3a&b and as a supplement (S4). There was a slight increase in HGS in P3 and P4 from 5M to POST, and a slight decrease in HGS 5M to PRE in P1 and P2. Peak, mean and minimum power declined from 5M to PRE, before increasing POST, with the exception of P2 who increased mean and minimum power throughout the study.
Table 3a
Performance metrics for bodybuilding
Table 3b
Performance metrics for bodybuilding
Eating Attitudes, Body Uneasiness and State Trait Anxiety Testing
Results of EAT-26, STAI and the BUT are presented in Figure 1A-D. EAT-26 scores were between 1-15 (Figure 1A). The dieting subscale contributed most to the overall EAT-26 score (1-9) with item 6: ‘I am aware of the calorie content of foods I eat’, 19: ‘I display self-control around food’ and 23: ‘I engage in dieting behavior’ the highest scoring. Bulimia and oral control scales scored between 06. Participants consistently reported exercising more than 60 min a day to lose weight, and having lost 9 kg or more in the past 6 months. In the POST phase, P2 and P4 reported binge-eating at least once monthly.
Figure 1A-D.
Psychological Assessment of Competitive Natural Bodybuilders throughout Competition Preparation. A Eating Attitudes 26 (concern score cut off 20), B Body Uneasiness Test (body dysmorphic disorder concern cut off 2.0), C State Trait Anxiety Index, State Test (elevated state anxiety cut off 48), D State Trait Anxiety Index, Trait Test (elevated trait anxiety cut off 41). Abbreviations. M months from final competition, PRE final visit to the lab prior to the last competition of the season, POST 8 weeks post the PRE laboratory visit.
BUT scores were between 0.2-1.0 (below the 2.0 cut off associated with BDD, see Figure 1B). Weight phobia (0.1-1.2), compulsive self-monitoring (0.2 to 1.8) and body image concern (0.0-1.2) subscales scored the highest. Avoidance and depersonalization subscales were between 0.0-0.7. State anxiety scored between 20-52, with three occasions where participants scored higher than the 48 cut off (P3: 6M 52; P2: 1M 51, POST 49) for elevated state anxiety (Figure 1C). Trait anxiety was between 20-50, only P1 did not exceed the 41-score cut off for elevated anxiety (P2: 4M 50; P3: 5M 47, 4M 46, 1M 42, POST 44: P4 6M 50) (Figure 1D).
Discussion
This study documents biopsychosocial changes of 4 bodybuilders during competition preparation and recovery. As participants lost body mass, metabolic indices of health (FBG, blood lipids, blood pressure) improved, while testosterone and anaerobic performance decreased, and HGS was largely unaffected. This is the first case series performed on a British natural bodybuilding cohort, and the first to report bodybuilders’ eating/body image attitudes and anxiety during competition preparation. Overall, there were few effects on eating and body image attitudes, although we observed elevated state and trait anxiety.
All participants reduced their mass during competition preparation. The 10.6% weight loss is consistent with the 11.1 and 13.2% weight loss previously reported amongst British natural bodybuilders (Chappell and Simper, 2018). Moreover, 20.9% of body mass losses from FFM is consistent with the “one-quarter rule” documented in a weight loss study (Heymsfield et al., 2014), and the 20.1% FFM loss observed in a bodybuilding case series observation by Rossow et al. (2013). Interindividual variation in FFM losses is important to note; 43.7 and 32.0% of all weight lost by P1 and P4 was FFM compared to an increase in FFM of 3.8 and 11.5% in P2 and P3, respectively. Weight loss as high as 43% from FFM was reported previously by Robinson et al. (2015), while Petrizzo et al. (2017) reported no FFM loss in their natural bodybuilding case study. Thus, some competitors may be less or more likely to lose FFM than others due to individual factors.
Identifying strategies to preserve muscle mass during dieting is important for bodybuilders. Protein intake between 2.3-3.3 g/kg BW of LBM is recommended to maintain muscle during contest preparation (Helms, 2014). Participants 1 and 4 consumed at least 2.3 g/kg BW LBM throughout their diets, yet reported the greatest FFM losses. This suggests overall energy intake may play a more important role in preserving FFM. Indeed, Fagerberg (2018) proposed avoiding chronically low energy availability (LEA) with a cut-off of 30 kcal/kg FFM/day in females and 25 kcal/kg FFM/day in males, as chronic LEA may result in negative biopsychosocial effects including disproportionate FFM losses (Fagerberg et al., 2018). P1 and P4 had the lowest estimated EA (19.5 to 26.9 kcal/kg FFM/day), which might explain some of the FFM loses compared to P2 and P3 (estimated EA between 21.3 and 35.7 kcal/kg FFM/day 5M to PRE). However, this is speculative given the length of time spent below the Fagerberg thresholds rather than the estimated average energy intake may be important. Moreover, the limitations of dietary assessment and EA estimations should be considered (Shim et al., 2014). These results justify the need for individualized dietary and training strategies to minimize FFM losses.
Bodybuilding case studies previously reported the metabolic rate, thyroid hormone, testosterone, oestrogen, and leptin suppression, and elevated ghrelin during prolonged dieting (Mäestu et al., 2010). We observed that the testosterone level in the male cohort decreased from 5M to the PRE-levels before returning to 5M-levels POST, coinciding with the increase in FM, energy availability and anaerobic performance. Interestingly, testosterone levels returned to 5M-levels during POST for P1 despite failing to regain all previous weight. Purportedly, low-fat diets negatively affect testosterone and adrenal androgen concentrations compared to isocaloric high-fat diets (Dorgan et al., 1996; Hämäläinen et al., 1984). All participants were low-fat dieters (0.3 to 0.8 g per kg BW), and increased energy intake POST competition via protein, carbohydrate and fats; thus, direct links between fat intake and restoration of normal hormonal function may be speculative in bodybuilders. Finally, supplement intake was similar to British Professional natural bodybuilders (Chappell and Simper, 2018), with 4-24% of energy and 12-38% of protein energy coming from supplements.
The RMR decreased during the dieting phase before increasing POST in 3 of 4 participants relative to 1M. This increase in the PRE-phase may reflect an increase in metabolism during peaking plans the week prior to competition. The reduction in the RMR, however, is consistent with reports in dieting bodybuilders where Robinson et al. (2015) noted an ~200 kcal drop in requirements, while the restoration of the RMR might be explained by a return in leptin levels, thyroid function, and body mass reported previously (Alwan et al., 2019; Trexler et al., 2017). The RMR varied significantly compared to prediction equations which may be explained by prior days of exercise and energy intake, highlighting difficulties in capturing information from competitive athletes (Speakman and Sellman, 2003). Participants were normotensive, and blood pressure, and the HR decreased 5M to PRE mirroring findings from Hulmi et al. (2017). This decrease is probably caused by improved aerobic fitness, although a decrease associated with overtraining was proposed by Rossow et al. (2013). Blood pressure and the HR increased during POST, which is consistent with previous reports. All competitors’ FBG, CRP and blood lipids were within reference ranges, while CK was similar to other resistance training populations and within healthy limits (Baird et al., 2013).
Absolute and relative anaerobic power and capacity increased initially before declining 5M to PRE, then increasing POST. The initial increase may be a training effect of increased exercise efficiency; however, being extremely lean and in an energy deficit likely harmed performance despite improvements in the lean:fat mass ratio. Similar performance trends were observed among natural bodybuilders which resolved post competition (Robinson et al., 2015; Rohrig et al., 2017; Rosso et al., 2013; Trexler et al., 2017; Tinsley et al., 2018). Although, it is worth noting that not all performance variables declined, as HGS was unaffected. Furthermore, Hulmi et al. (2017) noted no decline in explosive and lower body strength during competition preparation.
No participants displayed eating disorder or BDD symptoms according to our questionnaires. EAT-26 scores were similar to a recent cross section of natural bodybuilders (Mitchell et al., 2017a). A meta-analysis, however, reported higher prevalence of eating disorder and BDD symptoms in bodybuilders compared to recreational exercisers (Mitchell et al., 2017b). Authors of a recent review on competitive bodybuilding strategies suggested that personality traits, in particular neuroticism, may be important factors in determining food and body image attitudes (Helms et al., 2019). Similarly to Tinsley et al. (2018), the present participants monitored their physiques and nutrition continuously and practiced restrained eating, without displaying characteristics of emotional eating. It might be more useful for researchers to develop bodybuilding-specific metrics, given the unique dietary perspectives and practices in competitive bodybuilding.
State anxiety was elevated on two occasions in P2 and P4, while their trait anxiety was elevated throughout the observation. Whether elevated anxiety was due to competition dieting, or this is simply a population with high trait anxiety is unknown. Cross sections of competitive bodybuilders have previously reported psychological distress with elevated anxiety, anger and short temper in male and female competitors (Andersen et al., 1985, 1998). Moreover, changes in mood states and psychological distress associated with competition dieting were also reported in case studies of bodybuilders (Robinson et al., 2013; Rohrig et al., 2017). In contrast, Hulmi et al. (2017) noted no change in mood states among 30 physique-sport competitors pre, during and post competition compared to controls.
Strengths and Limitations
Participants underwent urinalysis and polygraph testing in an effort to ensure natural status. Although we observed a small cohort, this allowed for detailed observations. While measurement timing was standardized relative to competition dates, outcomes were inherently influenced by acute magnitudes of energy deficiency and fatigue, and the body composition measurement techniques have known shortcomings. Throughout contest preparation, specific phases of training are particularly arduous as a result of training volume or energy restriction, which potentially influenced the results. Although we directed participants to attend testing fasted and abstain from exercise, the participants’ training schedule meant this was not always precise. Moreover, the psychological questionnaires were validated in non-bodybuilding populations, so their utility in bodybuilders requires further inquiry. Furthermore, additional markers of stress such as the hormone cortisol would have been useful to support the questionnaire data. Finally, performance was tested in a fasted state, which likely impacted our ability to recruit participants.
Conclusions and Reflections
P2 and P3 placed top 5 at the British finals, while P4 did not. P1 competed in two regional qualifying competitions, but failed to place. In the first author's opinion (an international bodybuilding judge), P2-P4 were competent amateurs who provided insights into how British natural bodybuilders prepared for competition. Regarding best practices, all competitors consumed sufficient protein (>2.3 g/kg BW) and dieted over a 6-month period achieving a 0.5-1.0% bodyweight loss weekly to promote FFM retention as per published guidelines (Helms et al., 2014). As a future strategy to better retain FFM, athletes may benefit from higher energy availability (> 30 kcal/kg BW) by either manipulating their training load or increasing energy intake. Planned diet breaks and refeeds to reduce time spent in a state of LEA should also be considered. Finally, rapid bodyweight and bodyfat regain seen by competitors in this study likely aided prompt recovery of physiological variables.
Researchers should focus on recruiting larger cohorts to determine if higher energy diets with sufficient protein are more effective at preserving FFM during calorie restriction. Furthermore, research determining optimal recovery of hormonal and physiological function is needed; specifically, if rapid compared to gradual weight regain is ideal. Finally, further assessment of the psychological effects of competition preparation in larger cohorts is needed to confirm or contradict our findings.