Introduction
In competitive platform diving athletes require a high level of performance quality and a high degree of difficulty of the dives in order to achieve the best competition results. FINA (2017) has defined in the competition regulations that the approach, the take-off, the flight and the entry should be judged on their overall impression. In that context, the take-off is of special importance because the diver has to produce the right forces and direction of the center of mass (COM) in order to achieve the required dive height, jumping distance and angular momentum for a perfect execution during the flight phase. Furthermore, research results show that the take-off phase directly influences performance because the athlete has only a few regulatory possibilities (change of mass moment of inertia) in the flight phase (Hamill and Golden, 1986; Koschorreck and Mombaur, 2011; Köthe, 2005; McCormick et al., 1982; Miller, 2000).
When developing an optimal take-off technique, technique training, especially dryland training, is the main component in long-term performance development. The outstanding impact of the take-off phase needs to be supported as part of technical training. It is indisputable that subjective feedback from the coach combined with augmented feedback (kinematics, kinetics, biofeedback) is required for technique training (Magill and Anderson, 2014; Maszczyk et al., 2018; Schmidt, 1999).
For this purpose, the Institute for Applied Training Science (IAT) designed a measuring and information system (MIS) which can be used as a training tool. The MIS synchronizes video data and ground-reaction forces in order to objectify kinetic and kinematic characteristics of the platform take-off such as the angular momentum, dive height, body angle, speed and the magnitude and direction of the torque. For the calculation of the kinematic variables, IAT in-house software for 2D-analyses was integrated into the MIS. All analysis results are stored in a central database and are available for the coaches and athletes on a large display to offer biomechanically supported feedback training. At the MIS, the diver performs preparatory dives in a foam pit, for example, the back 1¼ somersault tucked in preparation for the back 3½ somersault tucked (207 C) from the 10-m-platform.
The MIS was developed with the aim of providing objective data immediately to the coach. Therefore, an evaluation of key positions is preferred, inspired by the variables described by Miller et al. (1989) and Miller (2000) for back take-offs in diving. A detailed description of the key positions and the movement variables is provided in the Measures section (Point 3).
In order to optimize the take-off movement, it is necessary to detect sources of error in motion execution and intercede with special training routines. Therefore, reference values of kinetic and kinematic variables for the augmented feedback are required. It should be noted that, compared to the large amount of research in springboard diving, only few studies have focused on the take-off phase in platform diving. The research can be systematized into the following parts and relevant studies are listed: (1) descriptive analyses to understand physical principles (Huber, 2016; Miller, 2000; O´Brian, 2003), kinematic analyses (Park and Yoon, 2017; Spriging and Miller, 2004), kinetic analyses (Hamill et al., 1985; Vieira et al., 2017), analyses of the interaction between kinematics and kinetics (Mathiyakom et al., 2007; Miller et al., 1989), modeling (Koschorreck and Mombaur, 2011; Wooten and Hodgins, 1996) and performance requirements (Vieira et al., 2017).
In the studies presented, various body models were used (e. g. de Leva, 1996; Zatsiorsky and Seluyanov, 1982) and the focus was put on different dives. Since the selection of the body model has a considerable influence on kinematic results concerning the COM or moment of inertia, it is not possible to create a set of reference values from the literature which could be used in the MIS.
Therefore, the aim of the study was to determine kinematic and kinetic reference values for the MIS based on a mathematical model. For this purpose, kinematic and kinetic data were used to clarify the relationships between motion variables and to predict values by statistical modelling.
Our research is restricted to the take-off for the back 3½ somersault tucked. This dive is aside from the back 2½ somersault piked for women and aside from the back 3½ somersault piked for men the standard dive for dive group 2 in the Olympic Games and World Championships. In addition, learning this dive is important in order to succeed in the Junior World Championships and as part of long-term performance development.
Methods
Data selection
The MIS was used in a variety of performance diagnostics between 2012 and 2018. The preparatory dive back 1¼ somersault tucked was performed 242 times by national and international elite divers of the German Swimming Federation (DSV). These dives represent the baseline. Only trials with a high level of performance quality from this expert population were used for the analysis in order to develop a stochastic model for the MIS. Only athletes who presented the dive 207 C (10- m-platform) or 205 C (5-m-platform) in competition with a quality of at least 6.5 points were involved. In addition, only those trials were selected which matched the criteria of a typical force curve described by Miller (1989, 2000). This includes, for example: harmonic opening movement (smooth lifting in a toe position), characteristic of a 2nd and 3rd maximum force of the vertical ground reaction force Fz, the position of the horizontal maximum force Fx in the area of reversal of motion.
We selected 18 dives performed by 10 different athletes (5 male and 5 female). At the time of the test they were 16.5 ± 5.1 years old, had a body weight of 54.9 ± 10.9 kg and their body height was 1.63 ± 0.1 m. One of them had participated in the Olympic Games, one in the World Championships, four in World and European Junior Championships, one in a Diving Grand Prix and two in the German Diving Championships. At the time of this study, the training load of athletes was 20-25 h per week (5 – 6 days).
Measures
The MIS was set up in the testing area of the IAT and the hardware consisted of the following synchronized components: a Basler camera “Aviator” to capture video data (up to 100 Hz), a Kistler force plate (100 x 100 cm) to measure the vertical (Fz) and horizontal (Fx) ground reaction forces with a sampling frequency of 500 Hz, a data-processing computer and a whiteboard to present the analyses for coaches and athletes. The MIS was positioned at the edge of a foam pit, which allowed a high number of repetitions to increase the training load while reducing the risk of injury in the training routine.
The following list shows the observed key positions and Figure 1 is an example of the ground reaction forces with the key positions.
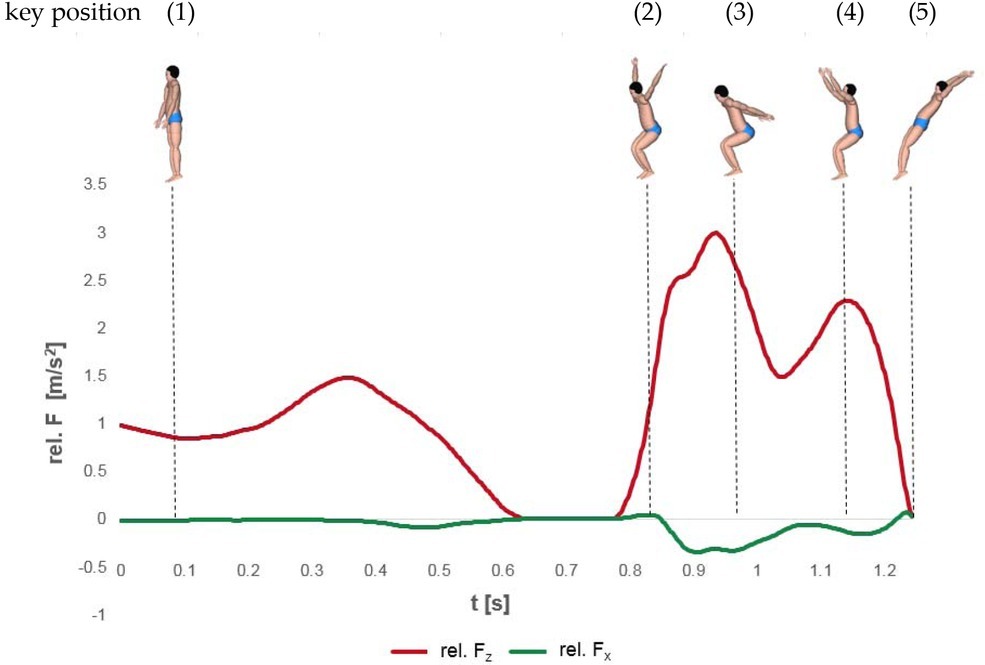
resting position before the initial weighting (Fz corresponds to body weight of the athlete)
beginning of the braking impact (Fz corresponds to body weight of the athlete)
beginning of the major weighting - reversal point of the brake impulse and acceleration impulse
second maximum of Fz
final unweighting – leaving the platform.
Pose 1 is a resting position before the movement starts, thus the pose was not considered in the model.
For the development of the stochastic model, the following variables were captured with the MIS for the key positions described above:
body weight normalized forces Fz und Fx
arm-torso angle (αAT) - angle between the upper body and the upper arm (hip, shoulder, elbow)
elbow angle (αE) - angle between the forearm and the upper arm (shoulder, elbow and wrist)
upper-body angle (αUB ) - angle between the shoulder, hip and the perpendicular line
hip angle (αH) - angle between the upper-body and the thigh (shoulder, hip and knee)
knee angle (αK) - angle between the upper and the lower leg (hip, knee and ankle)
angle of the body position (αBP) - angle of the main axis of inertia to the vertical.
The mass distribution model according to Zatsiorsky and Seluyanov (1983) was used in the MIS to calculate the body position angle (variable number 7).
Statistical Analysis
In order to develop the mathematical model for the backward take-off, a multi-step examination plan was used in this study. The aim of part 1 was to define the variables of the model. For this purpose, nonparametric correlation analyses rs of the kinematic and kinetic motion variables of each separate pose were calculated. Variables were ranked on the basis of the magnitude of the correlations, whereby only correlations of rs ≥ 0.5 were taken into account. Since variables can correlate with each other several times, the strongest correlation is was used for further modelling. Thus, each motion variable could be included only once in the model for one specific pose. The aim of part 2 was to use statistical modelling to predict values for particular variables. For this purpose, the linear regression equations and the coefficients of determination r2 were determined for the correlations verified in part 1. In addition, the confidence intervals (CI = 95%) of the regression lines (PASS, 2019) were calculated to determine their validity range.
The third part (3) linked the results from part 1 and part 2 to a stochastic model. Therefore, the regression equations from part 2 were assigned to the ranking order of the correlations from part 1. The criteria and predictors of the regression equations were calculated stepwise using an initial predictor. The criterion determined in the first regression equation was used as a predictor in the second regression equation. With the exception of the initial predictor, all criteria and predictors were signed with a lowered M (e.g. αATM for the calculated arm-torso angle in the model). The initial predictor was defined as the variable which correlated most closely with other variables and the minimum and maximum specified the validity range of the model. Consequently, all other variables could be calculated based on this initial predictor.
Results
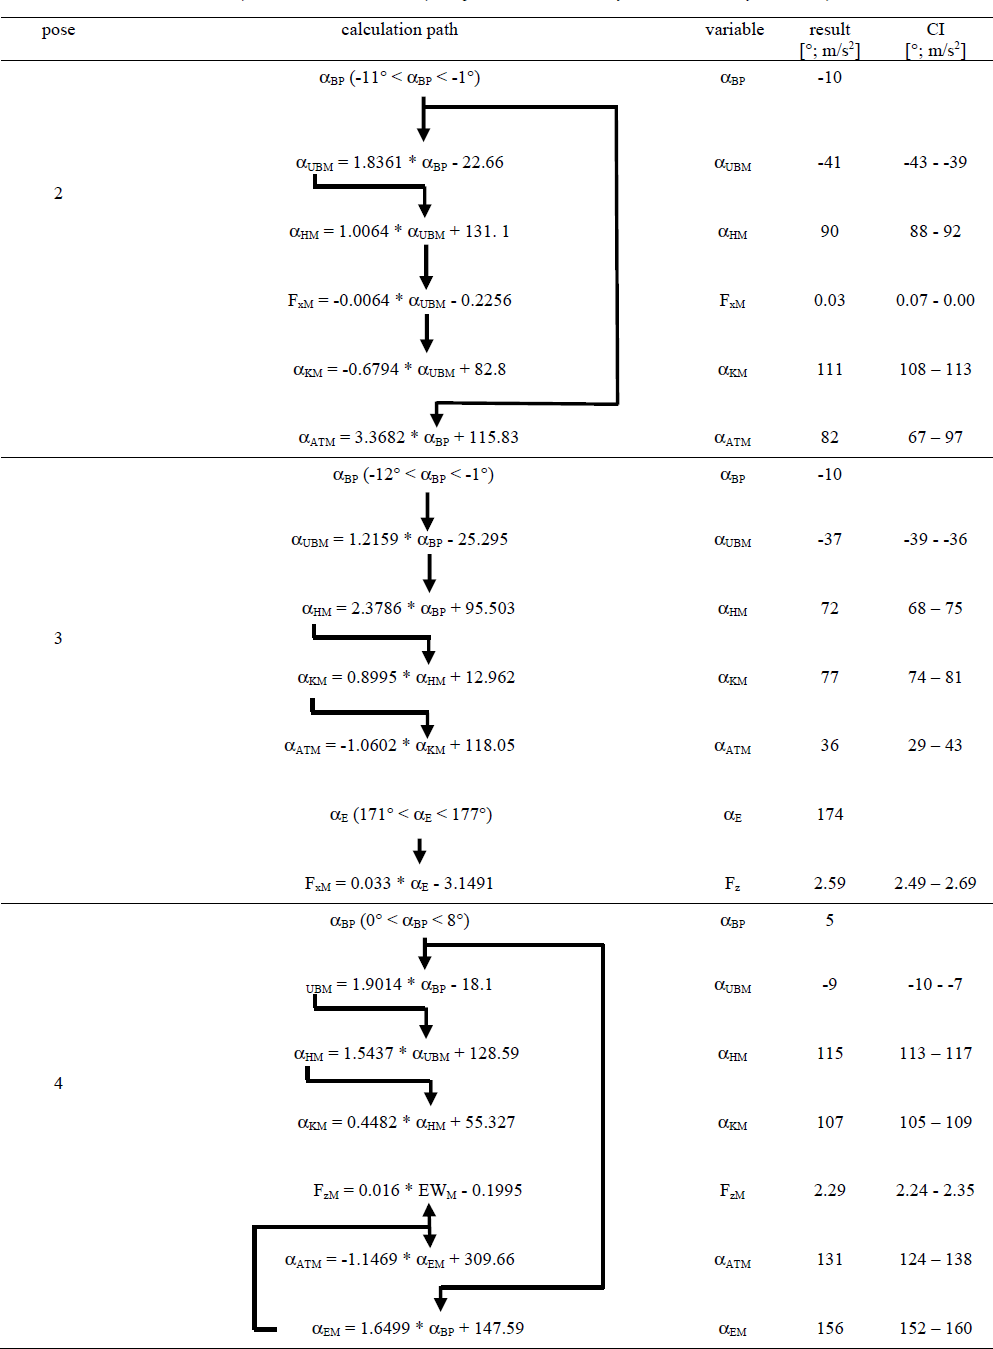
In Table 1, correlation coefficients of the motion variables are ranked and the regression equations are listed for poses 2, 3 and 4. The results show that the αBP was the initial predictor for all poses of the model.
Table 1
Ranking of correlation coefficients and the regression equations of each pose
The model had a validity range of -11° < αBP < -1° for pose 2, -12° < αBP < -1° for pose 3, 0° < αBP < 8° for pose 4. There is also a second model for pose 2. The αE and Fx correlated with each other independent of other motion variables. The validity range was 171° < αE < 177°.
Table 2 shows the step-by-step calculation path for pose 2. The calculation path is marked with arrows and the results and the confidence limits are listed with an example of αBP = 10°.
For poses 1 and 5, no correlations between the movement variables could be detected. Table 3 shows the mean values and standard deviations for the determined motion variables acting as reference values in the model.
Discussion
This study aimed to develop a mathematical model to predict individualized limits for kinematics and kinetics of the take-off phase for the back 3½ somersault tucked (207C). Based on combined linear regressions of kinetic and kinematic variables, the model approach presented here describes the confidence limits for key positions. Pose 2 (beginning of the braking impact) can be generalized by the body being in a slightly forward position (-11° < αBP < -1°). The less the body is tilted forward, the more the torso is upright. This is accompanied by extended hips, more flexed knees and a delayed arm swing. Pose 3 (beginning of the major weighting) can also be summarized by the body being in a slightly forward position (-12° < αBP < -1°). However, here the body is less tilted forward, in connection with a more upright torso, extended hips and knees, and arms which are swung further downwards. For Pose 4 (second maximum of Fz), the body should be in a slightly tilted backward position (0° < αBP < 8°). The more the body is tilted backwards, the more upright the torso. This goes hand in hand with extended hips and knees, and arms which are swung further upwards.
In general, kinematic and kinetic studies of backward take-offs in platform diving are rare. In addition, existing studies explain the optimal execution on the basis of individual cases or generalized results. Miller (1989, 2000) described the kinetic and kinematic characteristics of 10-m platform backward take-offs of 29 male and 26 female athletes taking part in the World Championships in 1986. One result of that comprehensive descriptive analysis is that minimal inward somersaulting angular momentum is generated during the initial weighting phase. This can be related to our results in poses 2 and 3 where the body is in a slightly tilted forward position. For the knee angle at the beginning of the major weighting (pose 3), O´Brian (2003) recommended a knee angle of at least 90°. In contrast, Huber (2016) reported highly individual solutions for the execution of this position from very small (heels almost touch the glutes) to very wide knee angles. Park and Yoon (2017) in turn analyzed five experienced athletes and reported a mean knee angle of 111° for the back 3½ somersault piked (207B). Our model recommends a knee angle of 63° - 107°, depending on the individual preconditions. This high degree of variability during the take-off can be rated as individualized movement strategies of elite divers and can be explained by differences in the skill level as well as anthropometric features of the athletes analyzed.
This highlights the particular value of the model, being able to predict individual limits for optimal execution. The proposed model enables individualized feedback based on objective movement variables, allows a target-performance comparison and predicts an optimal take-off technique. From a coach´s point of view, this is helpful in guiding the training process, thereby making it more efficient to improve the technical competence of the diver. This is due to the fact that: (1) the target/actual performance comparison errors in movement execution can be identified efficiently at an early stage of the learning process, thus allowing precise movement corrections to be initiated; (2) the target/actual comparison enables the coach to develop a focus of attention when observing movements in the daily training routine; (3) the athlete's movement perception can be specifically trained, (4) the model shows the interrelationships of the kinetic and kinematic variables, allowing the coach to predict the effects of movement corrections.
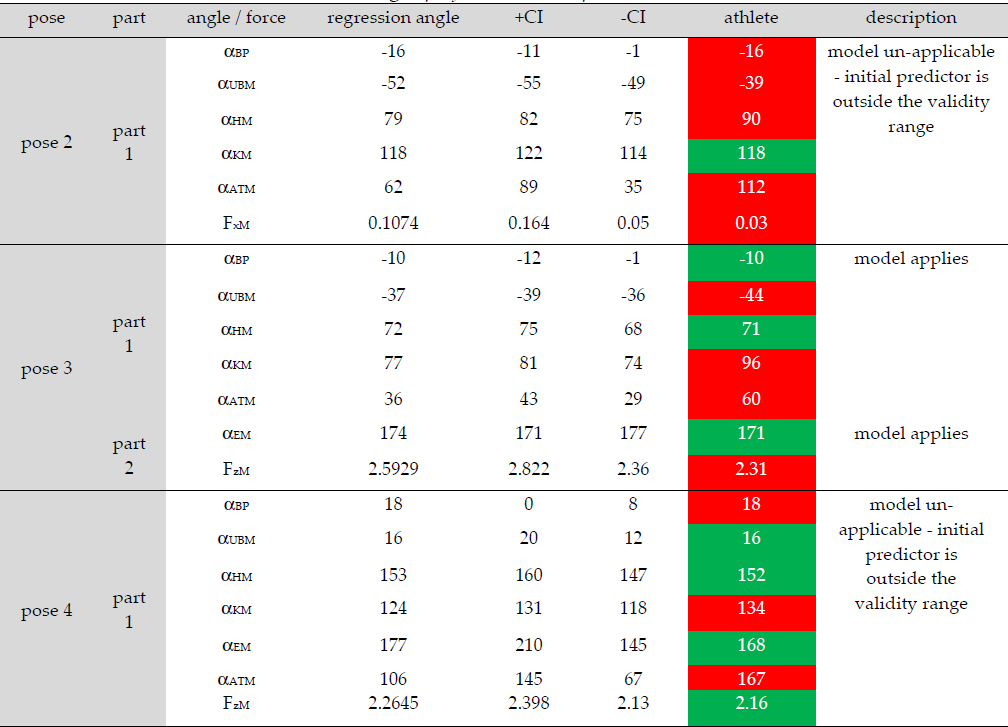
When the model is practically applied, individualized assessments of the take-off can be performed. The procedure will be demonstrated using an example. A trial was selected which was obviously below the requirements with regard to dive height and angular velocity. The target-performance comparison (Table 4) shows that, with a few exceptions, kinematic and kinetic variables of the athlete are outside the confidence limits of the model (marked in red). In this case, the causes for execution deficits are very diverse: (1) the model cannot be applied to pose 2 because the αBP was 5° outside the validity range. The fact that the athlete was tilted too far forward was interpreted as the main failure; (2) regarding pose 3, the torso was tilted too far forward, resulting from a knee which was too extended; (3) in pose 3, the athlete swung the arms forward too late; (4) the model could not be used for pose 4 because the αBP was 10° outside the confidence limits. The body was bent too far backwards.
This study has limitations which need to be acknowledged. The model should be used as a complementary tool because we used a combined sample of men and women. Based on Sanders and Gibson's (2003) analysis in springboard diving, we assume that significant differences of motion variables exist between women and men. A larger sample could help improve the accuracy of the model, one for women, one for men. The data were recorded under laboratory dryland conditions (the MIS was mounted at the foam pit) limiting the accuracy of the model with regard to “real” dives from a 10-m-platform. To improve the individual prediction, future studies should account for anthropometric features, strength, and coordinative abilities, as these significantly influence the take-off in platform diving. Furthermore, future studies could use neural models to predict variables as they have been successfully used in other sports (e.g. Kipp et al., 2018; Maszczyk et al., 2011, 2014).
Conclusions
In technical-acrobatic sports, subtleties of movement execution determine success and failure during competition. Based on the results, we conclude that for an optimal take-off movement, specific relationships of biomechanical variables should be matched at key positions. The mathematical model introduced here can be used to provide objective and individual feedback for an optimal take-off in platform diving. Furthermore, this model can be used during long-term performance development to monitor the fundamental development of the ideal take-off technique. In addition to subjective evaluation by the coaches, the model can support the assessment process with objective results. The approach presented here can be extended in several directions: (a) since it is modular in its structure, other kinetic and kinematic variables can be integrated into the model, (b) it can be applied in other dive groups, (c) it can be adopted to other sports where the importance of the take-off is very high, e.g. gymnastics, high jump or ski jumping.